. 2022 Dec 30;12(1):22589.
doi: 10.1038/s41598-022-26081-6.

Pre-exposure cognitive performance variability is associated with severity of respiratory infection

Affiliations

Pre-exposure cognitive performance variability is associated with severity of respiratory infection

Yaya Zhai et al. Sci Rep. .

Abstract

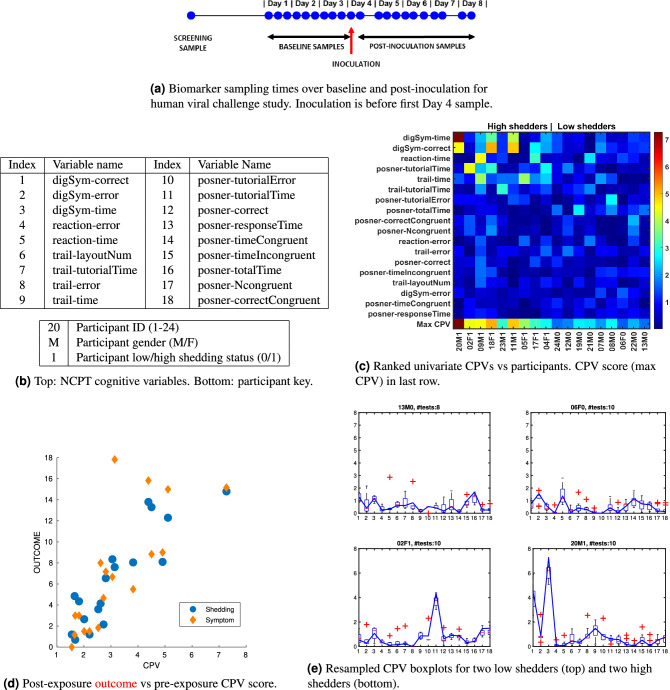
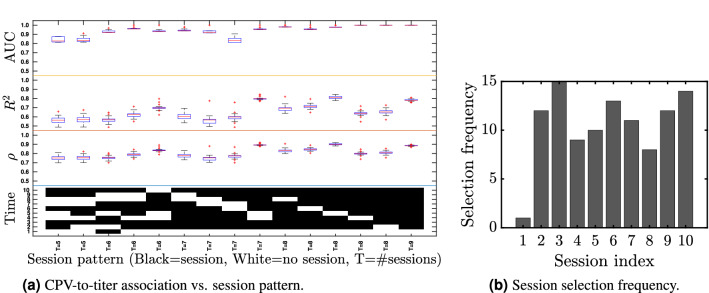
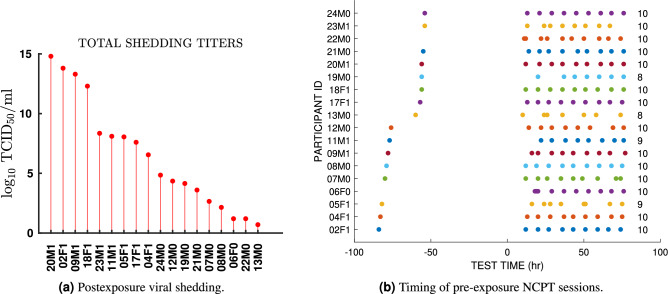
Using data from a longitudinal viral challenge study, we find that the post-exposure viral shedding and symptom severity are associated with a novel measure of pre-exposure cognitive performance variability (CPV), defined before viral exposure occurs. Each individual's CPV score is computed from data collected from a repeated NeuroCognitive Performance Test (NCPT) over a 3 day pre-exposure period. Of the 18 NCPT measures reported by the tests, 6 contribute materially to the CPV score, prospectively differentiating the high from the low shedders. Among these 6 are the 4 clinical measures digSym-time, digSym-correct, trail-time, and reaction-time, commonly used for assessing cognitive executive functioning. CPV is found to be correlated with stress and also with several genes previously reported to be associated with cognitive development and dysfunction. A perturbation study over the number and timing of NCPT sessions indicates that as few as 5 sessions is sufficient to maintain high association between the CPV score and viral shedding, as long as the timing of these sessions is balanced over the three pre-exposure days. Our results suggest that variations in cognitive function are closely related to immunity and susceptibility to severe infection. Further studying these relationships may help us better understand the links between neurocognitive and neuroimmune systems which is timely in this COVID-19 pandemic era.


Conflict of interest statement

The authors declare no competing interests.

Figures

Figure 1
Figure 1
Pre-exposure cognitive performance variability (CPV) score is strongly associated with post-exposure outcome. (a) Challenge study layout showing baseline and post-inoculation biomarker sampling times for a study participant. (b) Definition of 18 NCPT variables measuring participant performance on 4 different tests: Digital Symbol Coding (DigSym), Go/No-Go (Reaction), Trail Making (Trail) and Attention Cuing (Posner). (c) Heatmap of univariate CPV scores for each study participant. participants are ordered from left to right in terms of decreasing amounts of post-exposure shedding. NCPT measures are ordered from top to bottom in terms of decreasing CPV max value over the participants. (d) Scatterplot of CPV and outcome for the 18 participants. Shedding (log10 TCID50/ml) and symptom (modified Jackson score) are aggregated over the full post-exposure period of the study. (e) Boxplots of the resampled univariate CPV scores, computed by successively leaving out a session, over the 18 NCPT variables in Fig. 1b for two of the lowest shedding (top row) and two of the highest shedding (bottom row) challenge study participants. Solid blue curve indicates the CPV scores shown in heatmap (c).
Figure 2
Figure 2
Lumos session timing patterns corresponding to the 15 highest CPV vs shedding correlations. Left: Boxplots of association measures between CPV and shedding for which the cross-validated (leave-one-participant-out) CPV Pearson correlation coefficients are at least 0.69 (the lower endpoint of 95% CI of correlation in Fig. 1d). The measures of association are the Pearson correlation coefficient ρ, the R2 of linear regression, and the AUC of logistic regression of titers onto CPV. The AUC measures the association of CPV with Low vs High shedding (0,1) labels, where Low and High denote shedding below or above the population median, respectively. The pattern heatmap at bottom indicates the corresponding timing patterns of Lumos sessions with Time 1 corresponding to the initial screening and Time 10 corresponding to the test right before exposure. The number of sessions in each pattern is denoted by T, fewer than T=7 sessions significantly reduces the association. Right: relative frequency of inclusion of session times 1,10 in (a) (summed over session patterns).
Figure 3
Figure 3
Total post-exposure viral shedding and pre-exposure NCPT session timing. (a) Total amount of viral shedding accumulated from the time of exposure to the end of the study, indexed over participant ID’s. The participant ID encodes the participant index (numeric first two characters from 1 to 20) the participant gender (M or F second character) and whether the participants’ shedding is below or above (0 or 1) the population median of total viral shedding (5.7 titers). (b) Timing of the pre-exposure NCPT testing sessions for each of the 18 challenge study participants during the baseline part of the challenge study (0–80 h), which precedes exposure to the HRV pathogen. Appearing on the far left of the figure are the participants’ initial screening sessions which, for all but two participants, occurred several days before the start of the study. At far right of the figure is shown the total number of sessions, varying between 8 and 10, for each participant.

Similar articles

Cited by

References

    1. Salthouse TA. Implications of within-person variability in cognitive and neuropsychological functioning for the interpretation of change. Neurpsychology. 2007;21:401–411. doi: 10.1037/0894-4105.21.4.401. - DOI - PMC - PubMed
    1. Shipley BA, Der G, Taylor MD, Deary IJ. Cognition and all-cause mortality across the entire adult age range: Health and lifestyle survey. Psychosom. Med. 2006;68:17–24. doi: 10.1097/01.psy.0000195867.66643.0f. - DOI - PubMed
    1. Haynes BI, Bauermeister S, Bunce D. A systematic review of longitudinal associations between reaction time intraindividual variability and age-related cognitive decline or impairment, dementia, and mortality. J. Int. Neuropsychol. Soc. 2017;23:431–445. doi: 10.1017/S1355617717000236. - DOI - PubMed
    1. Kipnis J, Gadani S, Derecki NC. Pro-cognitive properties of t cells. Nat. Rev. Immunol. 2012;12:663–669. doi: 10.1038/nri3280. - DOI - PMC - PubMed
    1. Serre-Miranda C, et al. Cognition is associated with peripheral immune molecules in healthy older adults: A cross-sectional study. Front. Immunol. 2020;11:2045. doi: 10.3389/fimmu.2020.02045. - DOI - PMC - PubMed

Publication types