

Evolutionary scaling of maximum growth rate with organism size
- PMID: 36585440
- PMCID: PMC9803686
- DOI: 10.1038/s41598-022-23626-7
Evolutionary scaling of maximum growth rate with organism size
Abstract
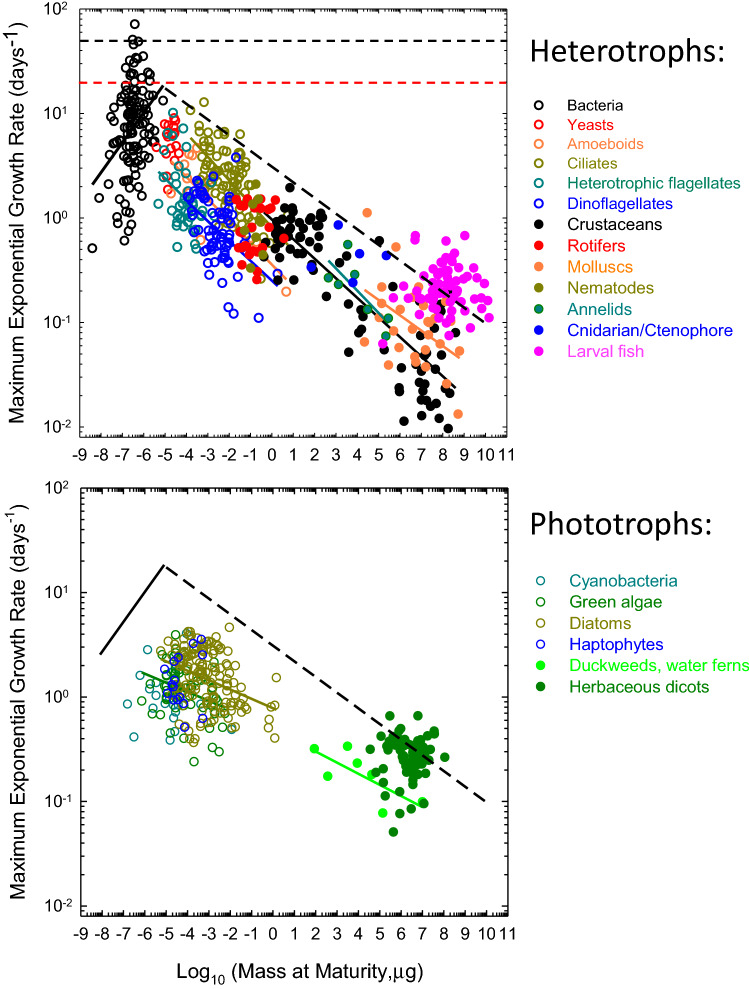
Data from nearly 1000 species reveal the upper bound to rates of biomass production achievable by natural selection across the Tree of Life. For heterotrophs, maximum growth rates scale positively with organism size in bacteria but negatively in eukaryotes, whereas for phototrophs, the scaling is negligible for cyanobacteria and weakly negative for eukaryotes. These results have significant implications for understanding the bioenergetic consequences of the transition from prokaryotes to eukaryotes, and of the expansion of some groups of the latter into multicellularity. The magnitudes of the scaling coefficients for eukaryotes are significantly lower than expected under any proposed physical-constraint model. Supported by genomic, bioenergetic, and population-genetic data and theory, an alternative hypothesis for the observed negative scaling in eukaryotes postulates that growth-diminishing mutations with small effects passively accumulate with increasing organism size as a consequence of associated increases in the power of random genetic drift. In contrast, conditional on the structural and functional features of ribosomes, natural selection has been able to promote bacteria with the fastest possible growth rates, implying minimal conflicts with both bioenergetic constraints and random genetic drift. If this extension of the drift-barrier hypothesis is correct, the interpretations of comparative studies of biological traits that have traditionally ignored differences in population-genetic environments will require revisiting.
© 2022. The Author(s).
Conflict of interest statement
The authors declare no competing interests.
Figures
Similar articles
-
A nonadaptive explanation for macroevolutionary patterns in the evolution of complex multicellularity.Proc Natl Acad Sci U S A. 2024 Feb 13;121(7):e2319840121. doi: 10.1073/pnas.2319840121. Epub 2024 Feb 5. Proc Natl Acad Sci U S A. 2024. PMID: 38315855 Free PMC article.
-
The repatterning of eukaryotic genomes by random genetic drift.Annu Rev Genomics Hum Genet. 2011;12:347-66. doi: 10.1146/annurev-genom-082410-101412. Annu Rev Genomics Hum Genet. 2011. PMID: 21756106 Free PMC article. Review.
-
The divergence of mutation rates and spectra across the Tree of Life.EMBO Rep. 2023 Oct 9;24(10):e57561. doi: 10.15252/embr.202357561. Epub 2023 Aug 24. EMBO Rep. 2023. PMID: 37615267 Free PMC article. Review.
-
The evolutionary scaling of cellular traits imposed by the drift barrier.Proc Natl Acad Sci U S A. 2020 May 12;117(19):10435-10444. doi: 10.1073/pnas.2000446117. Epub 2020 Apr 28. Proc Natl Acad Sci U S A. 2020. PMID: 32345718 Free PMC article.
-
The lower bound to the evolution of mutation rates.Genome Biol Evol. 2011;3:1107-18. doi: 10.1093/gbe/evr066. Epub 2011 Aug 4. Genome Biol Evol. 2011. PMID: 21821597 Free PMC article.
Cited by
-
Genomic Mysteries of Giant Bacteria: Insights and Implications.Genome Biol Evol. 2023 Sep 4;15(9):evad163. doi: 10.1093/gbe/evad163. Genome Biol Evol. 2023. PMID: 37708391 Free PMC article.
-
A Narrow Range of Transcript-error Rates Across the Tree of Life.bioRxiv [Preprint]. 2025 Jan 14:2023.05.02.538944. doi: 10.1101/2023.05.02.538944. bioRxiv. 2025. Update in: Sci Adv. 2025 Jul 11;11(28):eadv9898. doi: 10.1126/sciadv.adv9898. PMID: 39868080 Free PMC article. Updated. Preprint.
-
The bioenergetic cost of building a metazoan.Proc Natl Acad Sci U S A. 2024 Nov 12;121(46):e2414742121. doi: 10.1073/pnas.2414742121. Epub 2024 Nov 7. Proc Natl Acad Sci U S A. 2024. PMID: 39508768 Free PMC article.
-
Scaling of respiration in colonial invertebrates.Limnol Oceanogr. 2024 Aug;69(8):1746-1756. doi: 10.1002/lno.12626. Epub 2024 Jul 5. Limnol Oceanogr. 2024. PMID: 40453758 Free PMC article.
-
A narrow range of transcript-error rates across the Tree of Life.Sci Adv. 2025 Jul 11;11(28):eadv9898. doi: 10.1126/sciadv.adv9898. Epub 2025 Jul 11. Sci Adv. 2025. PMID: 40644547 Free PMC article.
References
Publication types
MeSH terms
Grants and funding
LinkOut - more resources
Full Text Sources
