. 2023 Jan;4(1):128-147.
doi: 10.1038/s43018-022-00491-x. Epub 2022 Dec 30.

Multiomics in primary and metastatic breast tumors from the AURORA US network finds microenvironment and epigenetic drivers of metastasis

Collaborators, Affiliations

Multiomics in primary and metastatic breast tumors from the AURORA US network finds microenvironment and epigenetic drivers of metastasis

Susana Garcia-Recio et al. Nat Cancer. 2023 Jan.

Abstract

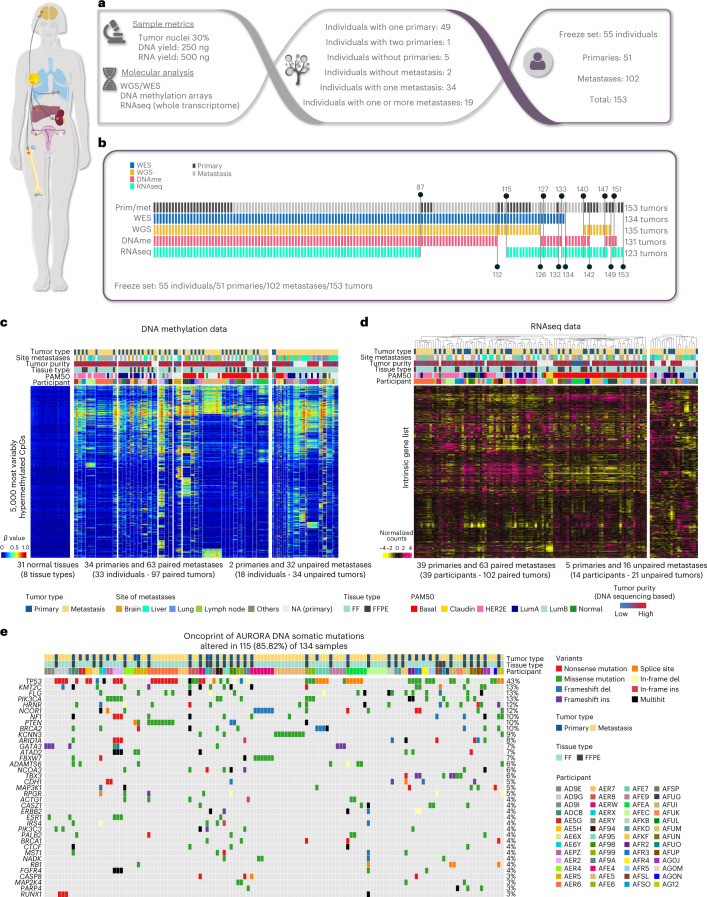
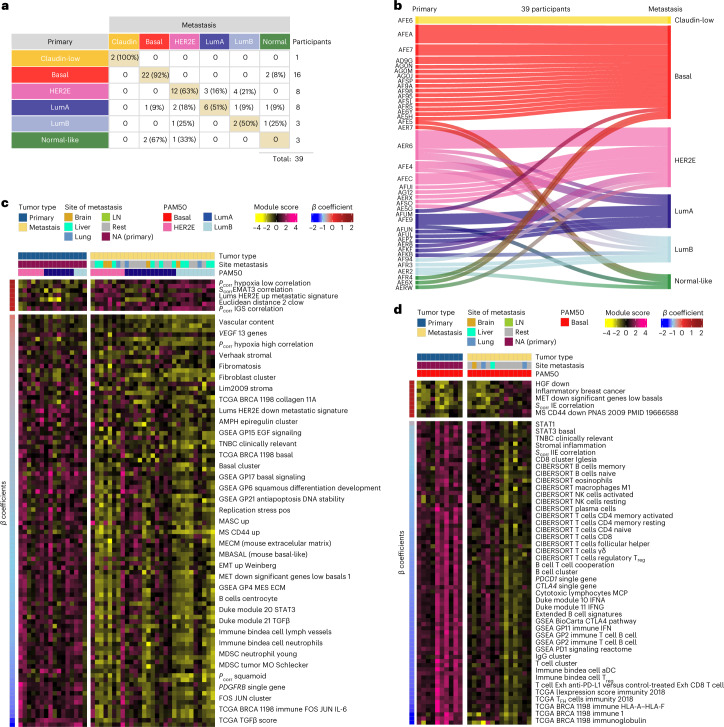
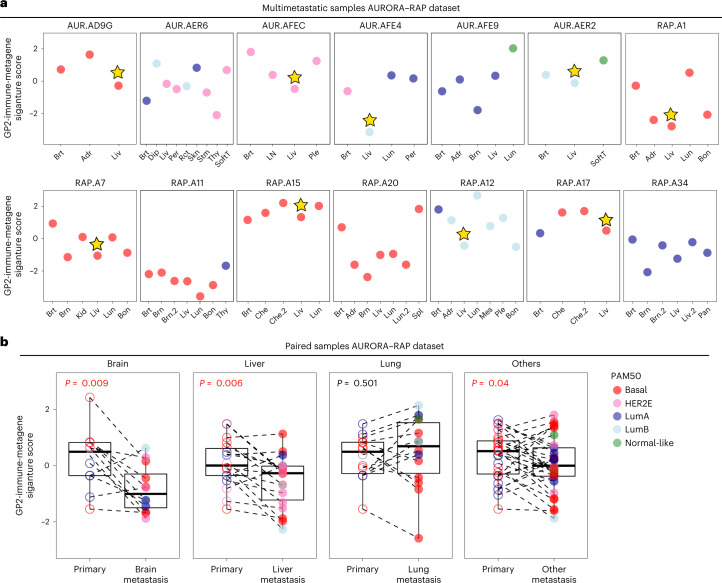
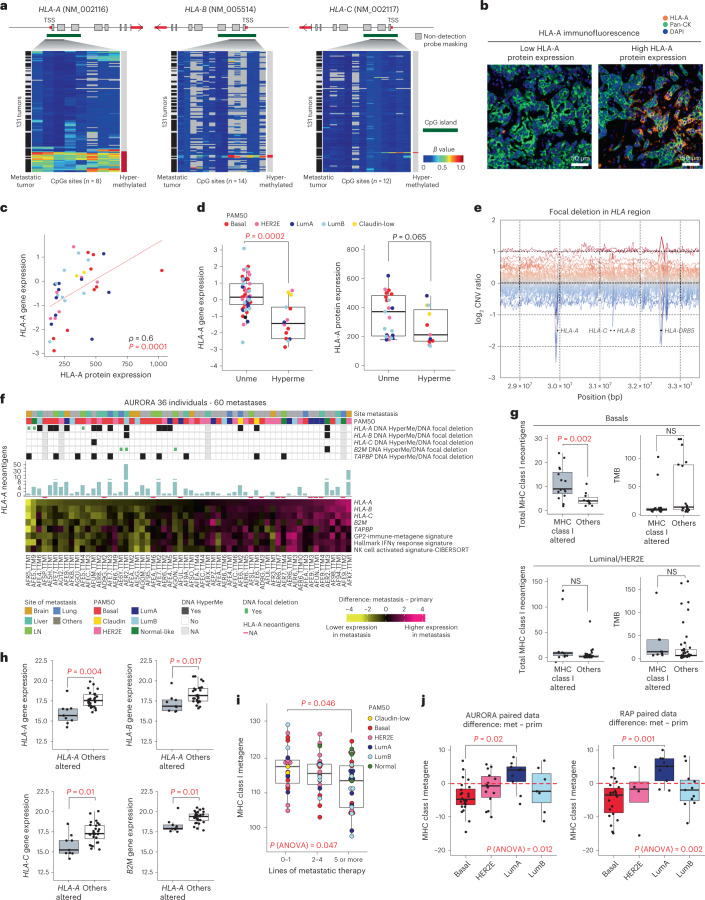
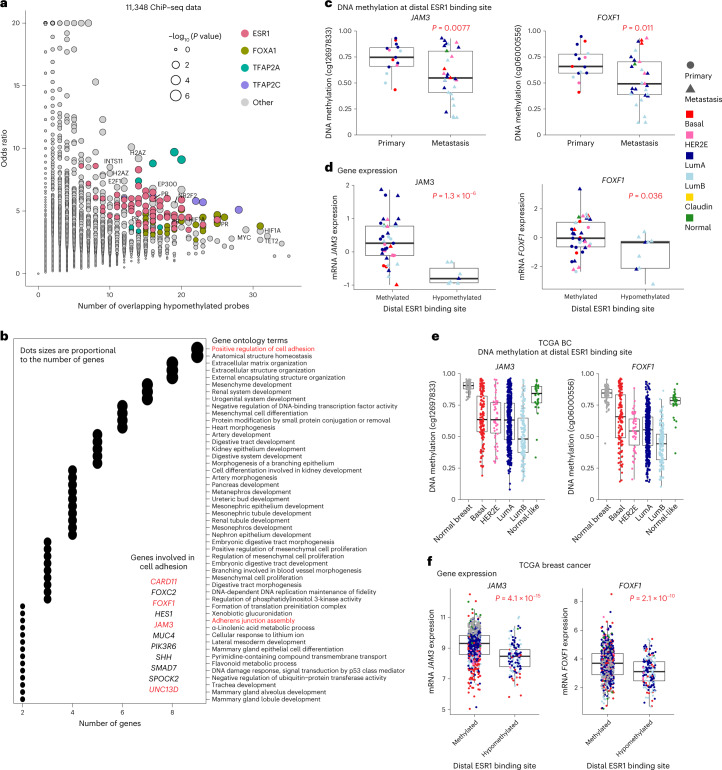
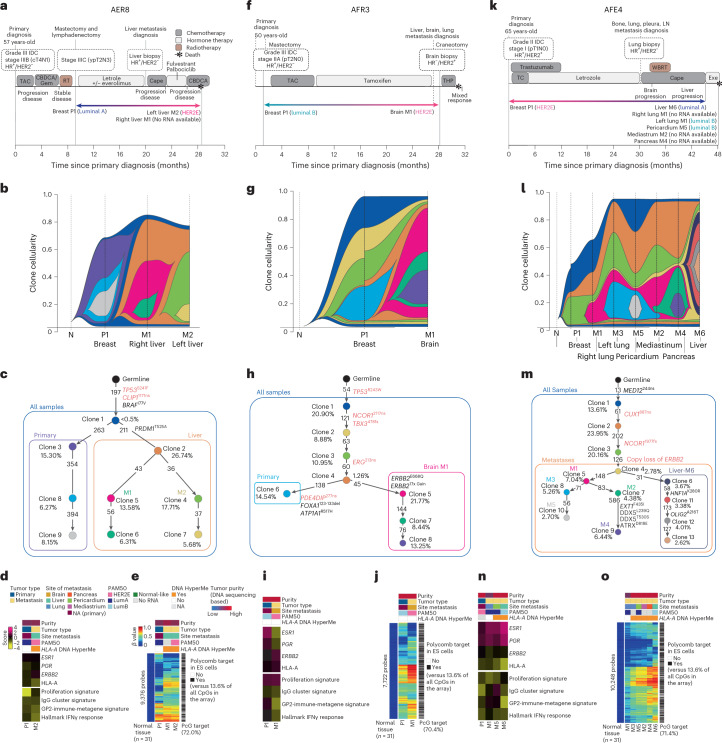
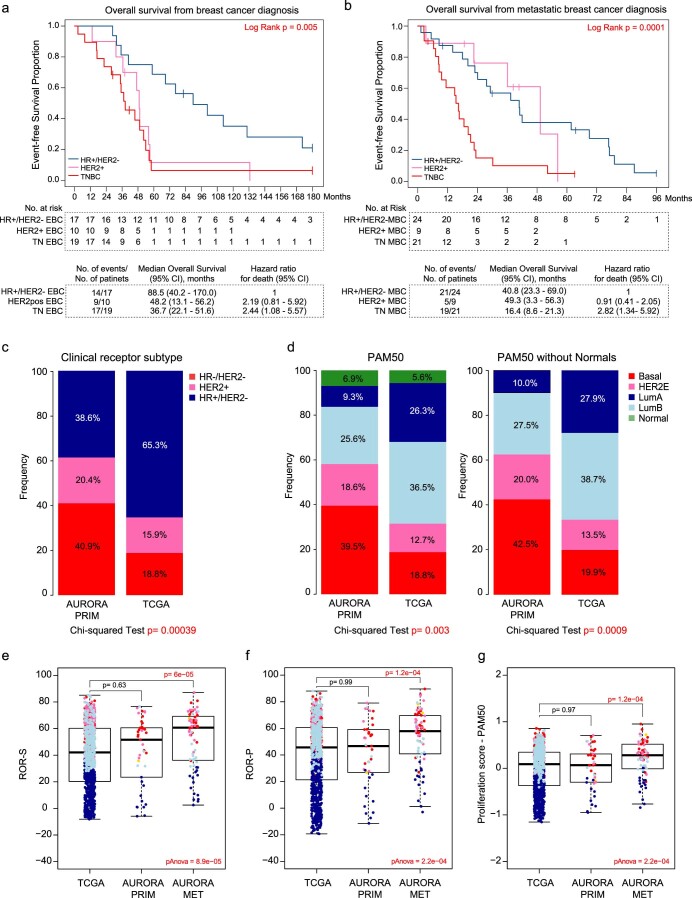
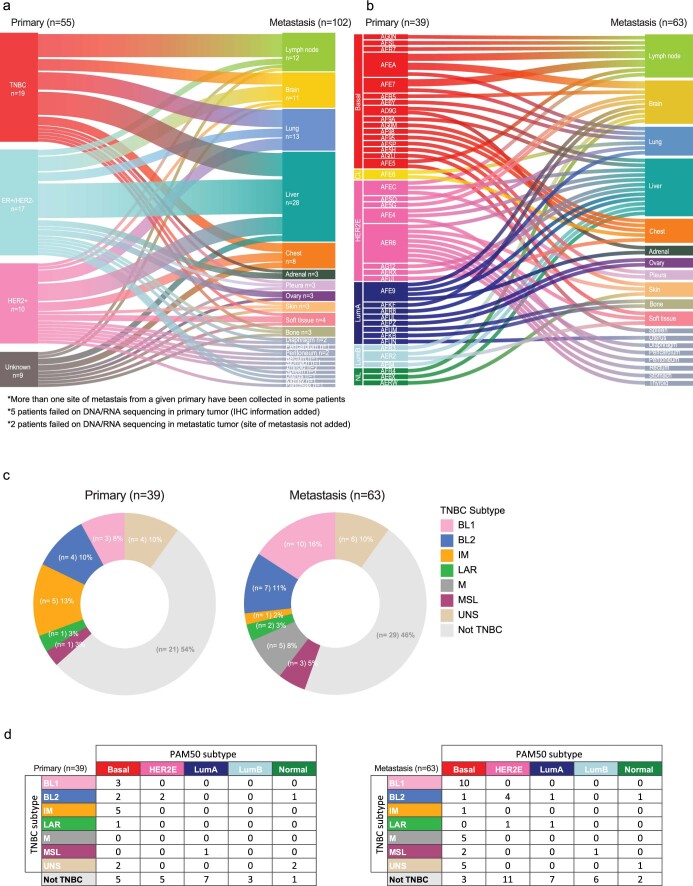
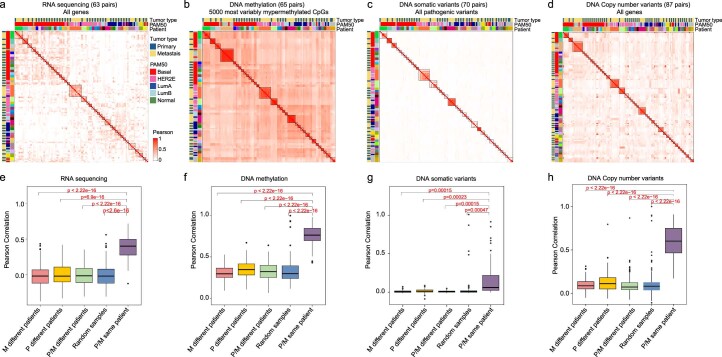
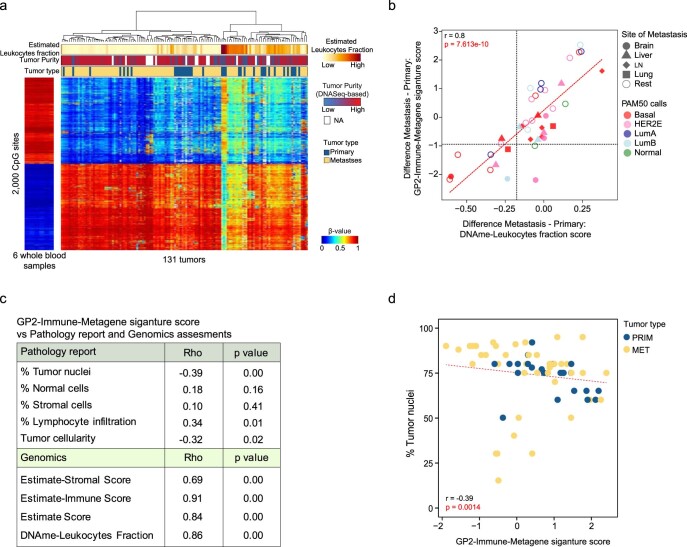
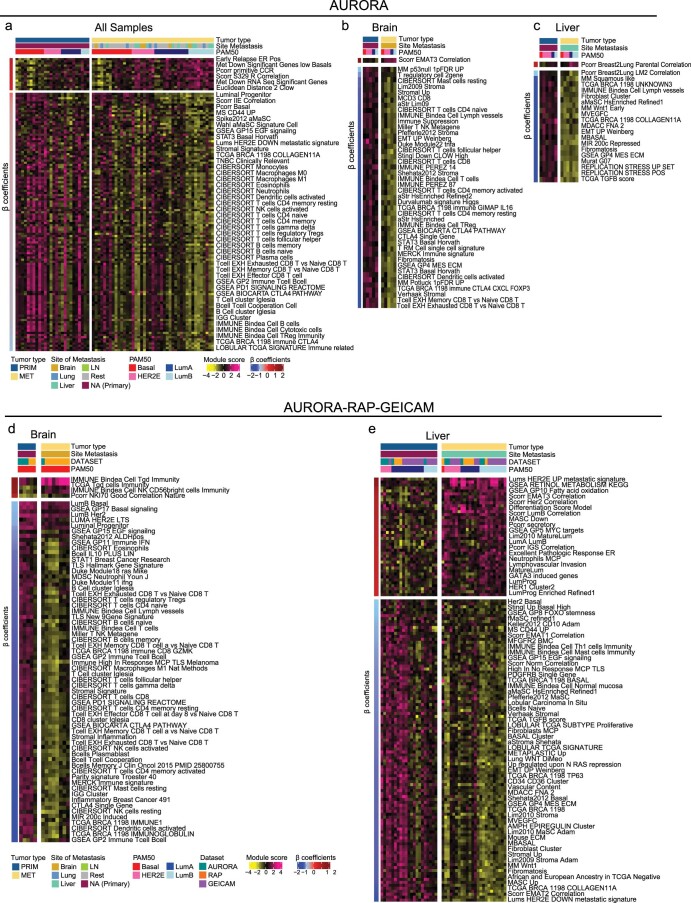
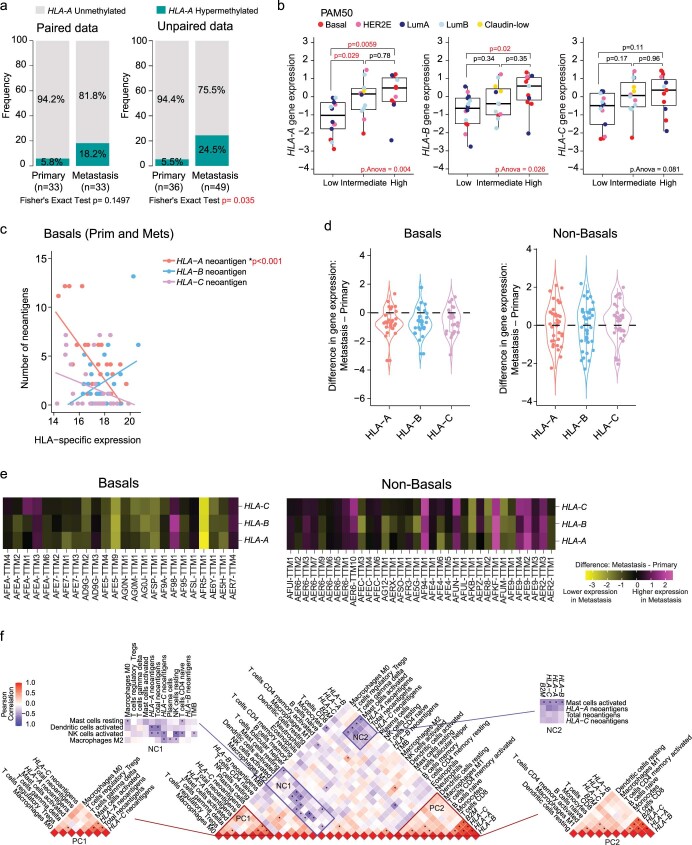
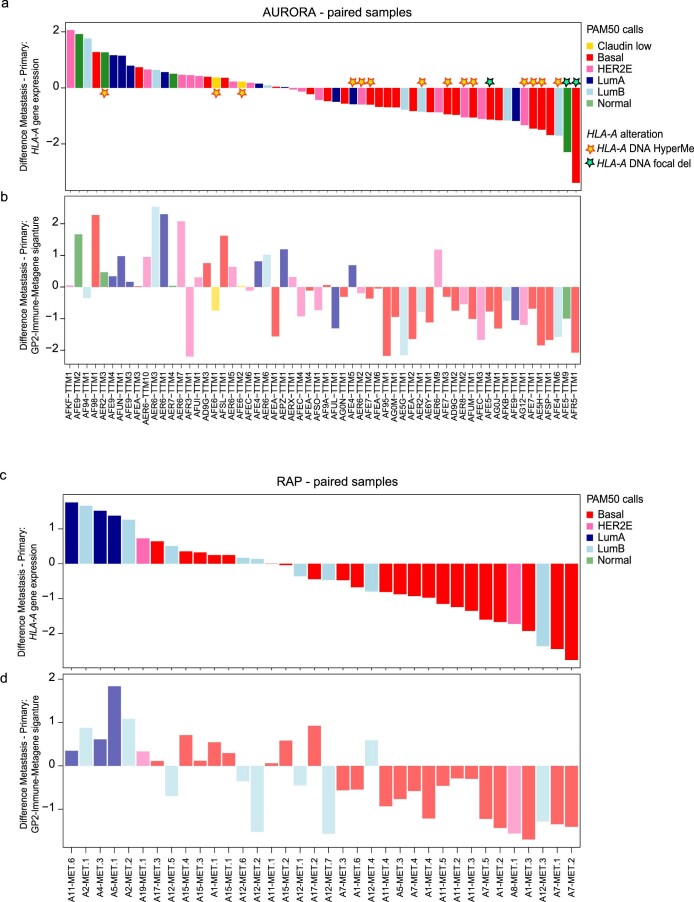
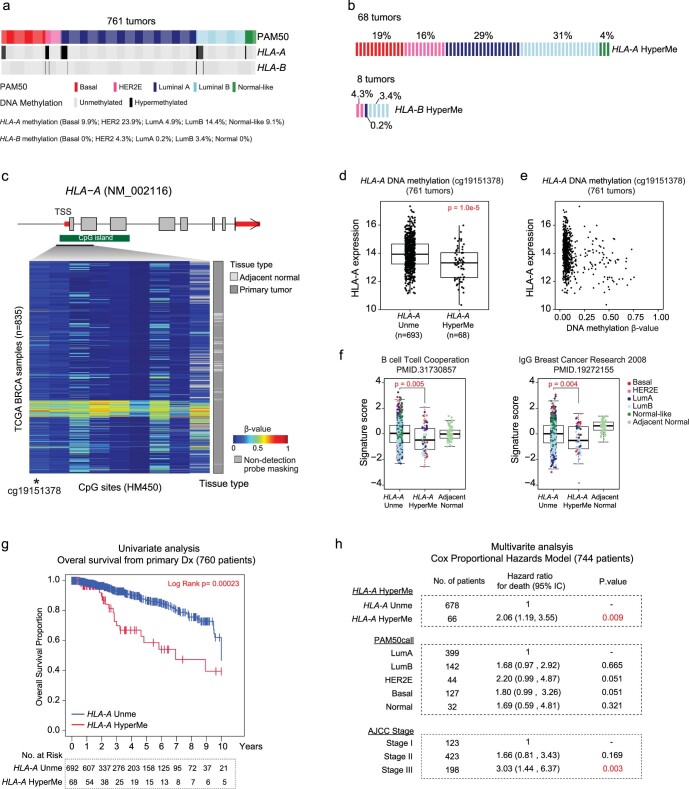
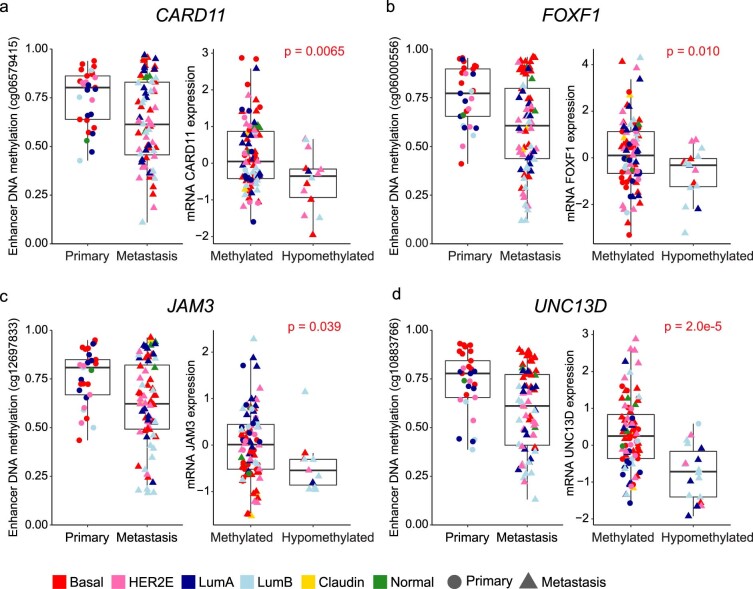
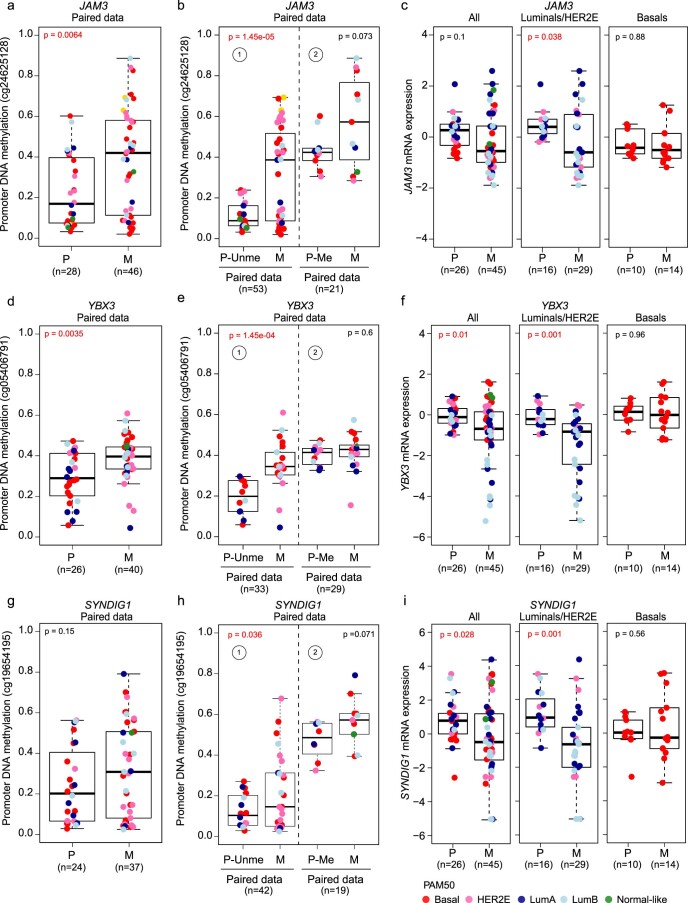
The AURORA US Metastasis Project was established with the goal to identify molecular features associated with metastasis. We assayed 55 females with metastatic breast cancer (51 primary cancers and 102 metastases) by RNA sequencing, tumor/germline DNA exome and low-pass whole-genome sequencing and global DNA methylation microarrays. Expression subtype changes were observed in ~30% of samples and were coincident with DNA clonality shifts, especially involving HER2. Downregulation of estrogen receptor (ER)-mediated cell-cell adhesion genes through DNA methylation mechanisms was observed in metastases. Microenvironment differences varied according to tumor subtype; the ER+/luminal subtype had lower fibroblast and endothelial content, while triple-negative breast cancer/basal metastases showed a decrease in B and T cells. In 17% of metastases, DNA hypermethylation and/or focal deletions were identified near HLA-A and were associated with reduced expression and lower immune cell infiltrates, especially in brain and liver metastases. These findings could have implications for treating individuals with metastatic breast cancer with immune- and HER2-targeting therapies.


Conflict of interest statement

The following authors disclose conflicts of interest. C.M.P. is listed as an inventor on patent applications on the Breast PAM50 assay and is an equity stock holder and consultant of BioClassifier LLC. J.S.P. is listed as an inventor on patent applications on the Breast PAM50 assay. H.S. has authorship and equity in AnchorDX, authorship with Illumina and an IP license with TruDiagnostics, Inc. B.H.P. has royalties: Horizon Discovery, Ltd.; Consultant: EQRx, Sermonix, Hologics, Jackson Laboratories, Guardant Health Inc; Unpaid consultant: Tempus; Consultant and ownership interest: Celcuity; Research Contracts: GE Healthcare, Lilly and Pfizer. I.K. has: Consulting Fees (e.g. advisory boards); Author; Bristol Meyers Squibb, Daiichi/Sankyo, Macrogenics, Context Therapeutics, Taiho Oncology, Genentech/Roche, Seattle Genetics. Contracted Research; Author; Genentech/Roche, Pfizer. Other; Author; Novartis, Merck (DSMB member). C.A. has: Research funding: Puma, Lilly, Merck, Seattle Genetics, Nektar, Tesaro, G1 Therapeutics, ZION, Novartis, Pfizer; Compensated consultant role: Genentech, Eisai, IPSEN, Seattle Genetics, AstraZeneca, Novartis, Immunomedics, Elucida, Athenex; Royalties: UpToDate, Jones and Bartlet. M.F.R. has: Consulting Fees (e.g. advisory boards); Author; Macrogenics, Daiichi, and Genentech. Contracted Research; Author; Pfizer. R.N. is an author with Aduro, AstraZeneca, Athenex, Celgene, Daiichi Sankyo, Inc., Genentech, MacroGenics, Merck, Novartis, Pfizer, Puma, Syndax. Contracted Research; Author; AstraZeneca, Celgene, Concept Therapeutics, Genentech/Roche, Immunomedics, Merck, Odonate Therapeutics, Pfizer, Seattle Genetics. Other; Author; DSMB:G1 Therapeutics; Steering Committee: OBI Pharm, Inc. N.U.L. has: Consulting Fees (e.g. advisory boards); Author; Seattle genetics, Puma and Daichii. Contracted Research; Author; Genentech, Seattle Genetics, Pfizer. C.I. has Consulting Fees (e.g. advisory boards); Author; Pfizer, AstraZeneca, Genentech, Novartis, Puma, Seattle Genetics, Sanofi, Eisai, Biotheranostics, and Gilead. Royalties; Author Wolters Kluwer (UpToDate), McGraw Hill (Goodman and Gilman’s); Research funding (to institution) Merck, Seattle Genetics, Pfizer, GlaxoSmithKline. M.C.L. has: Author; Eisai, Genentech, GRAIL, Janssen, Merck, Novartis, Seattle Genetics, Tesaro. J.M.B. has: Receipt of Intellectual Property Rights / Patent Holder; Author; Provisional patents regarding immunotherapy targets and biomarkers in cancer. Consulting Fees (e.g. advisory boards); Author; Novartis. Contracted Research; Author; Genentech/Roche, Bristol Myers Squibb, and Incyte Corporation. P.W.L. has: Consulting Fees (e.g. advisory boards); Progenity, Inc., Stock Options; Author; AnchorDx, Author: Progenity, Inc.Illumina, Inc., IP License; TruDiagnostic Inc. A.C.G.-C.: Research funding (to Institution) from Merck, Gilead Sciences, and AstraZeneca. All remaining authors have no relevant disclosures.

Figures

Fig. 1
Fig. 1. Study design and global genomic patterns of metastatic breast tumors.
a, Cohort description of the AURORA Metastatic Project. b, Diagram of the shared or individual tumor DNA methylation, WGS/whole-exome sequencing (WES) and RNAseq data successfully performed on each of the 55 participants; DNAme, DNA methylation; prim, primary; met, metastasis. c, Global profiling of the DNA methylation landscape using the top 5,000 most variable cancer-associated hypermethylated CpGs in 97 paired and 34 unpaired primary and metastatic tumors. Samples were intentionally ordered by participant to visually inspect the within-participant conservation of DNA methylation patterns. d, Supervised hierarchical cluster analysis of 102 paired and 21 unpaired primary and metastatic RNA-sequenced tumors using the so-called 1,900 intrinsic gene list (~1710 genes found in this dataset). e, OncoPrint panel of DNA somatic mutations displaying 37 of the most frequently mutated genes in 41 primary and 93 metastatic tumors. The percentage on the right indicates the mutation frequency of each gene across samples; LumA, Luminal A; LumB, Luminal B, Claudin, Claudin-low; normal, normal-like; Del, deletion; Ins, insertion. This figure was partly generated using Servier Medical Art, provided by Servier, licensed under a Creative Commons Attribution 3.0 unported license (smart.servier.com).
Fig. 2
Fig. 2. Subtype switching and supervised analysis of gene expression signatures between primary and metastatic tumors.
a, Overall molecular intrinsic subtype change between 39 participant-matched primary breast and 1 or more metastatic tumors. b, Participant-specific molecular subtype changes in 39 participant-matched primary breast and 1 or more metastatic tumors. c,d, Heat maps of some representative signatures that are significantly different between primary and metastatic tumors in luminal/HER2E (n = 16 primary versus 29 metastatic tumors; c) and basal-like only subtypes (n = 10 primary versus 14 metastatic tumors; d). Significance of the differences between primary tumors and metastases were calculated using LMMs (q < 0.01). Significant signatures are row ordered from high to low according to -coefficients (or regression coefficients) and divided according to upregulated (positive) or downregulated (negative) in metastasis. Individuals are column ordered according to PAM50 molecular subtype and divided according to primary tumor and metastasis. Signature scores were calculated in the level 4 RNAseq data (Methods). Normal-like tumors and post-treatment primaries were removed from the analysis in the AURORA cohort. For more information about the background/origin of the signatures listed in c and d, see Supplementary Table 3, sheet 2. LumA, Luminal A; LumB, Luminal B; LN, lymph node.
Fig. 3
Fig. 3. Individuals with multiple metastases were examined for immune features in the AURORA–RAP combined cohort.
a, Gene expression signature scores of GP2-immune-metagene are shown according to individual specimens from participants with at least two metastases analyzed by RNAseq data (n = 14 individuals). The star indicates liver specimens with the lowest expression of signature. b, Expression changes between paired primary tumors and liver (36 pairs), brain (15 pairs), lung (21 pairs) or ‘rest’ (110 pairs) metastases of the GP2-immune-metagene signature (individuals with more than one metastasis in the same organ were averaged). Comparisons between two paired groups were performed by a two-sided paired samples Wilcoxon test. Statistically significant values are highlighted in red. All box and whisker plots display the median value on each bar, showing the lower and upper quartile range of the data (Q1 to Q3). The whiskers represent the lines from the minimum value to Q1 and Q3 to the maximum value; LumA, Luminal A, ; LumB, Luminal B; Brt, breast; Adr, adrenal; Liv, liver; Dip, diaphragm; Per, peritoneum; Rct, rectum, Skn, skin; Stm, stomach; Thy, thyroid; SoftT, soft tissue; LN, lymph node; Ple, pleura; Lun, lung; Brn, brain; Bon, bone; Kid, kidney; Che, chest; Spl, spleen; Mes, mesentery; Pan, pancreas; AUR, AURORA.
Fig. 4
Fig. 4. HLA-A dysregulation and impact on immune-related features in metastatic tumors.
a, Hypermethylated CpG sites in HLA-A (8 CpG sites), HLA-B (14 CpG sites) and HLA-C (12 CpG sites) of 133 primary and metastatic tumors; TSS, transcription start site. b, Representative images of 37 metastatic samples showing HLA-A immunofluorescence staining for two different levels of HLA-A protein expression (top third and bottom third). HLA-A protein expression values were divided into tertiles on the basis of low (lower third), intermediate (middle third) or high intensity (upper third). c, Correlation analysis of HLA-A protein expression and HLA-A gene expression values (n = 37 metastases). The correlation was measured using the Spearman correlation coefficient. d, Box plots of HLA-A mRNA gene expression levels in metastases (left; n = 75 metastatic tumors) and HLA-A protein expression (right; n = 34 metastatic tumors) according to DNA methylation status when data were available. e, HLA-A, HLA-B, HLA-C and HLA-DRB5 focal deletions in the HLA region of 49 individuals. f, Heat map representation of the difference in HLA-A, HLA-B, HLA-C, B2M and TAPBP gene expression values and GP2-immune-metagene and hallmark interferon-γ (IFNγ) response gene signature scores, calculated between paired primary (n = 36) and metastatic (n = 60) tumors. Normal-like paired and unpaired tumors were removed from this analysis (paired normal and unpaired group from the ‘Pairs-PAM50-Prim’ column of Supplementary Table 2). Gene and signature scores are ordered according to HLA-A gene expression changes. For the 60 metastases, the association is shown with HLA-A, HLA-B, HLA-C, B2M and TAPBP gene methylation/DNA focal deletion status, PAM50 and site of metastasis; NK, natural killer. g, Left, MHC class I-associated neoantigen levels in MHC class I-altered tumors (HLA-A, HLA-B, HLA-C, B2M and TAPBP hypermethylation or focal deletion) versus non-altered tumors (Others) when data were available (basal-like tumors: n = 25, 5 primaries and 20 metastases; luminal/HER2E tumors: n = 39, 9 primaries and 30 metastases). Right, TMB in MHC class I-altered tumors versus in other tumors when data were available (basal-like tumors: n = 35, 11 primaries and 24 metastases; luminal/HER2E tumors: n = 52, 15 primaries and 37 metastases); NS, not significant. h, HLA-A, HLA-B, HLA-C and B2M gene expression values are shown in HLA-A-altered versus other tumors when data were available (n = 37, 13 primaries and 24 metastases). i, MHC class I metagene signature scores according to lines of therapies in metastatic samples (N = 77). j, MHC class I metagene signature score differences between primary and metastatic tumors according to molecular subtype in AURORA (n = 46) and RAP (n = 57) cohorts. Normal-like tumors were removed from the analysis. All box and whisker plots of the figure display the median value on each bar, showing the lower and upper quartile range of the data (Q1 to Q3) and data outliers. The whiskers represent the lines from the minimum value to Q1 and Q3 to the maximum value. All comparisons between more than two groups were performed by ANOVA with a post hoc Tukey test (one sided), and P values are shown in red (i and j). Comparison between only two groups was performed by unpaired Mann–Whitney test (two sided), and significant P values are highlighted in red (d, g and h). LumA, Luminal A; LumB, Luminal B; LN, lymph node; Unme, unmethylated; HyperMe, hypermethylated.
Fig. 5
Fig. 5. Metastatic tumor-associated DNA hypomethylation at distal enhancer elements.
a, Analysis of DNA binding proteins at the significantly hypomethylated CpG sites. Each dot represents 1 of the 11,348 ChiP–seq datasets analyzed. The y axis represents the odds ratio of enrichment, and the x axis represents the number of significant CpGs overlapping protein binding sites. The size of the dot denotes the statistical significance of the enrichment (Fisher’s exact test); HR, hormone receptor. b, GO analysis of putative target genes for the hypomethylated ESR1 or FOXA1 distal binding sites. Shown are the top 50 GO terms based on the P values from the Fisher’s exact test. Dot sizes are proportional to the number of genes. Red text highlights cell adhesion GO terms and genes of interest. c, Analysis of putative enhancer target genes involved in the regulation of cell adhesion in ER+ tumors. A comparison of distal element DNA methylation between primary tumors (n = 15 tumors) and metastases (n = 19 tumors) in ER+ tumors is shown. d, Gene expression between methylated (β value of ≥0.4) and unmethylated (β value of <0.4) ER+ tumors. The P values of c and d were calculated using Welch’s two-sample t-test (two sided). e,f, Analysis of distal element DNA hypomethylation (e) and putative target gene expression (f) in TCGA BC data (n = 835 tumors, 761 primary tumors and 74 adjacent normal tissue). Normal breast tissue samples are indicated in dark gray, and tumor samples are color coded by the PAM50 molecular subtype. The samples were identified as either methylated or unmethylated using a β value threshold of 0.4. The P values were calculated using Welch’s two-sample t-test (two sided). All box and whisker plots display the median value on each bar, showing the lower and upper quartile range of the data (Q1 to Q3) and data outliers. The whiskers represent the lines from the minimum value to Q1 and Q3 to the maximum value. LumA, Luminal A; LumB, Luminal B; Claudin, Claudin-low.
Fig. 6
Fig. 6. Multiomics participant characterization of individual AURORA cases.
ao, Timeline of participant clinical history (a, f and k), clonal structure (b, g and l), clonal evolution (c, h and m) and transcriptome (d, i and n) and methylome description (e, j and o) of participants AER8 (a, b, c, d and e), AFR3 (f, g, h, i and j) and AFE4 (k, l, m, n and o). Transcriptome data reflect gene expression values, and gene expression signatures were calculated using normalized RNAseq data; LumA, Luminal A; LumB, Luminal B; P, primary; M, metastasis; N, AQ21normal; LN, lymph node; R. Lung, right lung; L. Lung, left lung; R. Liver, right liver; L. Liver, left liver; M, metastasis; ES, embryonic stem. PGR, progesterone; ESR1, estrogen receptor; TAC, docetaxel (Taxotere), doxorubicin hydrochloride (Adriamycin), and cyclophosphamide; CBDCA, carboplatin; Gem, gemcitabine; RT, radiation therapy; Cape, capecitabine; THP, docetaxel, trastuzumab, and pertuzumab; WBRT, whole brain radiation therapy.
Extended Data Fig. 1
Extended Data Fig. 1. Survival outcomes according to clinical subtypes of AURORA cohort.
a. Kaplan-Meier, log-rank test and Cox proportional hazards regression model methods were used to study the overall survival from breast cancer diagnosis (‘First Primary Receptor at diagnosis’ column of Supplementary Table 2) in HER2 positive (HER2+, n = 10 patients), Hormone receptor positive and HER2 negative (HR + /HER2-, n = 17 patients) and TNBC (triple-negative breast cancers, n = 19 patients). b. Kaplan-Meier, the log-rank test and Cox proportional hazards regression model to study the overall survival from metastatic breast cancer diagnosis (‘Metastasis original receptors’ column of Supplementary Table 2) in HER2 + (n = 9 patients), HR + /HER2- (n = 24 patients) and TNBC (n = 21 patients). In absence of HR/HER2 status in the metastatic relapse we used the data from the most recent biopsy. c-d. Frequency bar chart displaying the frequency of clinical subtype (c) and molecular subtype (d) in AURORA (n = 123 tumors) compared with TCGA (n = 1027 tumors). In the AURORA cohort, we assigned ER and HER2 clinical status to those samples that had missing clinical values using the mRNA surrogates. e-g. Boxplot displaying the risk of recurrence based on subtype (ROR-S) (e) and proliferation (ROR-P) (f) and Proliferation score from PAM50 predictor (g) comparing TCGA primary tumors (n = 1027 tumors) vs AURORA primary tumors (n = 44 tumors) vs AURORA metastatic tumors (n = 70 tumors). Statistically significant values are highlighted in red. Comparison between more than 2 groups was performed by ANOVA with post hoc Tukey’s test, one-sided (panels e, f, and g). Normal-like samples were removed from this analysis. Box-and-whisker plots from panels e, f, and g, display the median value on each bar, showing the lower and upper quartile range of the data (Q1 to Q3) and data outliers. The whiskers represent the lines from the minimum value to Q1 and Q3 to the maximum value. EBC, early breast cancer; MBC, metastatic breast cancer; confidence interval (CI). Statistically significant values are highlighted in red.
Extended Data Fig. 2
Extended Data Fig. 2. Clinical subtype and molecular subtype distribution according to site of metastasis.
a. Distribution of the 55 diagnosed primary tumors (n = 39 primaries) by clinical receptor status (TNBC, ER+/HER2-, HER2+, and unknown, left side) linked to their anatomic sites of metastasis (n = 63 metastases). Clinical receptor status at the time of first primary diagnosis (‘First Primary Receptors’ column of Supplementary Table 2). b. Distribution of 39 diagnosed primary tumors by gene expression-based intrinsic molecular subtype when available (left) linked to their anatomic sites of metastasis (right). c. TNBC and non-TNBC subtype proportions of primary (left, n = 39 primaries) and paired metastatic (right, n = 64 metastases) tumors by TNBCtype. d. Comparison of subtype classifications between TNBC subtype and PAM50 of primary (left, 39 primaries) and paired metastatic (right, 63 metastases) tumors. LumA, Luminal A; LumB, Luminal B; CL, Claudin-low; NL, normal-like; BL1, basal-like 1; BL2, basal-like 2; IM, immunomodulatory; LAR, luminal androgen receptor; M, mesenchymal-like; MSL, mesenchymal stem-like.
Extended Data Fig. 3
Extended Data Fig. 3. Correlation analysis between paired data in each genomic approach.
a-d. Correlation heatmap representing the correlation matrix of (a) RNAseq data, n = 63 tumor pairs (gene expression values) (b) DNA methylation data, n = 65 tumor pairs (ꞵ-values), (c) DNA somatic variants, n = 20 tumor pairs (binary data: 1, mutated and 0, non-mutated) and (d) DNA copy number variants, n = 87 tumor pairs (gene-specific denoised log2 copy-ratios) of paired primary and metastatic tumors. The relationship between variables has been calculated using the Pearson correlation coefficient. e-h. Comparison of Pearson correlation means between primary and paired metastasis, random primary and metastatic tumors, primaries and metastasis belonging to different patients, primary samples belonging to different patients, and metastasis samples belonging to different patients of (e) RNAseq data, n = 63 tumor pairs (gene expression values) (f) DNA methylation data, n = 65 tumor pairs (ꞵ-values), (g) DNA somatic variants, n = 20 tumor pairs (binary data: 1, mutated, 0 non-mutated) and (h) DNA copy number variants, n = 87 tumor pairs (gene-specific denoised log2 copy-ratios). P values between groups were calculated using t-test, two-sided (panels, e, f, g, and h). In panels e, f, g, and h, all Box-and-whisker plots display the median value on each bar, showing the lower and upper quartile range of the data (Q1 to Q3) and data outliers. The whiskers represent the lines from the minimum value to Q1 and Q3 to the maximum value. P, Primary; M, metastasis.
Extended Data Fig. 4
Extended Data Fig. 4. Correlation between tumor cellularity metrics and immune signatures.
a. Supervised hierarchical clustering of the top 1,000 leukocyte-specifically methylated probes and the bottom 1,000 tumor tissue-specifically methylated probes, after ranking all probes based on the mean leukocytes - mean tumor tissues. For the 133 tumors, association is shown with tumor type, tumor purity, and estimated leukocyte fraction scores,. b. Pearson correlation between the difference (Metastasis – Primary gene expression values, n = 40 tumor pairs) of the Leukocyte fraction scores and GP2-Immune-Metagene signature scores (calculated from the Level 4 RNAseq data). Higher scores mean higher expression in metastasis compared to primary tumors. Correlation was measured using the Pearson correlation coefficient (r) and p values were used to assess the significance of the correlation. c. Spearman correlations (Rho) between GP2-Immune-Metagene signature scores and several pathology-determined scores (% Tumor nuclei, % of normal cells, % of Stromal cells, % Lymphocyte infiltration and tumor cellularity) or genomic scores (Estimate-Stromal scores, Estimate-Immune Score and Estimate Score using ESTIMATE method using 65 tumors (23 primary and 42 metastasis). Rho (spearman correlation coefficient, ρ), p values were used to assess the significance of the correlation. d. Pearson correlation (r) of GP2-Immune-Metagene signature score and % of Tumor nuclei from pathology report using 65 tumors (23 primary and 42 metastasis). P values were used to assess the significance of the correlation. Statistically significant values are highlighted in red. GP2-Immune-Metagene signature scores were calculated from the Level 4 RNAseq data (see Methods). LumA, Luminal A; LumB, Luminal B.
Extended Data Fig. 5
Extended Data Fig. 5. Supervised analysis of gene expression signatures according to site of metastasis in AURORA or combined AURORA-RAP-GEICAM cohorts.
a. Heatmap depicting the differentially expressed (DE) signatures between primary (n = 26) and metastasis (n = 69) in the AURORA cohort using all samples. b. Heatmap depicting the DE signatures between paired primary (n = 5) and brain metastasis (n = 5) in the AURORA cohort. c. Heatmap depicting the DE signatures between paired primary (n = 6) and liver metastasis (n = 6) in the AURORA cohort. d. Heatmap depicting the DE signatures between basal-like paired primary (n = 5) and brain metastasis (n = 8) in the AURORA-RAP-GEICAM cohort. d. Heatmap depicting the DE signatures between luminals (LumA, LumB, and HER2E) paired primary (n = 21) and liver metastasis (n = 24) in the AURORA-RAP-GEICAM cohort. Significance of the differences between primary and metastasis was calculated using linear mixed models (q < 0.05 in AURORA and q < 0.02 in AURORA-RAP-GEICAM). Significant signatures are row ordered from high to low according to β coefficients (or regression coefficients) and divided according to upregulated (positive) or downregulated (negative) in metastasis. Patients are column ordered according to PAM50 molecular subtype and divided according to primary and metastasis. Signatures scores were calculated in the Level 4 RNAseq data (see Methods). Normal-like tumors and post-treatment primaries were removed from the analysis. For more information about the background/origin of the signatures listed in this figure, see Supplementary Table 3, sheet 2. LumA, Luminal A; LumB, Luminal B; LN, lymph node.
Extended Data Fig. 6
Extended Data Fig. 6. HLA-A gene and protein expression levels in metastatic samples and impact on immune-related features in metastatic tumors.
a. Bar plot depicting the frequency of HLA-A Unmethylated, and HLA-A methylated samples divided by primary and metastatic tumors. Fisher’s exact test was used to compare the proportion of categories (the number of samples is shown in the figure). b. Boxplots of HLA-A, -B, and C mRNA gene expression levels and according to HLA-A protein expression (n = 37 metastasis). HLA-A protein expression values were divided into tertiles on the basis of low (lower third; n = 14), intermediate (middle third; n = 12), or high intensity (upper third, n = 11). Comparison between more than 2 groups was performed by ANOVA with post hoc Tukey’s test, one-sided. Statistically significant values are highlighted in red. Comparisons between 2 paired groups were performed by t-test. Comparison between more than 2 groups was performed by ANOVA with post hoc Tukey’s test, one-sided. All Box-and-whisker plots display the median value on each bar, showing the lower and upper quartile range of the data (Q1 to Q3) and data outliers. The whiskers represent the lines from the minimum value to Q1 and Q3 to the maximum value. Normal-like samples were removed from this analysis. Statistically significant values are highlighted in red. c. Linear relationship between number of neoantigens and HLA-A, -B and C gene expression Level 4 RNAseq data (see Methods) of basal-like only primary and metastatic tumors. The correlation was measured using the Pearson correlation coefficient. d. Violin plots showing changes in gene expression for HLA-A, -B, and -C between primary and metastatic samples (Difference: Metastasis – Primary gene expression values) in basals (right panel, n = 34 tumors) and luminals/HER2E metastatic tumors (right panel, n = 34 tumors). e. Patient-specific changes in gene expression for HLA-A, -B, and -C between primary and metastatic samples (Difference: Metastasis – Primary gene expression values) in basal-likes, (left panel, n = 24 tumors) and luminals/HER2E metastatic tumors (right panel, n = 34 tumors) of AURORA cohort. Normal-like paired and unpaired tumors were removed from this analysis (Paired Normal and unpaired group from the ‘Pairs-PAM50-Prim’ column of Supplementary Table 2). f. Correlation matrix and unsupervised hierarchical clustering of CIBERSORTx-based immune-cell scores in basal-like samples (n = 42, 17 primary and 25 Metastasis). Positive clusters (PC1 and PC2) and negative clusters (NC1 and NC2) reflect the highest or lowest correlated immune-related signature scores per CIBERSORTx. Correlation was measured using the Pearson correlation coefficient and p values <0.05 are shown as (*). ns, non-significant. Prim, primary; Met, metastasis; LumA, Luminal A; LumB, Luminal B.
Extended Data Fig. 7
Extended Data Fig. 7. Difference in HLA-A and immune-signature expression between primary and metastatic tumors.
a. Waterfall plot of AURORA cases showing the difference between primary (n = 36 tumors) and metastasis (n = 60 tumors) (Difference: Metastasis – Primary gene expression value) ordered from the highest (left) to the lowest (right) signature score for HLA-A mRNA expression (upper panel). The bottom panel shows the difference between primary and metastases for GP2-Immune-Metagene values. Yellow stars highlight HLA-A Hypermethylated cases and green stars highlight the samples with DNA HLA-A focal deletions. b. Waterfall plot of RAP cases showing the difference between primary (n = 12 tumors) and metastasis (n = 40 tumors) (Difference: Metastasis – Primary gene expression value) ordered from the highest (left) to the lowest (right) signature score for HLA-A mRNA expression (upper panel). The bottom panel shows the difference of primary versus metastases for GP2-Immune-Metagene values. Pairs with a Normal-like primary tumor were removed from the analysis. LumA, Luminal A; LumB, Luminal B.
Extended Data Fig. 8
Extended Data Fig. 8. HLA-A methylated primary tumors and prognostic value of HLA-A in TCGA data.
a. Oncoprint diagram depicting HLA-A and HLA-B methylated cases using 761 primary tumors of TCGA-BRCA dataset according to PAM50 molecular subtype. b. Proportion of each molecular subtype found in HLA-A (68) and HLA-B (8) methylated tumors. c. Hypermethylated CpG sites in HLA-A (9 CpG sites) using 761 TCGA primary breast tumors and 74 tumor-adjacent breast tissues (n = 835 samples). d. Boxplots of HLA-A mRNA gene expression levels according to DNA methylation status (n = 761 tumors). Comparisons between 2 paired groups were performed by t-test, two-sided. e. Scatter plot showing the correlation between HLA-A mRNA expression values and DNA methylation levels (ꞵ-values) (n = 761 tumors). f. Boxplots of gene expression signature B cell/T cell cooperation and IgG scores according to DNA methylation status in tumors and tumor-adjacent breast tissues in TCGA-BRCA (n = 761 tumors). Comparison between 2 groups was performed by ANOVA with post hoc Tukey’s test, one-sided. Statistically significant values are highlighted in red. Each mark represents the value of a single sample. g. Kaplan-Meier plots using the log-rank test of overall survival from primary tumors according to HLA-A methylation status (n = 760 tumors). h. Multivariable Cox proportional hazards analyses of TCGA BRCA patients for overall survival prediction using the covariates of HLA-A methylation status, PAM50 subtypes, and tumor stage (10 Stage IV patients were removed from the analysis) (n = 744). Hazard ratio (HR) = 1: no effect. HR < 1: reduction in hazard. HR > 1: increase in hazard. Statistically significant values are highlighted in red. All Box-and-whisker plots display the median value on each bar, showing the lower and upper quartile range of the data (Q1 to Q3) and data outliers. The whiskers represent the lines from the minimum value to Q1 and Q3 to the maximum value. Unme, unmethlylated; HyperMe, hypermethylated. LumA, Luminal A; LumB, Luminal B.
Extended Data Fig. 9
Extended Data Fig. 9. Metastatic tumor-associated DNA hypomethylation at distal enhancer elements.
a-d. Analysis of putative enhancer target genes involved in the regulation of cell adhesion. For each gene, a comparison of distal element DNA methylation between 29 primary and 72 metastatic tumors is shown on the left, and putative target gene expression between methylated (β value ≥ 0.4) vs. unmethylated (β value of < 0.4) tumors is shown on the right. The p values were calculated using Welch’s two-sample t-test, two-sided. LumA, Luminal A; LumB, Luminal B; Claudin, Claudin-low.
Extended Data Fig. 10
Extended Data Fig. 10. DNA methylation alterations associated with metastatic tumors.
a-i. Analysis of metastasis-associated promoter DNA hypermethylation of three genes (JAM3, YBX3 and SYNDIG1) encoding components of tight junctions or regulation of adhesion molecules. For each gene, a comparison of promoter CpG DNA methylation between primary and metastatic tumors is shown on the left (a, d, g), a second comparison of promoter CpG DNA methylation between ① unmethylated primaries (β-value of <0.3) and their paired metastasis and ② methylated primaries (β-value of > 0.3) with their paired metastasis (b, c, e) is shown in the middle, and a third comparison of gene expression between primary and metastatic tumors based on all samples (All), Luminal A-B and HER2E only (luminals/HER2E), and basal-like subtype only (basals) is shown on the right (c, f, i). LumA, Luminal A; LumB, Luminal B; P, primary; M, metastasis; P-Unme, Unmethylated primary; P-Me, Methylated primary.

References

    1. Siegel RL, Miller KD, Fuchs HE, Jemal A. Cancer statistics. CA Cancer J. Clin. 2021;71:7–33. doi: 10.3322/caac.21654. - DOI - PubMed
    1. Bertucci F, et al. Genomic characterization of metastatic breast cancers. Nature. 2019;569:560–564. doi: 10.1038/s41586-019-1056-z. - DOI - PubMed
    1. Aftimos P, et al. Genomic and transcriptomic analyses of breast cancer primaries and matched metastases in AURORA, the Breast International Group (BIG) molecular screening initiative. Cancer Discov. 2021;11:2796–2811. doi: 10.1158/2159-8290.CD-20-1647. - DOI - PMC - PubMed
    1. Razavi P, et al. The genomic landscape of endocrine-resistant advanced breast cancers. Cancer Cell. 2018;34:427–438. doi: 10.1016/j.ccell.2018.08.008. - DOI - PMC - PubMed
    1. Nguyen B, et al. Genomic characterization of metastatic patterns from prospective clinical sequencing of 25,000 patients. Cell. 2022;185:563–575. doi: 10.1016/j.cell.2022.01.003. - DOI - PMC - PubMed

Publication types