. 2023 Jan;20(1):55-64.
doi: 10.1038/s41592-022-01703-z. Epub 2022 Dec 30.

Multifaceted atlases of the human brain in its infancy

Affiliations

Multifaceted atlases of the human brain in its infancy

Sahar Ahmad et al. Nat Methods. 2023 Jan.

Abstract

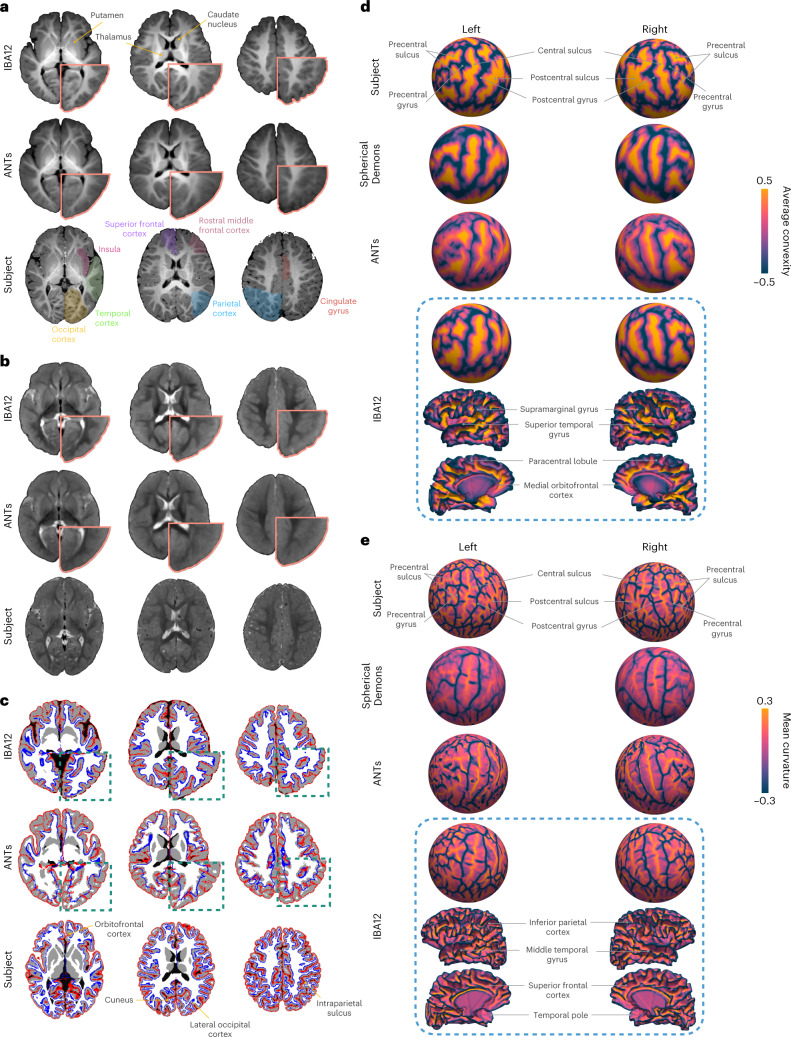
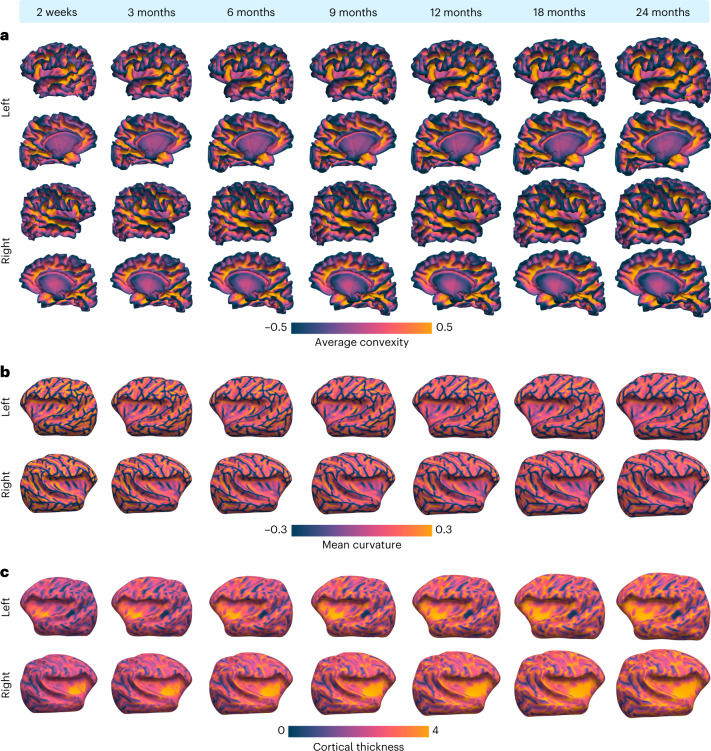
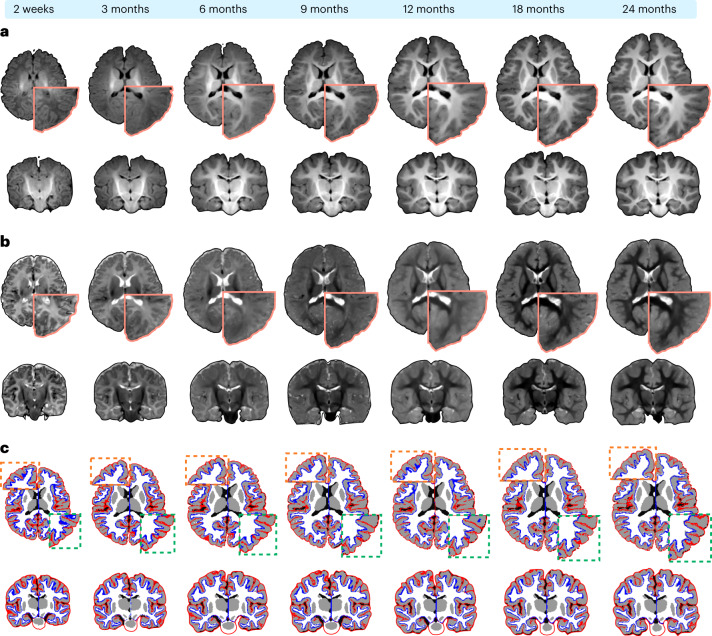
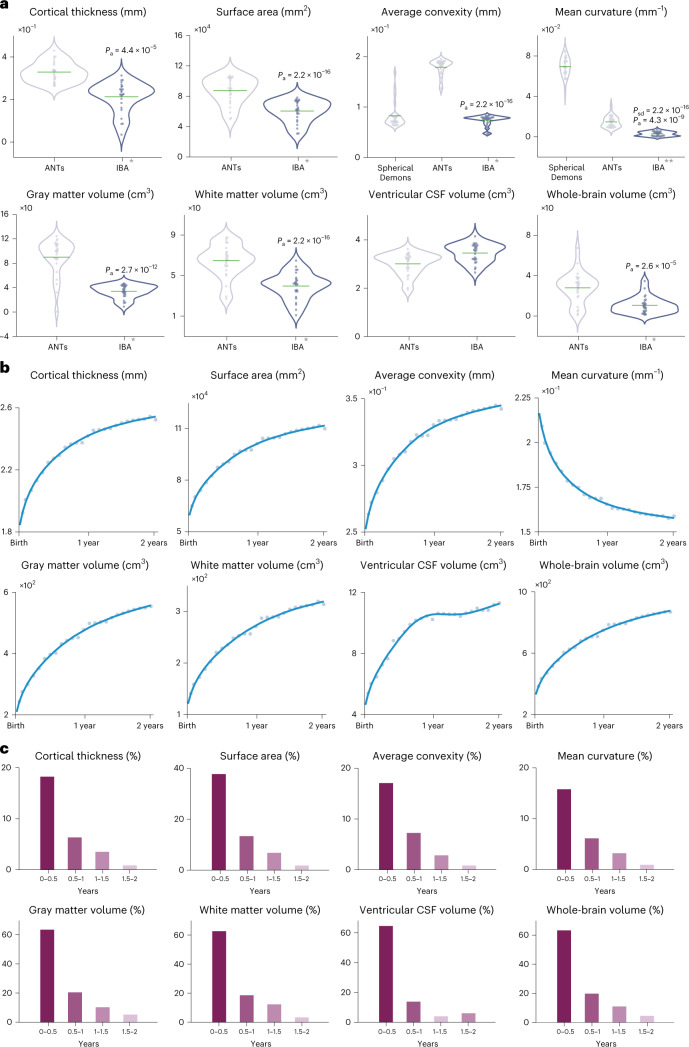
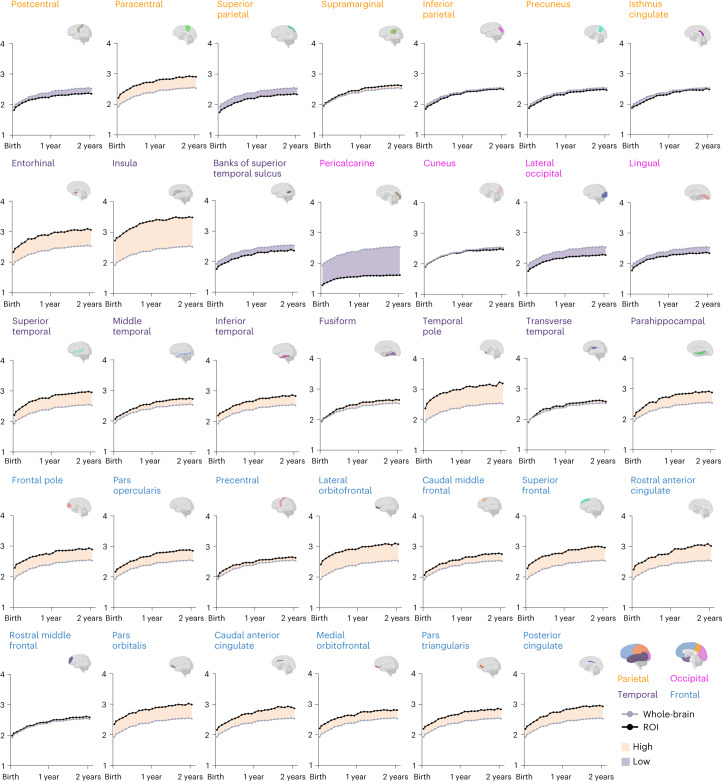
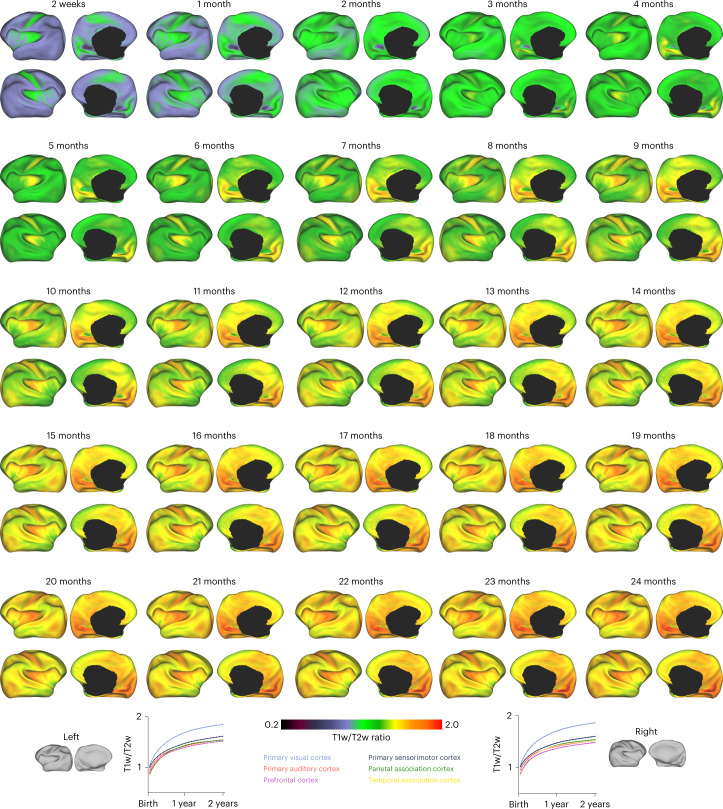
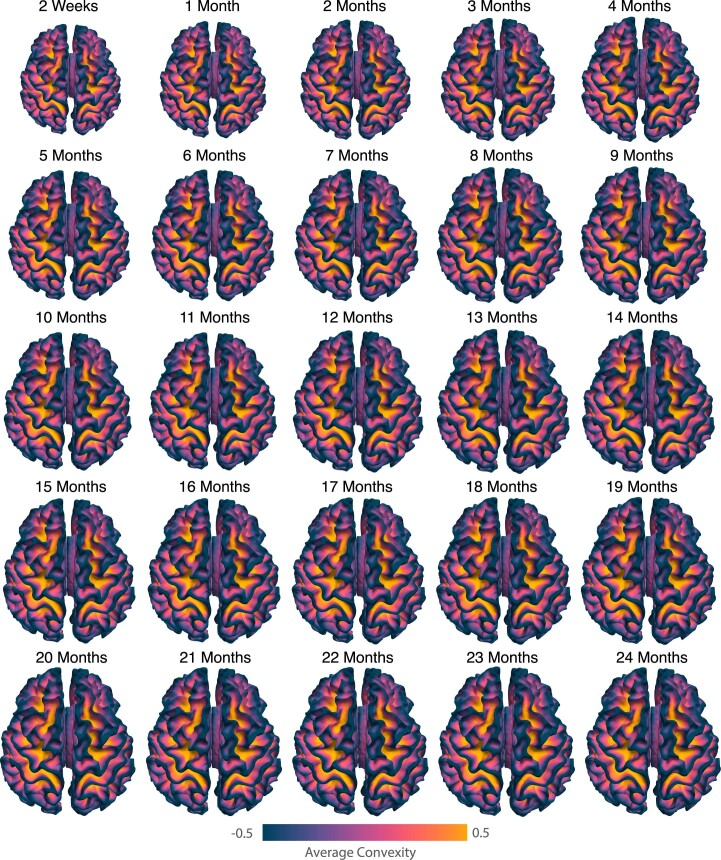
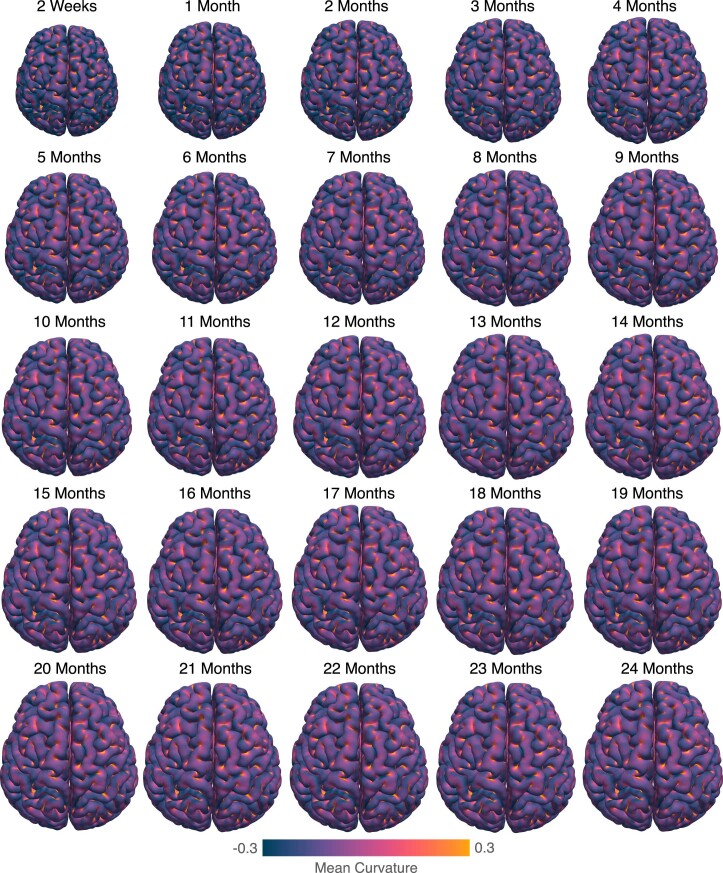
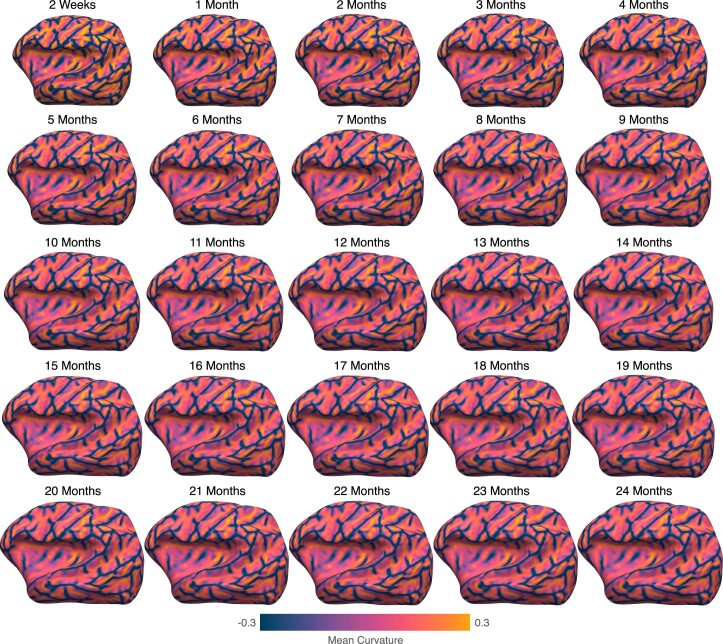
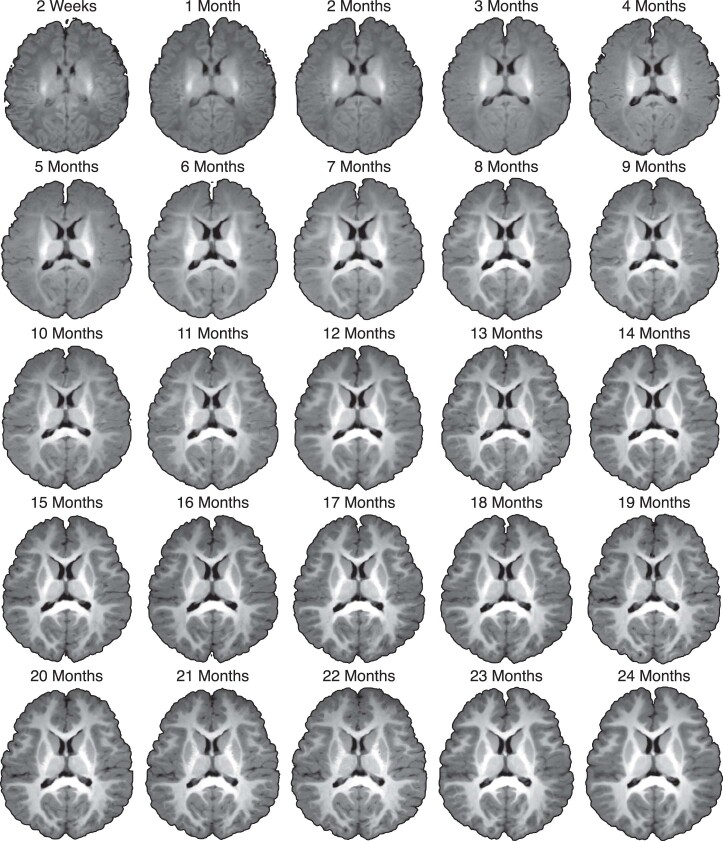
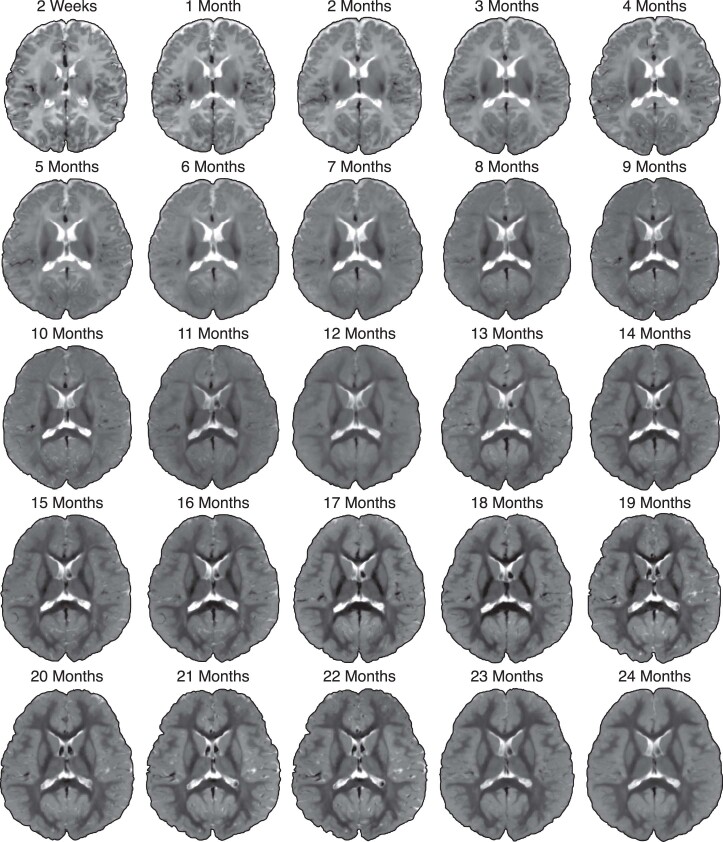
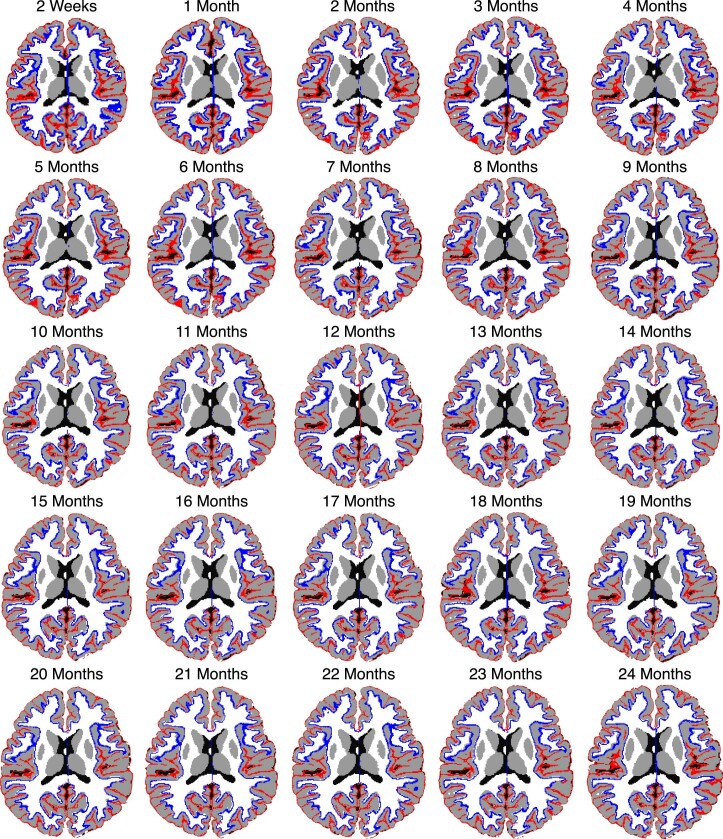
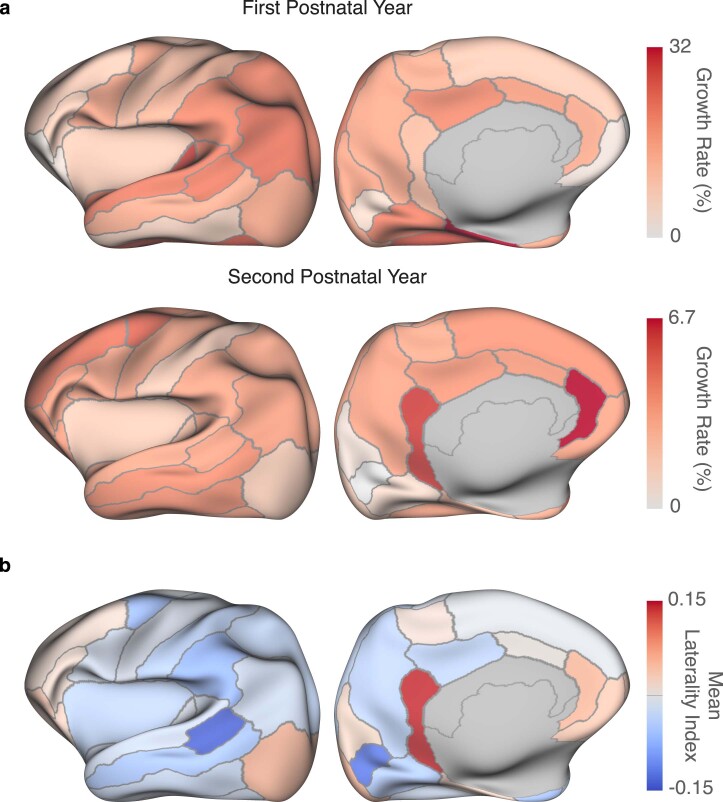
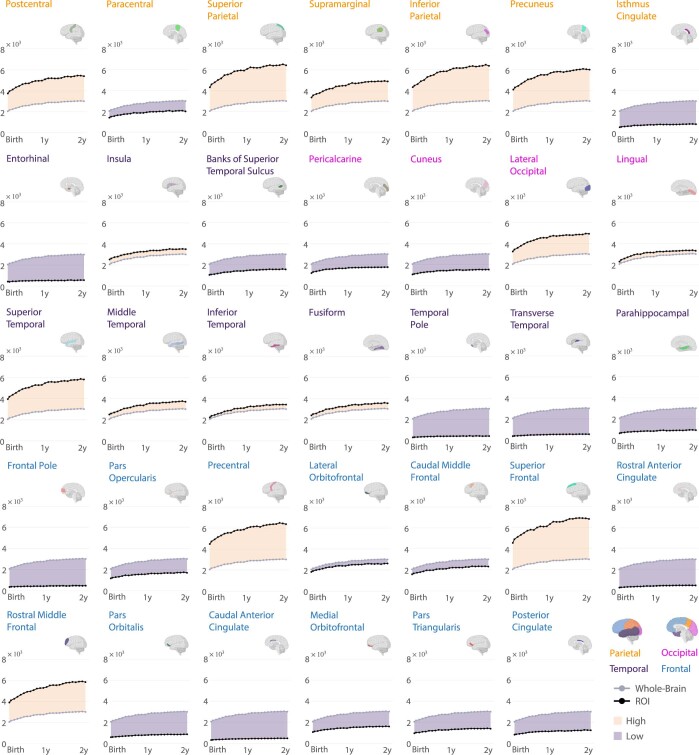
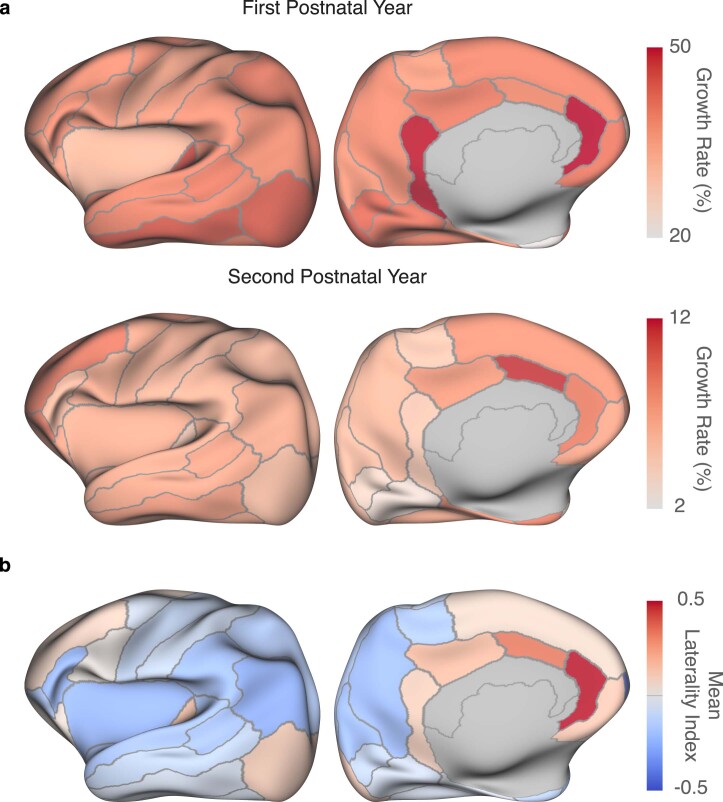
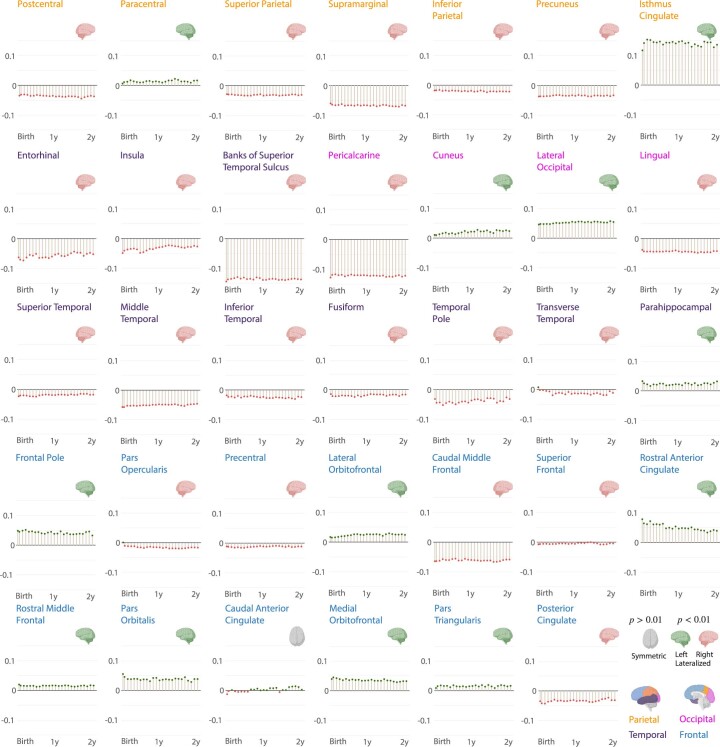
Brain atlases are spatial references for integrating, processing, and analyzing brain features gathered from different individuals, sources, and scales. Here we introduce a collection of joint surface-volume atlases that chart postnatal development of the human brain in a spatiotemporally dense manner from two weeks to two years of age. Our month-specific atlases chart normative patterns and capture key traits of early brain development and are therefore conducive to identifying aberrations from normal developmental trajectories. These atlases will enhance our understanding of early structural and functional development by facilitating the mapping of diverse features of the infant brain to a common reference frame for precise multifaceted quantification of cortical and subcortical changes.


Conflict of interest statement

The authors declare no competing financial interests.

Figures

Fig. 1
Fig. 1. The reference infant brain atlas at 12 months.
a,b, Transverse sections of T1w and T2w atlases and the T1w and T2w images of an individual subject. c, White and pial cortical surface atlases overlaid onto the corresponding tissue segmentation atlases. The cortical surfaces of the individual subject are overlaid onto its tissue segmentation map. d, Subject and atlas average convexity maps projected onto a sphere. Lateral and medial views of the IBA12-S white surface colored by average convexity are shown for reference. e, Subject and atlas mean curvature maps projected onto a sphere. Lateral and medial views of the IBA12-S white surface colored by mean curvature are shown for reference.
Fig. 2
Fig. 2. Longitudinal white surface atlases of the infant brain.
a, Lateral and medial views of white surface atlases from 2 weeks to 24 months, colored by average convexity (mm). b, Inflated white surface atlases colored by mean curvature (mm−1). c, Inflated white surface atlases colored by cortical thickness (mm).
Fig. 3
Fig. 3. Volumetric atlases of the infant brain.
a,b, Transverse and coronal sections of the T1w and T2w atlases from 2 weeks to 24 months. c, White (blue) and pial (red) surface atlases overlaid onto the corresponding tissue segmentation atlases.
Fig. 4
Fig. 4. Development of surface and volume.
a, Violin plots for absolute error of the developmental trajectories of surface and volumetric features, computed between the atlases and the individual subjects. The mean absolute error is marked by a green crossbar. A single star indicates that the mean error for the IBA is significantly different from ANTs (two-tailed paired t-test, Pa). A double star indicates that the mean error for the IBA is significantly different from both Spherical Demons (two-tailed paired t-test, Psd) and ANTs (two-tailed paired t-test, Pa). b, Developmental trajectories (adjusted R2 = 0.99) of white surface features and tissue volumes of the IBA. c, Surface and volumetric changes every six months. Source data
Fig. 5
Fig. 5. Regional developmental trajectories of cortical thickness.
Growth curves of cortical thickness for the IBA cortical regions. Shaded regions indicate whether cortical thickness is higher or lower than the whole-brain average. Source data
Fig. 6
Fig. 6. T1w/T2w ratio across infancy.
Cortical T1w/T2w ratio, mapped onto the inflated white surfaces of the IBA. Source data
Extended Data Fig. 1
Extended Data Fig. 1. Cortical atlases of the white surface.
The age-specific cortical atlases of the white surface for both hemispheres, colored by average convexity (millimeter).
Extended Data Fig. 2
Extended Data Fig. 2. Cortical atlases of the pial surface.
Dorsal views of the age-specific cortical atlases of the pial surface for both hemispheres spanning 2 weeks to 24 months, colored by mean curvature (millimeter−1).
Extended Data Fig. 3
Extended Data Fig. 3. Mean curvature maps of the longitudinal infant brain atlases.
The inflated cortical atlases of the white surface (left hemisphere, lateral view) superimposed with mean curvature (millimeter−1) spanning 2 weeks to 24 months.
Extended Data Fig. 4
Extended Data Fig. 4. T1w atlases of the infant brain.
Transverse sections of the T1w atlases depicting dynamic changes in tissues contrast, size, and shape of anatomical structures at each month between 2 weeks and 24 months.
Extended Data Fig. 5
Extended Data Fig. 5. T2w atlases of the infant brain.
Transverse sections of the T2w atlases depicting dynamic changes in tissues contrast, size, and shape of anatomical structures at each month between 2 weeks and 24 months.
Extended Data Fig. 6
Extended Data Fig. 6. Spatial consistency between age-specific cortical surface and volumetric atlases.
Left and right cortical atlases of the white (blue) and pial (red) surfaces are superimposed onto the tissue segmentation atlases.
Extended Data Fig. 7
Extended Data Fig. 7. Analysis of cortical thickness.
a, Regional growth rates in terms of cortical thickness for the first (top row) and second (bottom row) postnatal years. b, ROI-specific mean laterality index for cortical thickness.
Extended Data Fig. 8
Extended Data Fig. 8. Regional developmental trajectories of surface area.
Growth curves of surface area for the IBA cortical regions. Shaded regions indicate whether surface area is higher or lower than the whole-brain average. Source data
Extended Data Fig. 9
Extended Data Fig. 9. Analysis of surface area.
a, Regional growth rates in terms of surface area for the first (top row) and second (bottom row) postnatal years. b, ROI-specific mean laterality index for surface area.
Extended Data Fig. 10
Extended Data Fig. 10. Hemispheric asymmetry of cortical thickness.
Region-specific laterality index for cortical thickness of the IBA. Positive laterality is associated with left lateralization (two-tailed t-test: p < 0.01) and negative laterality is associated with right lateralization (two-tailed t-test: p < 0.01). Source data

Comment in

References

    1. Stiles J, Jernigan TL. The basics of brain development. Neuropsychol. Rev. 2010;20:327–348. doi: 10.1007/s11065-010-9148-4. - DOI - PMC - PubMed
    1. Silbereis JC, Pochareddy S, Zhu Y, Li M, Sestan N. The cellular and molecular landscapes of the developing human central nervous system. Neuron. 2016;89:248–268. doi: 10.1016/j.neuron.2015.12.008. - DOI - PMC - PubMed
    1. Gilmore JH, Knickmeyer RC, Gao W. Imaging structural and functional brain development in early childhood. Nat. Rev. Neurosci. 2018;19:123–137. doi: 10.1038/nrn.2018.1. - DOI - PMC - PubMed
    1. Knickmeyer RC, et al. A structural MRI study of human brain development from birth to 2 years. J. Neurosci. 2008;28:12176–12182. doi: 10.1523/JNEUROSCI.3479-08.2008. - DOI - PMC - PubMed
    1. Tanner JM, Whitehouse RH, Takaishi M. Standards from birth to maturity for height, weight, height velocity, and weight velocity: British children, 1965. i. Arch. Dis. Child. 1966;41:454–471. doi: 10.1136/adc.41.219.454. - DOI - PMC - PubMed

Publication types