. 2023 Feb;20(2):295-303.
doi: 10.1038/s41592-022-01711-z. Epub 2022 Dec 30.

Local shape descriptors for neuron segmentation

Affiliations

Local shape descriptors for neuron segmentation

Arlo Sheridan et al. Nat Methods. 2023 Feb.

Abstract

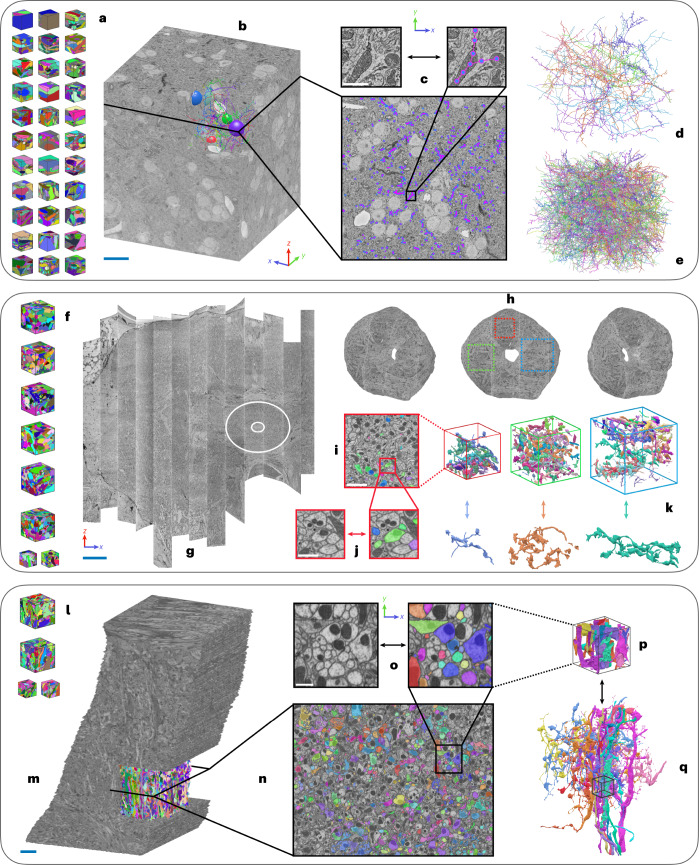
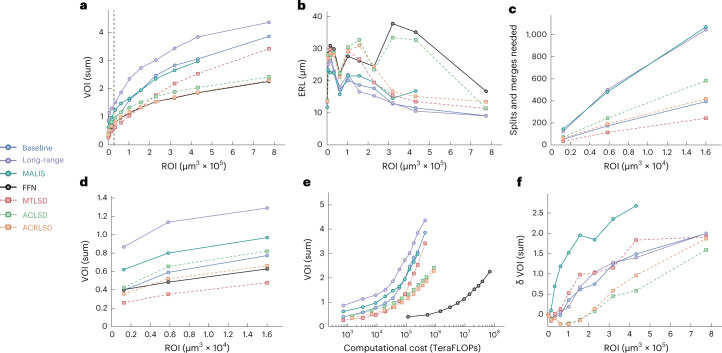
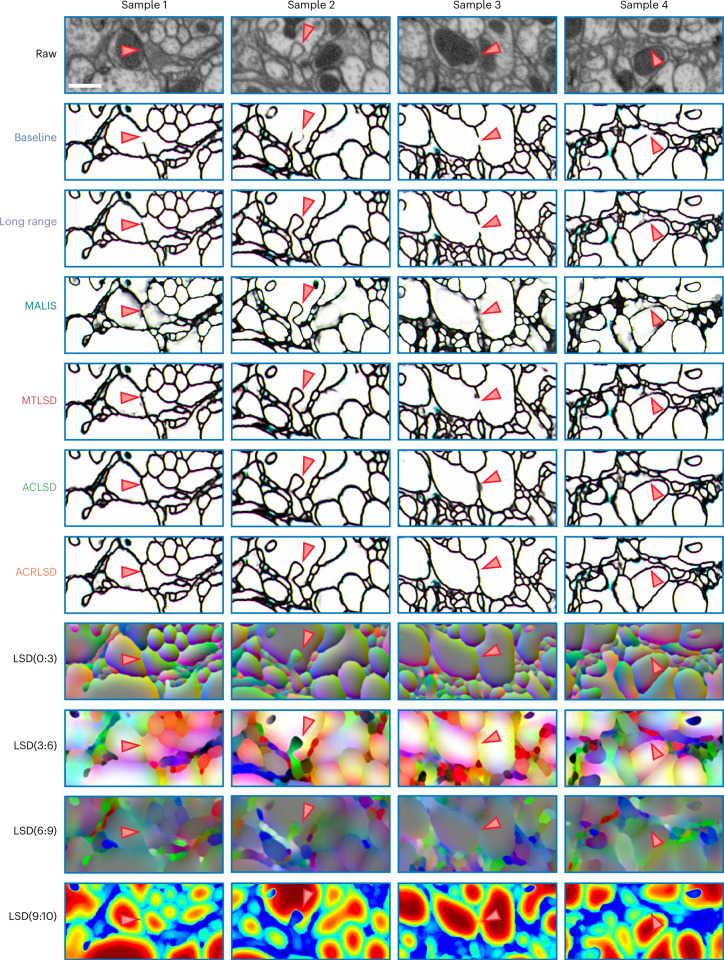
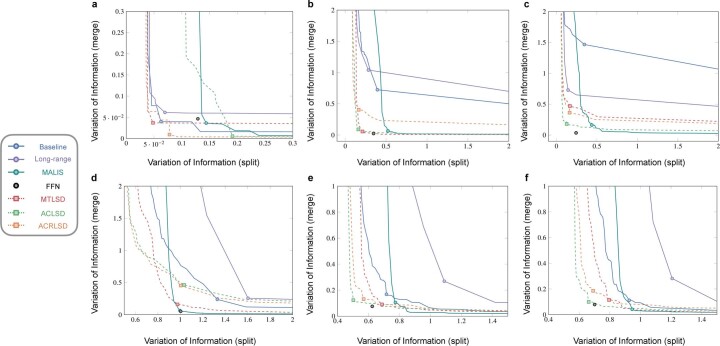
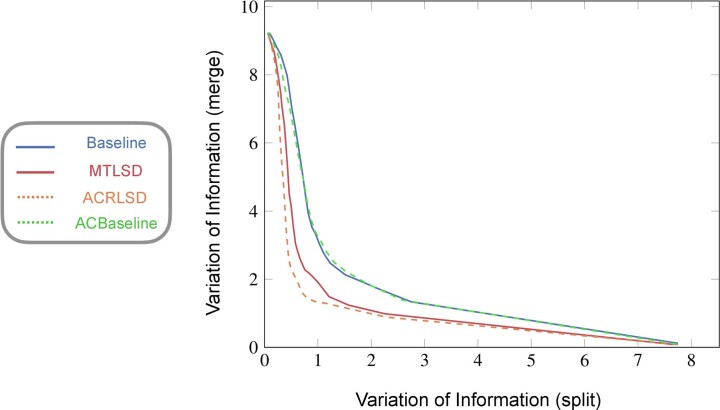
We present an auxiliary learning task for the problem of neuron segmentation in electron microscopy volumes. The auxiliary task consists of the prediction of local shape descriptors (LSDs), which we combine with conventional voxel-wise direct neighbor affinities for neuron boundary detection. The shape descriptors capture local statistics about the neuron to be segmented, such as diameter, elongation, and direction. On a study comparing several existing methods across various specimen, imaging techniques, and resolutions, auxiliary learning of LSDs consistently increases segmentation accuracy of affinity-based methods over a range of metrics. Furthermore, the addition of LSDs promotes affinity-based segmentation methods to be on par with the current state of the art for neuron segmentation (flood-filling networks), while being two orders of magnitudes more efficient-a critical requirement for the processing of future petabyte-sized datasets.


Conflict of interest statement

The authors declare no competing interests.

Figures

Fig. 1
Fig. 1. LSD and network architecture overview.
a, EM data imaged with FIB-SEM at 8 nm isotropic resolution (FIB-25 dataset). Arrows point to example individual neuron plasma membranes. Dark blobs are mitochondria. Scale bar, 300 nm. b, Label colors correspond to unique neurons. c, LSD mean offset schematic. A Gaussian (G) with fixed sigma (σ) is centered at voxel (v). The Gaussian is then intersected with the underlying label (colored region) and the center of mass of the intersection (cm) is computed. The mean offset (mo) between the given voxel and center of mass is calulated (among several other statistics), resulting in the first three components of the LSD for voxel (v). d, Predicted mean offset component of LSDs (LSD[0:3]) for all voxels. A smooth gradient is maintained within objects while sharp contrasts are observed across boundaries. Three-dimensional vectors are RGB color encoded. e, Network architectures used. The ten-dimensional LSD embedding is used as an auxiliary learning task for improving affinities. In a multitask approach (MTLSD), LSDs and affinities are directly learnt. In an auto-context approach, the predicted LSDs are used as input to a second network to generate affinities both without raw data (ACLSD) and with raw data (ACRLSD).
Fig. 2
Fig. 2. Visualization of LSD components.
a, Surface mesh of a segmented neuron from FIB-SEM data (FIB-25 dataset). Scale bar, 1 μm. b, RGB mapping of LSD components 3, 4 and 5. Neural processes are colored with respect to the directions they travel. Intermediate directions are mapped accordingly (see |Cartesian coordinate inset). c, LSD predictions in corresponding two-dimensional slices to the three boxes shown in a,b; neuron highlighted in white. Columns signify neuron orientation (blue, lateral movement; green, vertical movement; red, through-plane movement). Rows correspond to components of the LSDs. First row, mean offset; second and third rows, covariance of coordinates (LSD[3:6] for the diagonal entries, LSD[6:9] for the off-diagonals), second row shows mapping seen in b; last row, size (number of voxels inside intersected Gaussian). Scale bar, 250 nm.
Fig. 3
Fig. 3. Overview of datasets.
a, ZEBRAFINCH dataset. Thirty-three gound truth volumes were used for training. b, Full raw dataset. Scale bar, 15 μm. c, Single section shows ground-truth skeletons. Zoom-in scale bar, 500 nm. d, Validation skeletons (n = 12). e, Testing skeletons (n = 50). f, HEMI-BRAIN dataset. Eight ground-truth volumes were used for training. g, Full HEMI-BRAIN volume. Scale bar, 30 μm. Experiments were restricted to ELLIPSOID BODY (circled region). h, Volumes used for testing. i, Example sparse ground-truth testing data. Scale bar, 2.5 μm. j, Zoom-in scale bar, 800 nm. k, Example 3D renderings of selected neurons. l, FIB-25 dataset. Four ground-truth volumes were used for training. m, Full volume with cutout showing testing region. Scale bar, 5 μm. n, Cross section with sparsely labeled testing ground-truth. o, Zoom-in scale bar, 750 nm. p, Sub-volume corresponding to zoomed-in plane. q, Subset of full ROI testing neurons. Small volume shown for context.
Fig. 4
Fig. 4. Quantitative results on ZEBRAFINCH dataset.
Points in plots correspond to optimal thresholds from validation set. Each point represents an ROI. For VOI and MCM, lower scores are better; for ERL, higher scores are better. a, VOI sum versus ROI size (μm3). b, ERL (nanometers) versus ROI size. c,d, MCM sum and VOI sum versus ROI size (first three ROIs), respectively. Dashed line in a corresponds to ROIS shown in c,d. e, TERAFLOPS versus VOI sum across ROIs (as in a,b). f, Mask δ VOI sum versus ROI. Source data
Fig. 5
Fig. 5. Qualitative results on FIB-25 dataset.
Top row shows raw data. Arrows correspond to ambiguous plasma membranes, which might lead to merge errors. Scale bar, 500 nm.
Fig. 6
Fig. 6. Overview of block-wise processing scheme.
a, Example 32-μm ROI showing total block grid. b, Required blocks to process example neuron. Scale bar, ~6 μm. c, Corresponding orthographic view highlights supervoxels generated during watershed. Block size, 3.6 μm. Inset shows respective raw data inside single block. Scale bar, ~1 μm. d, Supervoxels are then agglomerated to obtain a resulting segment. Note, while this example shows processing of a single neuron, in reality all neurons are processed simultaneously.
Extended Data Fig. 1
Extended Data Fig. 1. Overview of the proposed MCM.
Overview of the proposed MCM. A. Simple case. Two ground-truth skeletons are contained inside an erroneously merged segment. Dashed lines represent supervoxel boundaries and the closest skeleton nodes need to be split to resolve the merge (1). A min-cut is performed (2), resulting in a new segment (3). B. Complex case. Two skeletons are contained in a falsely merged segment as before (1), but the supervoxels are more fragmented. A min-cut is performed (2), resulting in a new segment (3). However, two nodes contained within the original segment need to be split. A second min-cut is performed (4), which produces another segment (5). This results in an additional split error caused by the original cut.
Extended Data Fig. 2
Extended Data Fig. 2. Quantitative results on HEMI and FIB-25 datasets.
Quantitative results on Hemi and FIB-25 datasets. Plot curves show results over range of thresholds. Points correspond to optimal thresholds on testing set, no validation set was available. Lower scores are better. Top row. Hemi dataset. Plot curves show results over range of thresholds for each ROI (A = 12 μm ROI, B = 17 μm ROI, C = 22 μm ROI). Bottom row. FIB-25 dataset. D. Full testing ROI. E,F. Two sub ROIs contained within full ROI. Source data
Extended Data Fig. 3
Extended Data Fig. 3. Effects of auto-context architecture.
Effects of auto-context architecture. ZEBRAFINCH, benchmark ROI, VoI split versus VoI merge, auto-context comparison. Source data

Comment in

References

    1. Schneider-Mizell CM, et al. Quantitative neuroanatomy for connectomics in Drosophila. eLife. 2016;5:e12059. doi: 10.7554/eLife.12059. - DOI - PMC - PubMed
    1. Motta A, et al. Dense connectomic reconstruction in layer 4 of the somatosensory cortex. Science. 2019;366:eaay3134. doi: 10.1126/science.aay3134. - DOI - PubMed
    1. Bates AS, et al. Complete connectomic reconstruction of olfactory projection neurons in the fly brain. Current Biology. 2020;30:3183–3199. doi: 10.1016/j.cub.2020.06.042. - DOI - PMC - PubMed
    1. Hulse BK, et al. A connectome of the Drosophila central complex reveals network motifs suitable for flexible navigation and context-dependent action selection. eLife. 2021;10:e66039. doi: 10.7554/eLife.66039. - DOI - PMC - PubMed
    1. Schlegel P, et al. Synaptic transmission parallels neuromodulation in a central food-intake circuit. eLife. 2016;5:e16799. doi: 10.7554/eLife.16799. - DOI - PMC - PubMed

Publication types

MeSH terms