. 2022 Dec 30;12(1):22614.
doi: 10.1038/s41598-022-26954-w.

Expression profiles of small non-coding RNAs in breast cancer tumors characterize clinicopathological features and show prognostic and predictive potential

Affiliations

Expression profiles of small non-coding RNAs in breast cancer tumors characterize clinicopathological features and show prognostic and predictive potential

Emmi Kärkkäinen et al. Sci Rep. .

Abstract

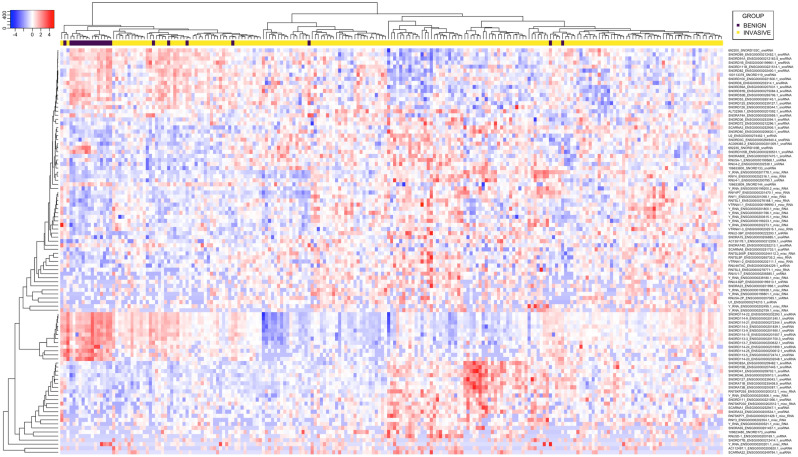
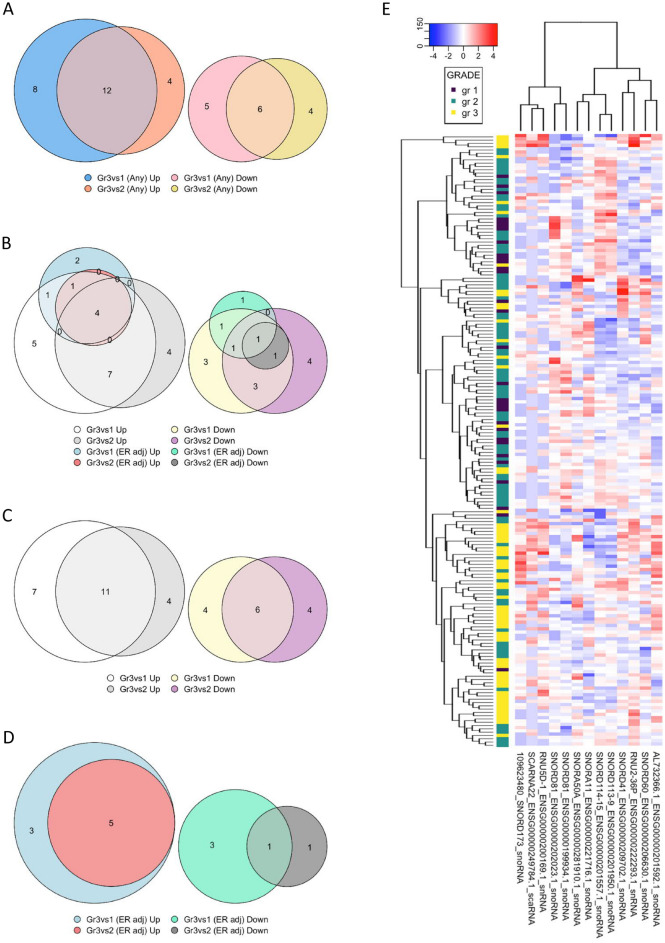
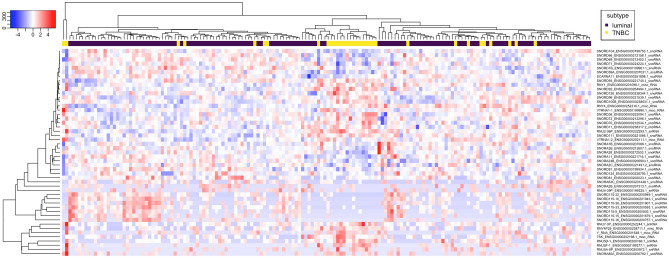
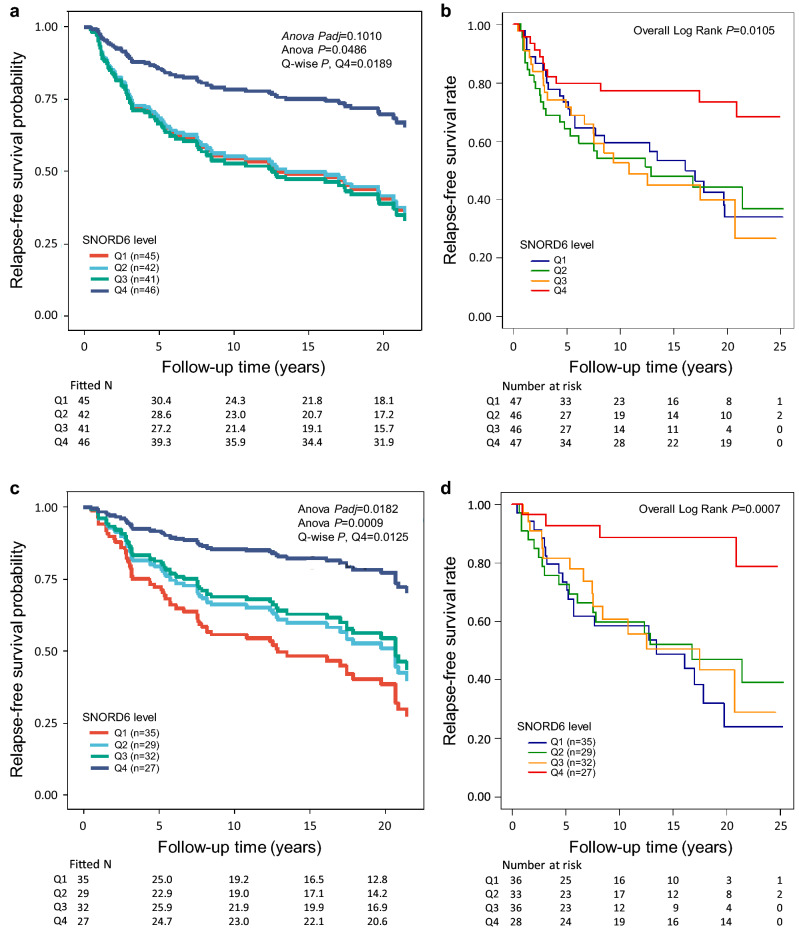
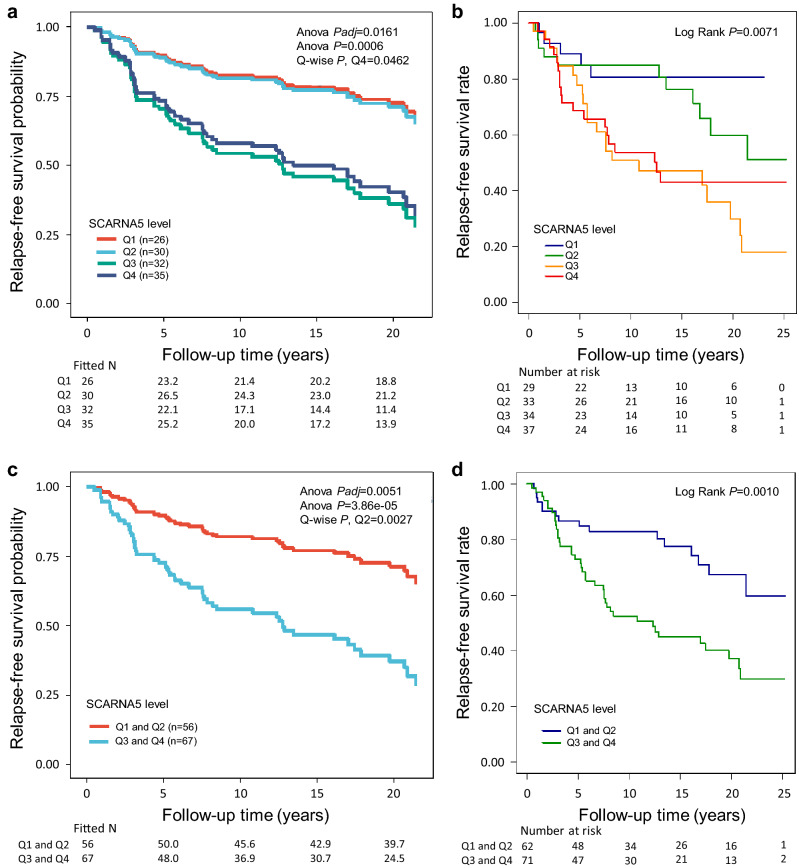
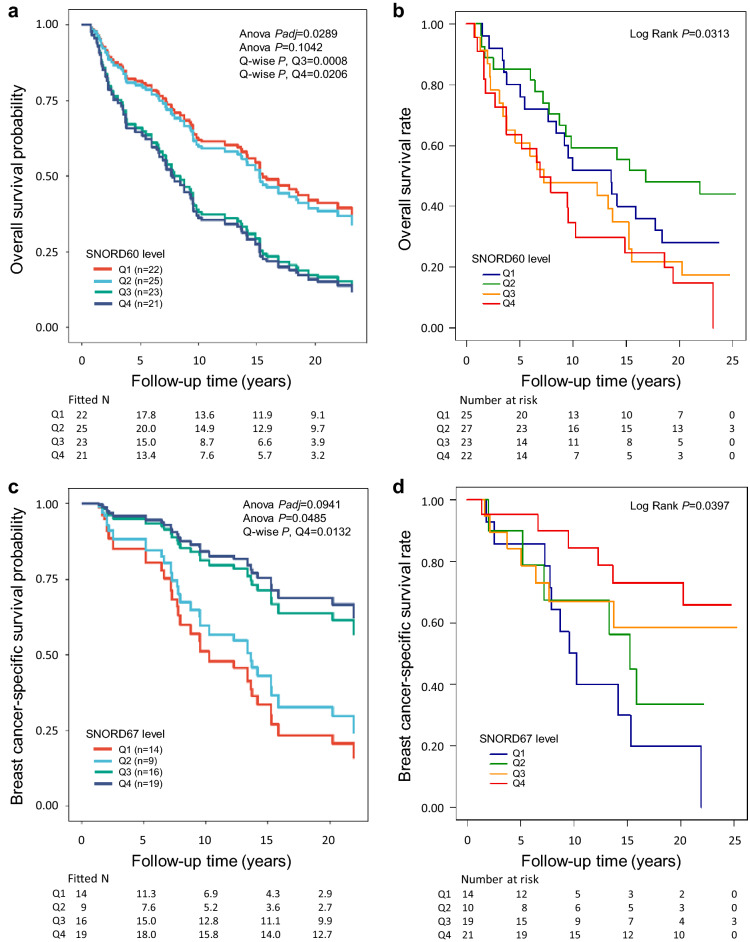
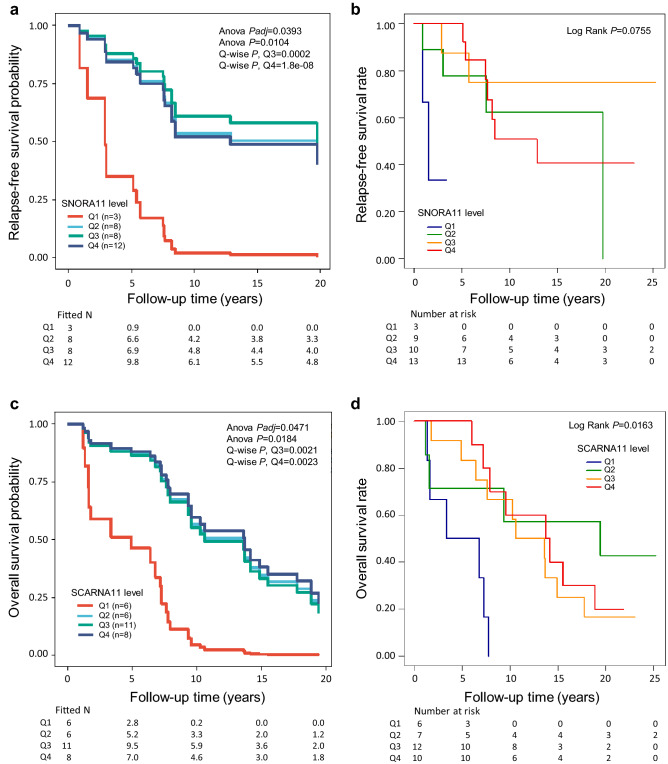
Precision medicine approaches are required for more effective therapies for cancer. As small non-coding RNAs (sncRNAs) have recently been suggested as intriguing candidates for cancer biomarkers and have shown potential also as novel therapeutic targets, we aimed at profiling the non-miRNA sncRNAs in a large sample set to evaluate their role in invasive breast cancer (BC). We used small RNA sequencing and 195 fresh-frozen invasive BC and 22 benign breast tissue samples to identify significant associations of small nucleolar RNAs, small nuclear RNAs, and miscellaneous RNAs with the clinicopathological features and patient outcome of BC. Ninety-six and five sncRNAs significantly distinguished (Padj < 0.01) invasive local BC from benign breast tissue and metastasized BC from invasive local BC, respectively. Furthermore, 69 sncRNAs significantly associated (Padj < 0.01) with the tumor grade, hormone receptor status, subtype, and/or tumor histology. Additionally, 42 sncRNAs were observed as candidates for prognostic markers and 29 for predictive markers for radiotherapy and/or tamoxifen response (P < 0.05). We discovered the clinical relevance of sncRNAs from each studied RNA type. By introducing new sncRNA biomarker candidates for invasive BC and validating the potential of previously described ones, we have guided the way for further research that is warranted for providing novel insights into BC biology.


Conflict of interest statement

The authors declare no competing interests.

Figures

Figure 1
Figure 1
Ninety-six sncRNAs were found to significantly (Padj < 0.01) distinguish invasive local BC from benign breast tissue. The hierarchical clustering of 186 invasive local BC and 22 benign breast tissue samples (columns) and differentially expressed sncRNAs (rows) using Pearson metrics. Log2 fold change is marked by the color scale (from blue to red).
Figure 2
Figure 2
Thirty-nine sncRNAs in total associated (Padj < 0.01) with the tumor grade in ilBC cases; (A) and (B) twenty-four sncRNAs were upregulated, and 15 sncRNAs were downregulated in grade III tumors compared to grade I tumors and/or grade II tumors regardless of tumor ER status, (C) seventeen were shared in both gr. III versus gr. II, and gr. III versus gr. I when not adjusted for ER status, and (D) thirteen sncRNAs were significantly associated (Padj < 0.01) with the tumor grade independently of the ER status. (E) The hierarchical clustering of 186 invasive local BC samples (grade I n = 31, grade II n = 89, grade III n = 66) (columns) and differentially expressed sncRNAs (rows) using Euclidean metrics. Log2 fold change is marked by the color scale (from blue to red).
Figure 3
Figure 3
Forty-nine sncRNAs were found as characteristic (Padj < 0.01) to TNBC or luminal BC. The hierarchical clustering of 33 TNBC and 133 luminal BC samples (invasive local disease) (columns) and differentially expressed sncRNAs (rows) using Pearson metrics. Log2 fold change is marked by the color scale (from blue to red).
Figure 4
Figure 4
SNORD6 was identified as a prognostic marker in invasive local BC. (a) The highest quartile (Q4) of SNORD6 significantly associated with better RFS (Overall Padj = 0.1010, Overall P = 0.0486, for Q4 P = 0.0189, HR [CI 95%] = 0.43 [0.22–0.87]), when compared to the lowest quartile (Q1) in all cases with invasive local BC (n = 174) in the Cox multivariate survival analysis including the covariates tumor grade, tumor histology, tumor size, nodal status, ER status, PR status, HER2 status, age at diagnosis, and the treatment parameters radiotherapy (RT) (yes/no), adjuvant chemotherapy (CT) (yes/no), and adjuvant endocrine therapy (ET) (yes/no). Of the covariates, nodal status significantly associated with RFS in the multivariate analysis (Overall P = 5.405e − 05, for node positivity P = 0.0009, HR [CI 95%] = 2.17 [1.37–3.43). (b) Kaplan–Meier plot showing the association of SNORD6 with RFS in the univariate analysis (Overall Log Rank P = 0.0105) in all cases with invasive local BC (n = 186). (c) The highest quartile (Q4) of SNORD6 significantly associated with better RFS (Overall Padj = 0.0182, Overall P = 0.0009, for Q4 P = 0.0125, HR [CI 95%] = 0.24 [0.08–0.74]) also in ER positive cases (invasive local, n = 123) in the Cox multivariate analysis including covariates tumor grade, histology and size, nodal status, PR status, HER2 status, age at diagnosis, and the treatment parameters RT (yes/no), CT (yes/no), and adjuvant ET (yes/no). Of the covariates nodal status (Overall P = 0.0108, for node positivity P = 0.0027, HR [CI 95%] = 2.47 [1.37–4.46]), and age at diagnosis (Overall P = 0.0254, for age class ≤ 39 P = 0.0015, HR [CI 95%] = 4.51 [1.78–11.42]) significantly associated with RFS in the multivariate analysis. (d) Kaplan–Meier plot showing the association of SNORD6 with RFS in the univariate analysis (Overall Log Rank P = 0.0007) in the cases with invasive local, ER positive BC (n = 133). In (a) and (c), the fitted Ns were extrapolated from the multivariate-fitted survival probabilities.
Figure 5
Figure 5
SCARNA5 showed prognostic potential in ER positive invasive local BC. (a) The highest quartile (Q4) of SCARNA5 significantly associated with poorer RFS (Overall Padj = 0.0161, Overall P = 0.0006, for Q4 P = 0.0462, HR [CI 95%] = 3.04 [1.02–9.08]), when compared to the lowest quartile (Q1) in ER positive cases (invasive local, n = 123) in the Cox multivariate analysis including the covariates tumor grade, histology and size, nodal status, PR status, HER2 status, age at diagnosis, and the treatment parameters RT (yes/no), CT (yes/no), and adjuvant ET (yes/no). Of the covariates nodal status (Overall P = 0.0096, for node positivity P = 0.0063, HR [CI 95%] = 2.35 [1.27–4.33]), and age at diagnosis (Overall P = 0.015, for age class ≤ 39 P = 0.0013, HR [CI 95%] = 4.68 [1.85–12.02]) significantly associated with RFS in the multivariate analysis. (b) Kaplan–Meier plot showing the association of SCARNA5 with RFS in the univariate analysis (Overall Log Rank P = 0.0071) in the invasive local, ER positive cases (n = 133). (c) The higher level of SCARNA5 associated with poorer RFS (Overall Padj = 0.0051, Overall P = 3.86e − 05, for higher half P = 0.0027, HR [CI 95%] = 2.79 [1.43–5.44]) in the cases with invasive local, ER positive BC also when the expression level was divided into two groups according to median in the Cox multivariate analysis including the covariates tumor grade, histology and size, nodal status, PR status, HER2 status, age at diagnosis, and the treatment parameters RT (yes/no), CT (yes/no), and adjuvant ET (yes/no). Also nodal status (Overall P = 0.0086, for node positivity P = 0.0061, HR [CI 95%] = 2.33 [1.27–4.28]), and age at diagnosis (Overall P = 0.014, for age class ≤ 39 P = 0.0010, HR [CI 95%] = 4.64 [1.86–11.61]) remained significant. (d) Kaplan–Meier plot showing the association of SCARNA5 with RFS according to median in the univariate analysis (Overall Log Rank P = 0.0010) in the cases with ER positive, invasive local BC (n = 133). In (a) and (c), the fitted Ns were extrapolated from the multivariate-fitted survival probabilities.
Figure 6
Figure 6
SNORD60 and SNORD67 were identified as candidates for predictive markers for RT in invasive local BC. (a) The higher quartiles (Q3 and Q4) of SNORD60 significantly associated with poorer OS in the Cox multivariate analysis including the covariates tumor grade, histology and size, nodal status, ER status, PR status, HER2 status, age at diagnosis, and the treatment parameters CT (yes/no), and adjuvant ET (yes/no) (Overall Padj = 0.1042, Overall P = 0.0289, for Q3 P = 0.0008, HR [CI 95%] = 3.90 [1.76–8.63], and for Q4 P = 0.0206, HR [CI 95%] = 2.48 [1.15–5.37]) in all cases with invasive local BC who had received RT (n = 91). (b) Kaplan–Meier plot showing the association of SNORD60 with OS in the univariate analysis (Overall Log Rank P = 0.0313) in all cases with invasive local BC who had received RT (n = 97). (c) The highest quartile (Q4) of SNORD67 significantly associated with better BCSS in the cases with ER positive BC (invasive local, n = 58) who had received RT (Overall Padj = 0.0941, Overall P = 0.0485, for Q4 P = 0.0132, HR [CI 95%] = 0.25 [0.08–0.75]; Cox multivariate analysis including the covariates tumor grade, histology and size, nodal status, PR status, HER2 status, age at diagnosis, and the treatment parameters CT (yes/no), and adjuvant ET (yes/no). (d) Kaplan–Meier plot showing the association of SNORD67 with BCSS in the univariate analysis (Overall Log Rank P = 0.0397) in cases with invasive local, ER positive BC who had received RT (n = 64). In (a) and (c), the fitted Ns were extrapolated from the multivariate-fitted survival probabilities.
Figure 7
Figure 7
Examples of candidate sncRNAs predictive for tamoxifen response in invasive local BC. (a) The higher SNORA11 quartiles (Q3 and Q4) significantly associated with better RFS in the Cox multivariate analysis including the covariates tumor grade, histology and size, nodal status, PR status, HER2 status, age at diagnosis, and RT (yes/no) (Overall Padj = 0.0393, Overall P = 0.0104, for Q3 P = 0.0002, HR [CI 95%] = 0.05 [0.01–0.24], and for Q4 P = 1.8e − 08, HR [CI 95%] = 0.02 [0.01–0.08]), when compared to the lowest quartile (Q1) in the cases with ER positive BC who had received tamoxifen (invasive local, n = 31). (b) Kaplan–Meier plot showing the association of SNORA11 with RFS in the univariate analysis (Overall Log Rank P = 0.0755) in the tamoxifen-treated cases with invasive local, ER positive BC (n = 35). Note the low number of events in the Q1 group. (c) The higher SCARNA11 quartiles (Q3 and Q4) significantly associated with better OS in the Cox multivariate analysis including the covariates tumor grade, histology and size, nodal status, PR status, HER2 status, age at diagnosis, and RT (yes/no) (Overall Padj = 0.0471, Overall P = 0.0184, for Q3 P = 0.0021, HR [CI 95%] = 0.13 [0.04–0.48], and for Q4 P = 0.0023, HR [CI 95%] = 0.12 [0.03–0.47]), when compared to the lowest quartile (Q1) in the cases with ER positive BC who had received tamoxifen (invasive local, n = 31). (d) Kaplan–Meier plot showing the association of SCARNA11 with OS in the univariate analysis (Overall Log Rank P = 0.0163) in the tamoxifen-treated cases with local invasive, ER positive BC (n = 35). In (a) and (c), the fitted Ns were extrapolated from the multivariate-fitted survival probabilities. Note that the last time point in (a) is at 19.74 and in (c) 19.43 years.

Similar articles

Cited by

References

    1. Sung H, et al. Global cancer statistics 2020: GLOBOCAN estimates of incidence and mortality worldwide for 36 cancers in 185 countries. CA Cancer J. Clin. 2021;71:209–249. doi: 10.3322/caac.21660. - DOI - PubMed
    1. Umu SU, et al. A comprehensive profile of circulating RNAs in human serum. RNA Biol. 2018;15:242–250. doi: 10.1080/15476286.2017.1403003. - DOI - PMC - PubMed
    1. Yeri A, et al. Total extracellular small RNA profiles from plasma, saliva, and urine of healthy subjects. Sci. Rep. 2017;7:44061. doi: 10.1038/srep44061. - DOI - PMC - PubMed
    1. Mattick JS, Makunin IV. Non-coding RNA. Hum. Mol. Genet. 2006;15(Suppl_1):R17–R29. doi: 10.1093/hmg/ddl046. - DOI - PubMed
    1. Kowalski MP, Krude T. Functional roles of non-coding Y RNAs. Int. J. Biochem. Cell Biol. 2015;66:20–29. doi: 10.1016/j.biocel.2015.07.003. - DOI - PMC - PubMed

Substances