. 2023 Mar;37(3):571-579.
doi: 10.1038/s41375-022-01800-0. Epub 2022 Dec 30.

High caspase 3 and vulnerability to dual BCL2 family inhibition define ETO2::GLIS2 pediatric leukemia

Affiliations

High caspase 3 and vulnerability to dual BCL2 family inhibition define ETO2::GLIS2 pediatric leukemia

Zakia Aid et al. Leukemia. 2023 Mar.

Abstract

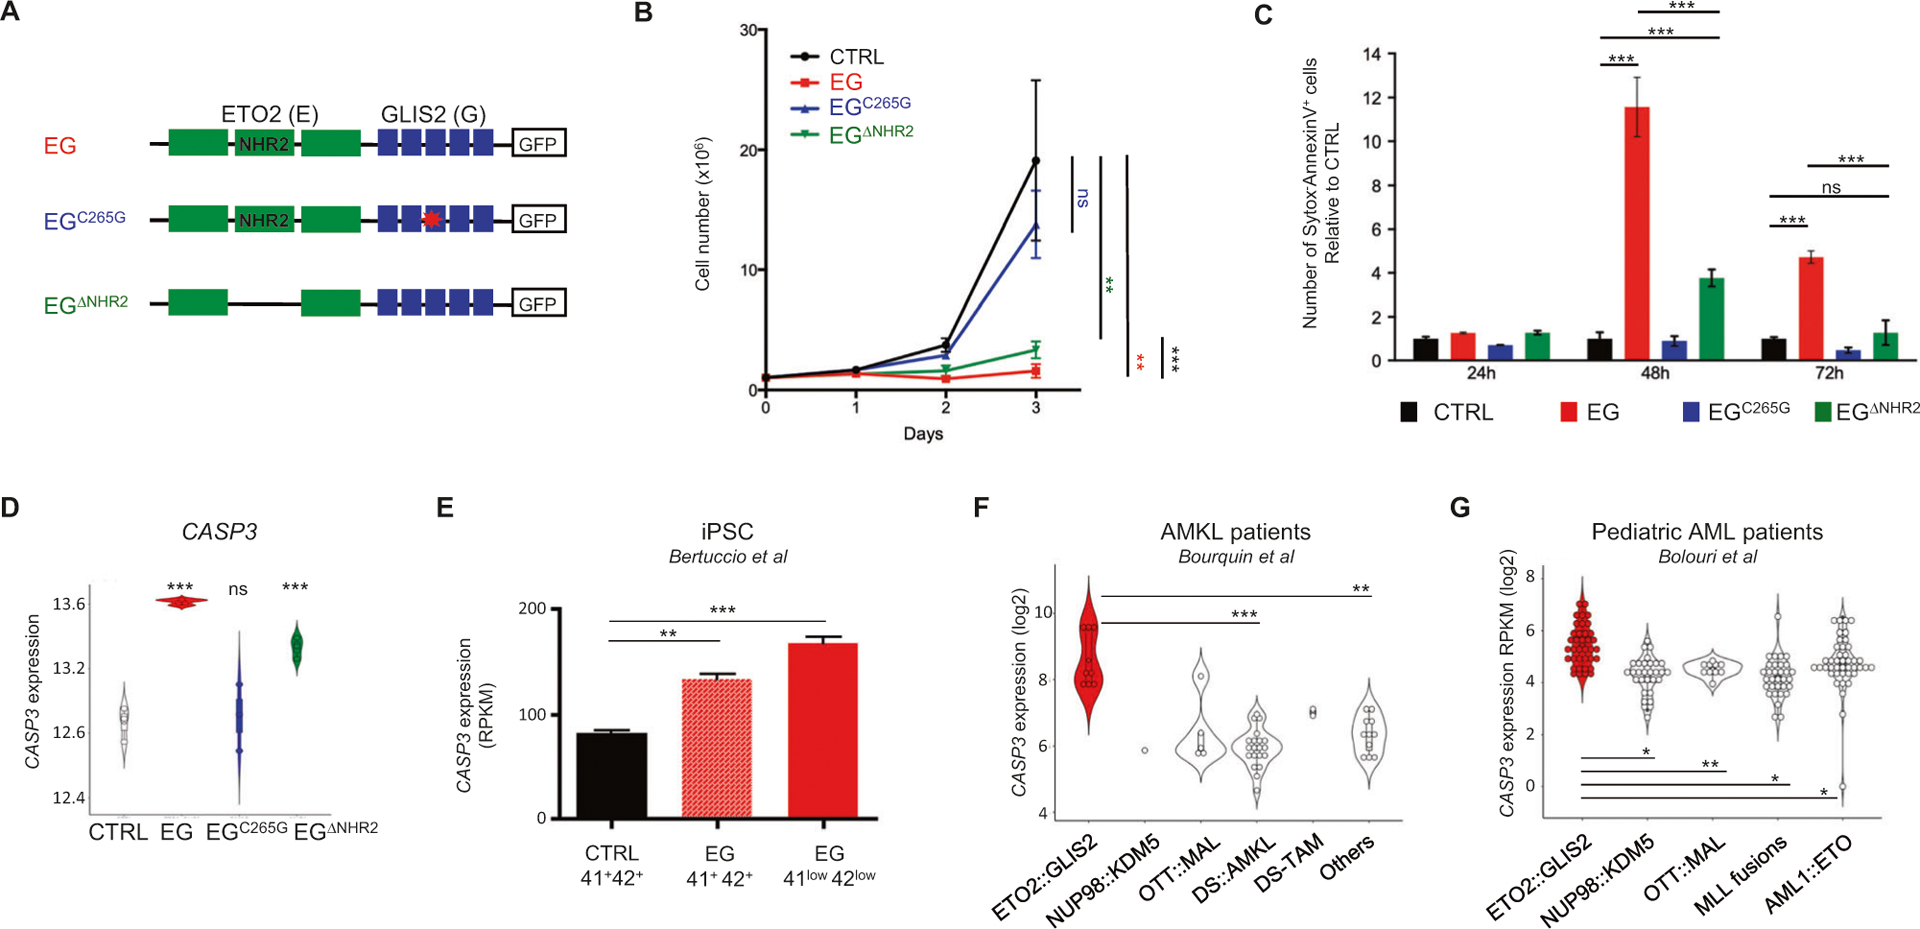
Pediatric acute myeloid leukemia expressing the ETO2::GLIS2 fusion oncogene is associated with dismal prognosis. Previous studies have shown that ETO2::GLIS2 can efficiently induce leukemia development associated with strong transcriptional changes but those amenable to pharmacological targeting remained to be identified. By studying an inducible ETO2::GLIS2 cellular model, we uncovered that de novo ETO2::GLIS2 expression in human cells led to increased CASP3 transcription, CASP3 activation, and cell death. Patient-derived ETO2::GLIS2+ leukemic cells expressed both high CASP3 and high BCL2. While BCL2 inhibition partly inhibited ETO2::GLIS2+ leukemic cell proliferation, BH3 profiling revealed that it also sensitized these cells to MCL1 inhibition indicating a functional redundancy between BCL2 and MCL1. We further show that combined inhibition of BCL2 and MCL1 is mandatory to abrogate disease progression using in vivo patient-derived xenograft models. These data reveal that a transcriptional consequence of ETO2::GLIS2 expression includes a positive regulation of the pro-apoptotic CASP3 and associates with a vulnerability to combined targeting of two BCL2 family members providing a novel therapeutic perspective for this aggressive pediatric AML subgroup.


Conflict of interest statement

COMPETING INTERESTS

The authors declare no competing interests.

Figures

Fig. 1
Fig. 1. ETO2∷GLIS2 induces cell death with CASP3 upregulation mostly via GLIS2 moiety.
A HEL model of doxycycline-inducible expression of ETO2∷GLIS2 (EG), ETO2∷GLIS2ΔNHR2, and ETO2∷GLIS2C265G. Schematic representation of the constructs expressed through lentiviral delivery to generate HEL models. Empty box: GFP tag fused in Ct of the constructs. B Proliferation assay for HEL cells upon expression of ETO2∷GLIS2 and mutants. Mean ± SEM (n = 6) is shown. Statistical significance is indicated as p values (Student t-test). ns: p > 0.05, **p < 0.01, ***p < 0.001. C Histogram of the percentages of SytoxAnnexinV+ apoptotic cells analyzed by flow cytometry. Mean ± SEM (n = 3) is represented. D CASP3 mRNA levels on HEL cells upon expression of ETO2∷GLIS2 and mutants (log2 RPKM). E CASP3 mRNA levels upon expression of ETO2∷GLIS2 in hematopoietic cells differentiated from wild-type (CTRL) and ETO2∷GLIS2 (EG) induced pluripotent stem cells [34]. 41+42+ indicates expression in maturing megakaryocytes. 41low42low indicates expression in EG-specific immature population presenting a molecular signature closer to ETO2∷GLIS2 patients. F CASP3 mRNA levels in pediatric AMKL subgroups [32, 54]. Wilcoxon test corrected for multiple comparisons was used. The low number of samples in some group precluded computation of statistical significance between some groups. G CASP3 mRNA levels in pediatric AML subgroups [3]. Wilcoxon test corrected for multiple comparisons (adjusted p-values computed with Benjamini-Hochberg method) was used. Statistical significance with the indicated test is shown: *<0.05, **<0.01, ***<0.001, ns >0.05.
Fig. 2
Fig. 2. Ectopic ETO2∷GLIS2 expression induces CASP3 activation and the intrinsic apoptosis pathway.
A Western blot analysis of CASP3 expression in HEL cell 48 h post-induction. B Caspase cleavage activity using DEVD peptide. The AU/mg of protein ± SD (n = 3) is represented. C Representative TMRE staining in the absence or presence of doxycycline (DOX) for 48 h. D Quantification of results shown in C (n = 3). Statistical significance is indicated as p values (Student t test). ns: p > 0.05, **p < 0.01, ***p < 0.001. E Cell extracts were fractionated and analyzed for release of SMAC and CytoC in the cytoplasm. PDI and γ-Tubulin were used as markers of microsome and cytoplasm, respectively. F Detection of active BAX in ETO2∷GLIS2 vs. ETO2∷GLIS2C265G HEL cells. IP: immunoprecipitation. Ig: unspecific immunoglobulin. G Western blot analyses of the indicated proteins in HEL models and M07e cells. H CTRL and ETO2∷GLIS2 HEL cells were treated with 50 μM QVD and analyzed for Annexin V staining 48 h post-doxycycline induction. I Western blot analysis of CASP3 expression in cells analyzed in H. Statistical significance is indicated as adjusted p values (FDR): *<0.05, **<0.01, ***p < 0.001.
Fig. 3
Fig. 3. High BCL2 expression and redundancy between BCL2 and MCL1 in ETO2∷GLIS2+ leukemic cells.
A Western blot analysis of ETO2∷GLIS2 (CHRF, HEL) and ETO2∷GLIS2+ (M07e, WSU-AML, CMS) human leukemia cell lines and of cells from a PDX model of ETO2∷GLIS2+ AMKL (AMKL7). Red writing indicates ETO2∷GLIS2+ cells. B Relative cell number of M07e cells treated for 72 h with the indicated concentration of ABT199 using MTS assay. Counts were normalized to the DMSO (0) condition. Mean + /−SEM (n = 3) is indicated. C Representative BH3 profiling analysis in M07e cells. The percentages of TMRE-negative cells are indicated on the FACS plots. Lower raw: cells were pretreated with 50 nM of ABT199 for 16 h. D Histogram representation of the percentages of TMRE negative cells described in C. Mean ± SD of three independent analyses is shown. E Representative BH3 profiling analysis on cells from a PDX model (AML026). Lower raw: cells were pretreated with 5 nM of ABT199 for 16 h. F Histogram representation of the percentages of TMRE negative cells described in E. Mean ± SD of three independent PDX models (AML026, AMKL7, and CONECT-110) is shown. Statistical significance is indicated as p values (Student t test). *p < 0.05, **p < 0.01, ***p < 0.001.
Fig. 4
Fig. 4. Combined BCL2 and MCL1 inhibition synergizes in ETO2∷GLIS2 AMKL in vitro.
A Relative cell number for the ETO2∷GLIS2+ M07e cell line following culture for 72 h with the indicated concentration of ABT199 and/or S63845 using MTS assay. Mean ± SEM (n = 3–6) is shown. B Western blot analysis of CASP3 expression in M07e cells after 48 h of treatment. C DEVD cleavage activity in M07e cells analyzed at 4 h following treatment with ABT199 (50 nM), S63845 (50 nM) or the combination of both. Mean ± SD of duplicates are shown. D Relative cell number cells following ex vivo treatment of cells from the AML026 PDX model for 48 h with the indicated concentration of ABT199 and/or S63845 using MTS assay. Mean ± SEM of three replicates is shown. E Heatmap representation of the relative cell number compared to controls following treatments with indicated doses as in C. Upper panel: human cell lines. Lower panel: ex vivo treatment of PDX models. Red writing indicates ETO2∷GLIS2+ cells. F Combination index computed with the Compusyn software using data generated in A, C, D. Each dot represents an independent replicate. Red dots indicate ETO2∷GLIS2+ samples. Statistical significance is indicated as p values (Student t test). *p < 0.05, **p < 0.01, ***p < 0.001.
Fig. 5
Fig. 5. Combined BCL2 and MCL1 inhibition abrogates disease development in PDX models.
A Schematic representation of the 4-week treatment schedule for ABT199 alone, S63845 alone or the combination. Prior to injection into NSG immunodeficient murine recipients, cells from PDX models were transduced with dual mCherry/luciferase reporter. Arrow heads indicate timing of the imaging to quantify the luciferase (Luc) expressed in PDX leukemic cells. B Quantification of luciferase activity during and after treatment of the AMKL7 PDX model with vehicle only (placebo) (n = 9) or the combination of ABT199 and S63845 (n = 7). Left panel: mean ± SD of the indicated number of mice per group is shown. Right panel: representative images at 14 weeks. C Representative flow cytometry analysis of bone marrow cells to quantify mCherry+ leukemic cells. SSC-A: Side scatter area. D Kaplan–Meier survival plot for the mice described in B, C. Median survival: CTRL = 99.5 (n = 18), ABT199 = 130 (n = 10), S63845 = 98 (n = 10), ABT199 + S63845 = undefined (n = 7). Note that for the two animals that succumbed the ABT199 + S63845 group, flow cytometry could not be performed as the animals were found post-mortem but an analysis on the bone marrow aspirate two weeks prior to their death showed an absence of human leukemia similarly to the other mice in this group, leaving the cause of their death undetermined. E Quantification of luciferase activity during and after treatment of the CONECT-110 PDX model with vehicle only (placebo) or the combination of ABT199 and S63845. Mean ± SEM of the indicated number of mice per group in shown. Statistical significance is indicated as p values (Student t test). *p < 0.05, **p < 0.01, ***p < 0.001. F Representative flow cytometry analysis of bone marrow cells for the detection of KIT+CD41+ leukemic cells.

Similar articles

Cited by

References

    1. Pession A, Masetti R, Rizzari C, Putti MC, Casale F, Fagioli F, et al. Results of the AIEOP AML 2002/01 multicenter prospective trial for the treatment of children with acute myeloid leukemia. Blood. 2013;122:170–8. - PubMed
    1. Eisfeld A-K, Kohlschmidt J, Mrózek K, Blachly JS, Walker CJ, Nicolet D, et al. Mutation patterns identify adult patients with de novo acute myeloid leukemia aged 60 years or older who respond favorably to standard chemotherapy: an analysis of Alliance studies. Leukemia. 2018;32:1338–48. - PMC - PubMed
    1. Bolouri H, Farrar JE, Triche T, Ries RE, Lim EL, Alonzo TA, et al. The molecular landscape of pediatric acute myeloid leukemia reveals recurrent structural alterations and age-specific mutational interactions. Nat Med. 2018;24:103–12. - PMC - PubMed
    1. Delbridge ARD, Grabow S, Strasser A, Vaux DL. Thirty years of BCL-2: translating cell death discoveries into novel cancer therapies. Nat Rev Cancer. 2016;16:99–109. - PubMed
    1. Pan R, Hogdal LJ, Benito JM, Bucci D, Han L, Borthakur G, et al. Selective BCL-2 inhibition by ABT-199 causes on-target cell death in acute myeloid leukemia. Cancer Discov. 2014;4:362–75. - PMC - PubMed

Publication types