. 2023 May;89(5):1901-1914.
doi: 10.1002/mrm.29574. Epub 2022 Dec 31.

Accelerated and quantitative three-dimensional molecular MRI using a generative adversarial network

Affiliations

Accelerated and quantitative three-dimensional molecular MRI using a generative adversarial network

Jonah Weigand-Whittier et al. Magn Reson Med. 2023 May.

Abstract

Purpose: To substantially shorten the acquisition time required for quantitative three-dimensional (3D) chemical exchange saturation transfer (CEST) and semisolid magnetization transfer (MT) imaging and allow for rapid chemical exchange parameter map reconstruction.

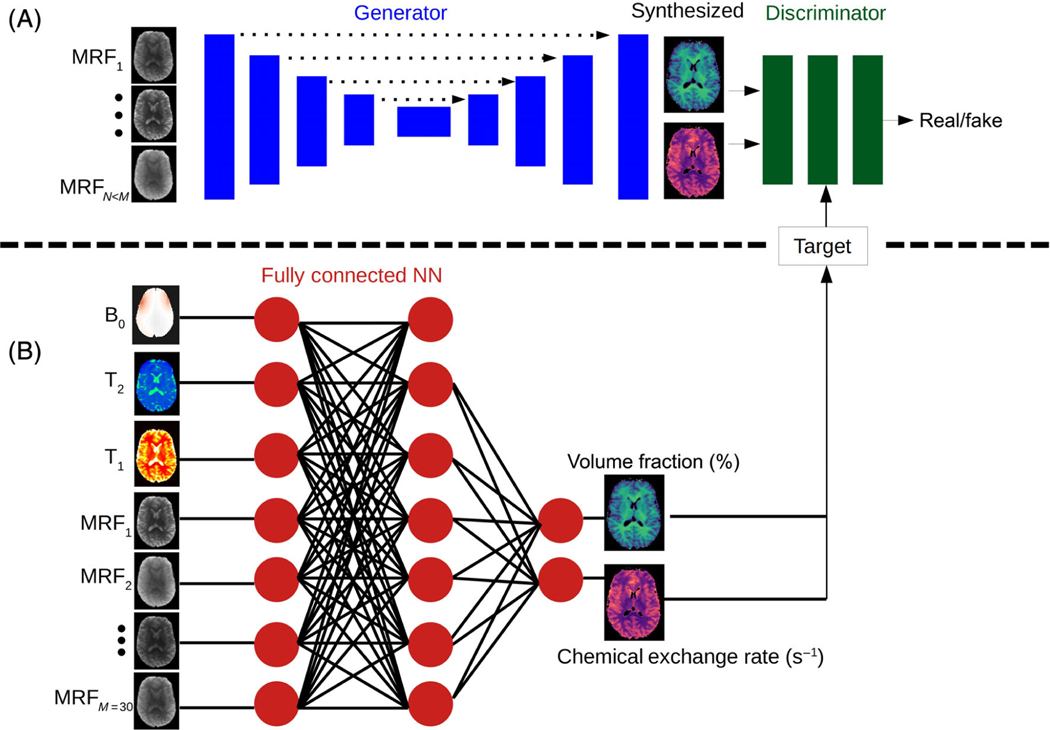
Methods: Three-dimensional CEST and MT magnetic resonance fingerprinting (MRF) datasets of L-arginine phantoms, whole-brains, and calf muscles from healthy volunteers, cancer patients, and cardiac patients were acquired using 3T clinical scanners at three different sites, using three different scanner models and coils. A saturation transfer-oriented generative adversarial network (GAN-ST) supervised framework was then designed and trained to learn the mapping from a reduced input data space to the quantitative exchange parameter space, while preserving perceptual and quantitative content.

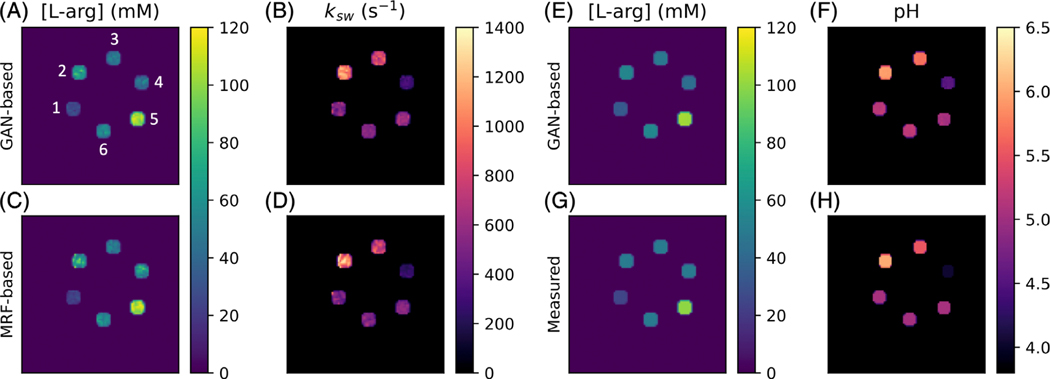
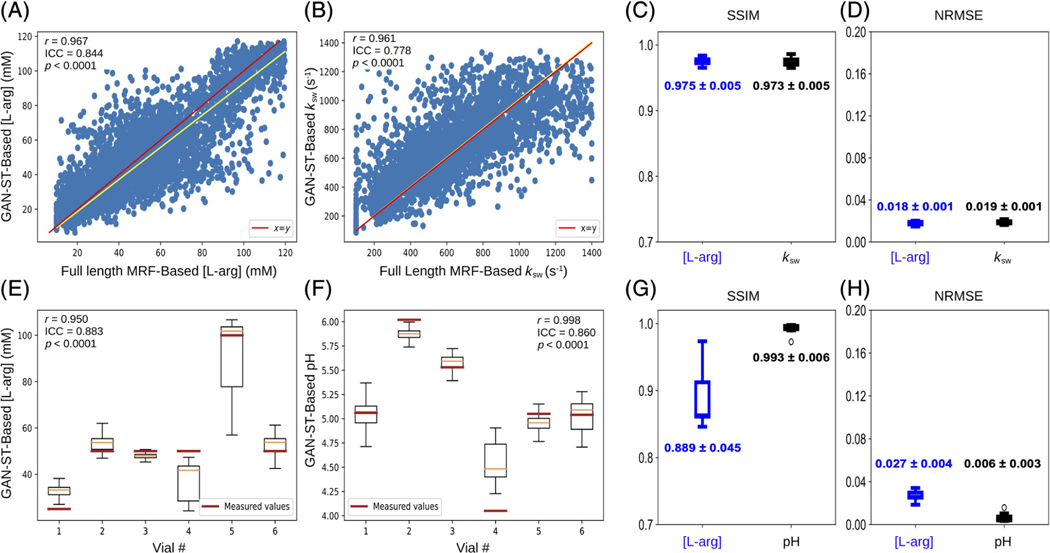
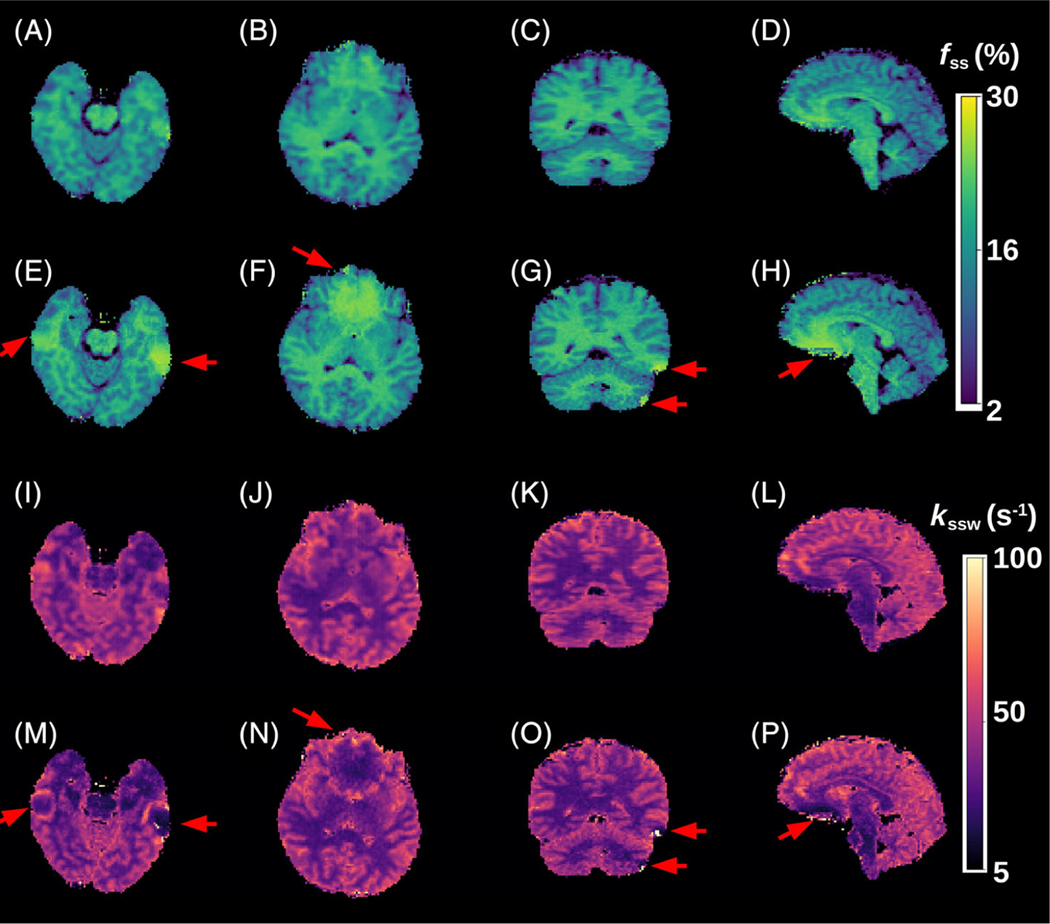
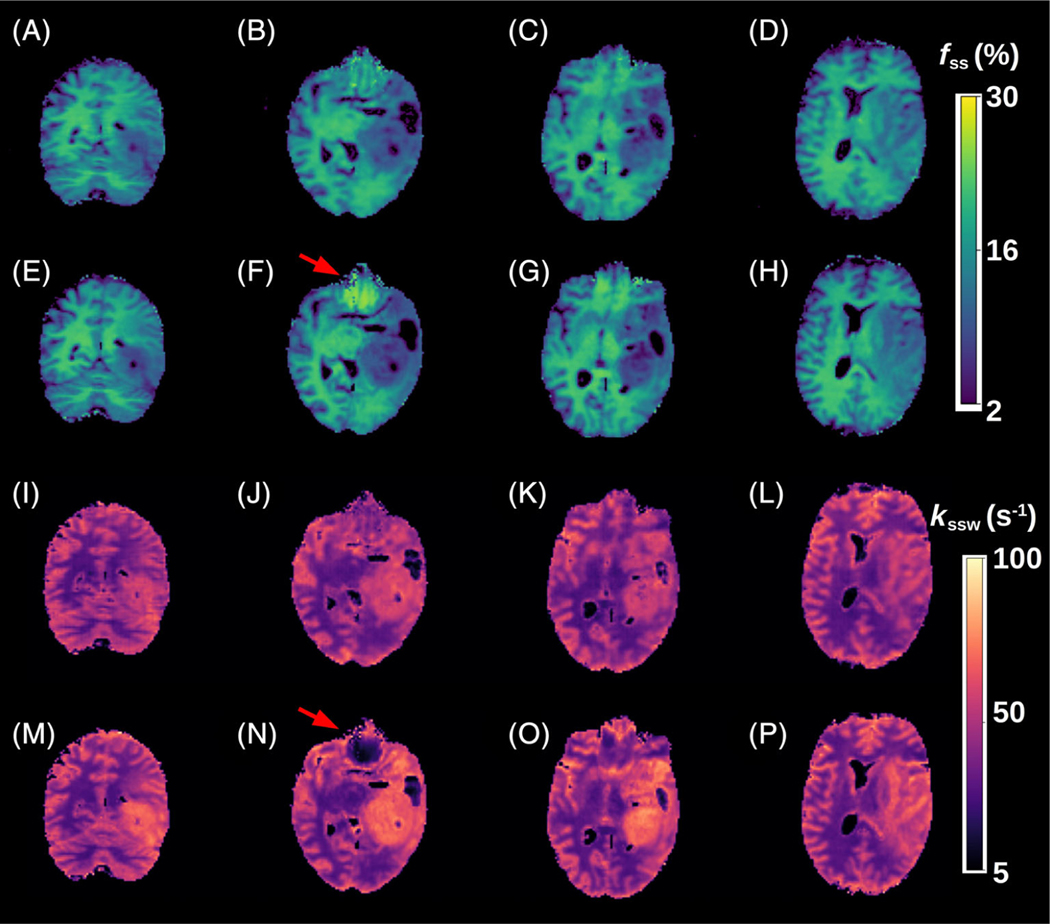
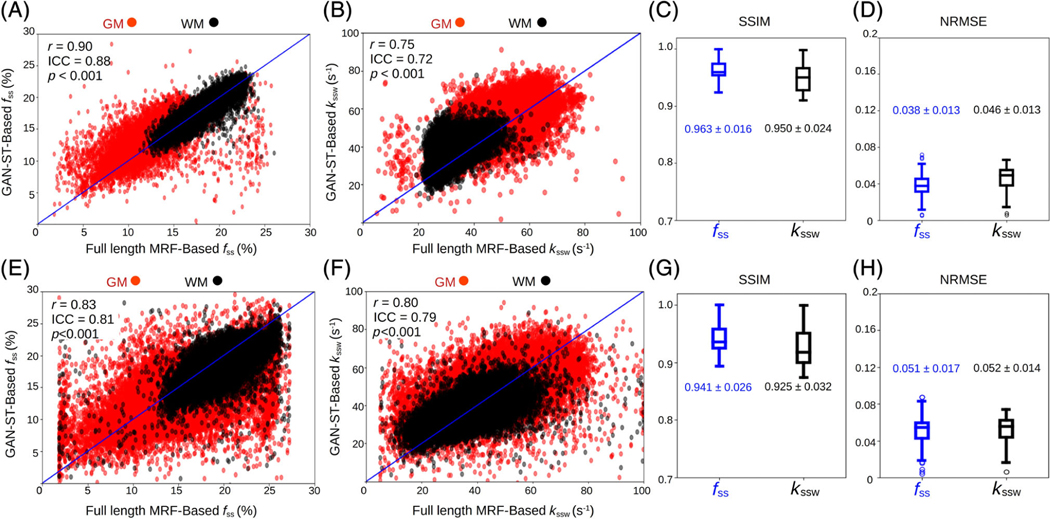
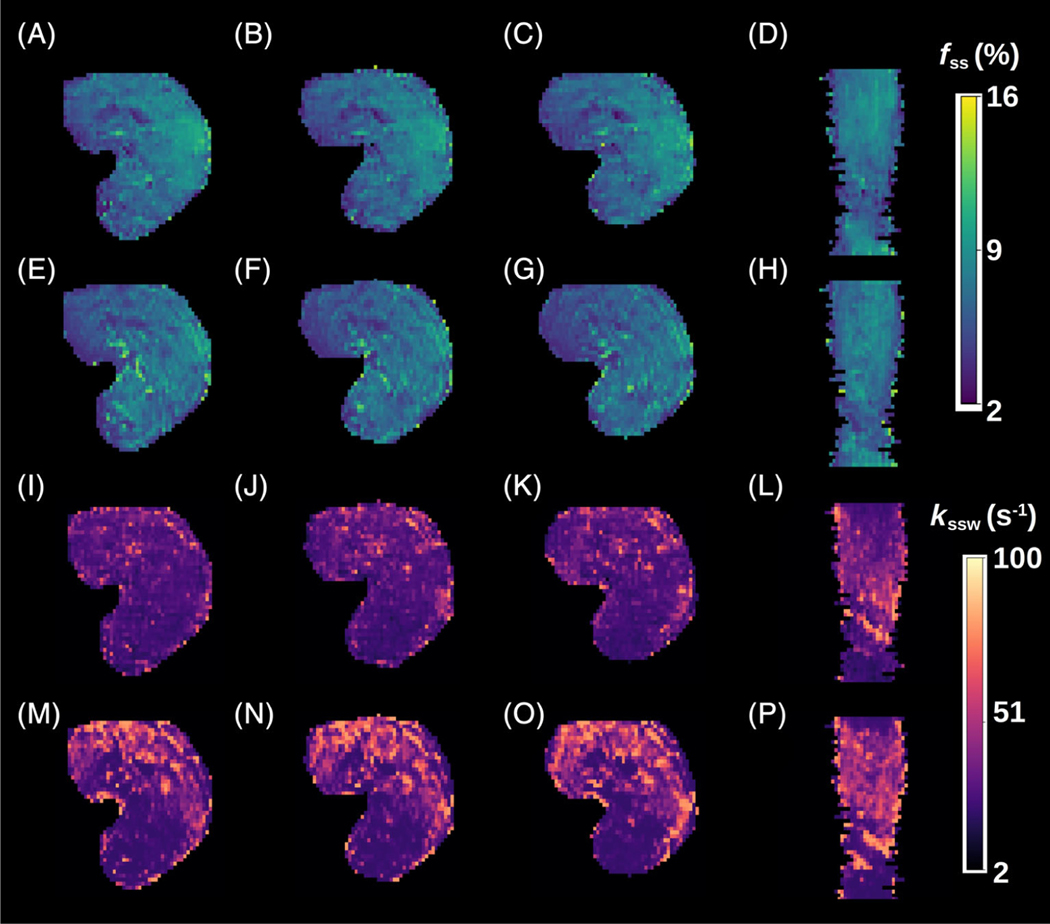
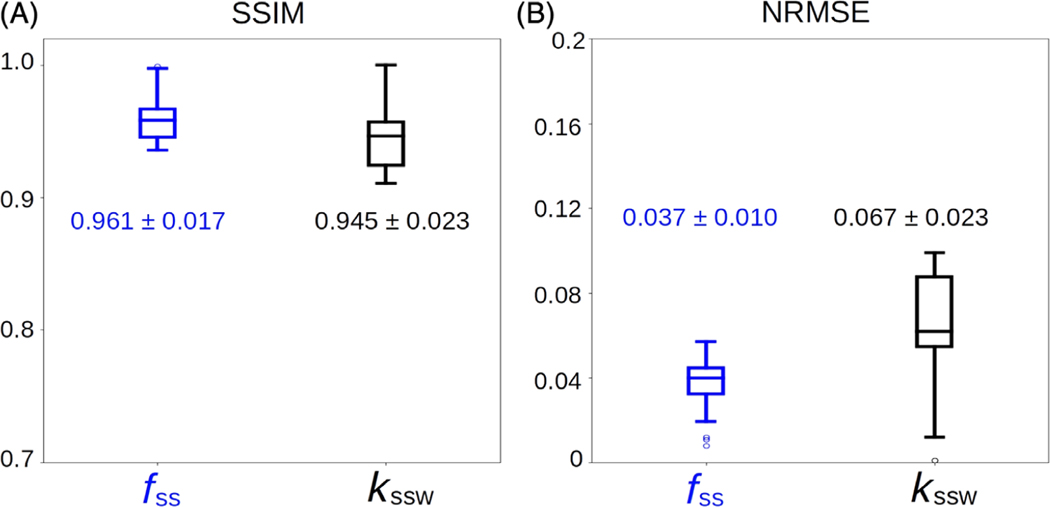
Results: The GAN-ST 3D acquisition time was 42-52 s, 70% shorter than CEST-MRF. The quantitative reconstruction of the entire brain took 0.8 s. An excellent agreement was observed between the ground truth and GAN-based L-arginine concentration and pH values (Pearson's r > 0.95, ICC > 0.88, NRMSE < 3%). GAN-ST images from a brain-tumor subject yielded a semi-solid volume fraction and exchange rate NRMSE of 3 . 8 ± 1 . 3 % $$ 3.8\pm 1.3\% $$ and 4 . 6 ± 1 . 3 % $$ 4.6\pm 1.3\% $$ , respectively, and SSIM of 96 . 3 ± 1 . 6 % $$ 96.3\pm 1.6\% $$ and 95 . 0 ± 2 . 4 % $$ 95.0\pm 2.4\% $$ , respectively. The mapping of the calf-muscle exchange parameters in a cardiac patient, yielded NRMSE < 7% and SSIM > 94% for the semi-solid exchange parameters. In regions with large susceptibility artifacts, GAN-ST has demonstrated improved performance and reduced noise compared to MRF.

Conclusion: GAN-ST can substantially reduce the acquisition time for quantitative semi-solid MT/CEST mapping, while retaining performance even when facing pathologies and scanner models that were not available during training.

Keywords: chemical exchange saturation transfer; generative adversarial network; magnetic resonance fingerprinting; magnetization transfer; pH; quantitative imaging.


Figures

FIGURE 1
FIGURE 1
Generative adversarial network (GAN)-saturation transfer (ST) architecture. (A) A conditional GAN framework, receives N raw, molecular information encoding semi-solid magnetization transfer/chemical exchange saturation transfer images, and is trained to simultaneously output the quantitative proton volume fraction and the exchange rate maps. (B) A fully connected neural network, receiving the full-length raw magnetic resonance fingerprinting image series (M > N) pixelwise, as well as T1, T2, and B0 maps, and yielding the reference proton volume fraction and exchange rate maps. The output of this network was used for training GAN-ST.
FIGURE 2
FIGURE 2
Generative adversarial network (GAN)-saturation transfer (ST) in vitro image results. (A,B) L-arginine concentration (A) and exchange rate (B) maps from GAN-ST-based reconstruction, obtained with N = 9. Vials are numbered 1–6. (C,D) Full-length chemical exchange saturation transfer-magnetic resonance fingerprinting-based L-arginine concentration (C) and exchange rate (D) maps, obtained with M = 30. (E,F) GAN-ST-based (N = 9) concentration (E) and pH (F) maps. (G,H) Concentration (G) and pH (H) maps obtained using gold-standard non-MRI measures.
FIGURE 3
FIGURE 3
Statistical analysis and quantitative assessment of Generative adversarial network (GAN)-saturation transfer (ST) performance in vitro. (A,B) Correlation between GAN-ST based and chemical exchange saturation transfer-magnetic resonance fingerprinting-based concentration (A) and exchange rate (B) maps across the entire three-dimensional volume of an L-arginine phantom. (E,F) Box plots showing the distribution of per-vial GAN-ST-based L-arg concentration (E) and pH (F) maps with measured values indicated. Vial numbers are based on Figure 2A. (C,D,G,H) Structural similarity index and normalized root mean squared error for concentration/exchange rate (C,D) and concentration/pH (G,H) maps.
FIGURE 4
FIGURE 4
Quantitative semisolid magnetization transfer (MT) parameter maps from a healthy volunteer, scanned at a site and scanner model that were not used during training. (A–D) Generative adversarial network (GAN)-saturation transfer (ST)-based semi-solid MT proton volume fraction maps, obtained with N = 9. (E-H) chemical exchange saturation transfer (CEST)-magnetic resonance fingerprinting (MRF)-based semisolid MT proton volume fraction maps, obtained with M = 30. (I-L) GAN-ST-based semi-solid MT proton exchange rate maps, obtained with N = 9. (M-P) CEST-MRF-based semi-solid MT proton exchange rate maps, obtained with M = 30. The red arrows indicate regions with susceptibility artifacts.
FIGURE 5
FIGURE 5
Quantitative semisolid magnetization transfer (MT) parameter maps from a glioblastoma patient. (A–D) Generative adversarial network (GAN)-saturation transfer (ST)-based semi-solid MT proton volume fraction maps, obtained with N = 9. (E–H) chemical exchange saturation transfer (CEST)-magnetic resonance fingerprinting (MRF)-based semisolid MT proton volume fraction maps, obtained with M = 30. (I-L) GAN-ST-based semi-solid MT proton exchange rate maps, obtained with N = 9. (M-P) CEST-MRF-based semi-solid MT proton exchange rate maps, obtained with M = 30. The red arrows indicate regions with susceptibility artifacts.
FIGURE 6
FIGURE 6
Statistical analysis and quantitative assessment of the generative adversarial network (GAN)-saturation transfer (ST) performance in the in vivo brains of a tumor patient (A–D) and a healthy volunteer (E–H). (A,B) Correlation between all GAN-ST-based proton semi-solid magnetization transfer (MT) proton volume fractions (A) and exchange rates (B) for the entire brain in the WM/GM, and the corresponding pixel values obtained using chemical exchange saturation transfer (CEST)-magnetic resonance fingerprinting (MRF). Notably, the GAN-based fss values in the WM are in better agreement with MRF refernce than the GM (Pearson’s r = 90 compared to 0.74, respectively, p < 0.001), due to the myelin-rich content of the WM. (E,F) A similar analysis for the healthy human volunteer scanned at a site and scanner that were not available during training. (C,D,G,H) Structural similarity index metric and normalized root mean squared error for the tumor patient (C,D) and healthy volunteer (G,H).
FIGURE 7
FIGURE 7
Quantitative semi-solid magnetization transfer (MT) parameter maps from the calf muscle of a cardiac patient. (A–D) Generative adversarial network (GAN)-saturation transfer (ST)-based semi-solid MT proton volume fraction maps, obtained with N = 9. (E–H) chemical exchange saturation transfer (CEST)-magnetic resonance fingerprinting (MRF)-based semisolid MT proton volume fraction maps, obtained with M = 30. (I–L) GAN-ST-based semi-solid MT proton exchange rate maps, obtained with N = 9. (M–P) CEST-MRF-based semi-solid MT proton exchange rate maps, obtained with M = 30.
FIGURE 8
FIGURE 8
Statistical analysis and quantitative assessment of the generative adversarial network (GAN)-saturation transfer (ST) performance in the calf-muscle of a cardiac patient. (A) Structural similarity index metric. (B) Normalized root mean squared error

References

    1. Henkelman RM, Stanisz GJ, Graham SJ. Magnetization transfer in MRI: a review. NMR Biomed. 2001;14:57–64. - PubMed
    1. van Zijl PC, Lam WW, Xu J, Knutsson L, Stanisz GJ. Magnetization transfer contrast and chemical exchange saturation transfer MRI. Features and analysis of the field-dependent saturation spectrum. Neuroimage. 2018;168:222–241. - PMC - PubMed
    1. Jiang S, Eberhart CG, Lim M, et al. Identifying recurrent malignant Glioma after treatment using amide proton transfer-weighted MR imaging: a validation study with image-guided stereotactic biopsy identifying recurrent Glioma with APTw MRI. Clin Cancer Res. 2019;25:552–561. - PMC - PubMed
    1. Jones KM, Pollard AC, Pagel MD. Clinical applications of chemical exchange saturation transfer (CEST) MRI. J Magnet Reson Imaging. 2018;47:11–27. - PMC - PubMed
    1. Zhou J, Heo HY, Knutsson L, van Zijl PC, Jiang S. APT-weighted MRI: techniques, current neuro applications, and challenging issues. J Magnet Reson Imaging. 2019;50:347–364. - PMC - PubMed

Publication types