Tumoral CD105 promotes immunosuppression, metastasis, and angiogenesis in renal cell carcinoma
- PMID: 36586013
- PMCID: PMC10991561
- DOI: 10.1007/s00262-022-03356-5
Tumoral CD105 promotes immunosuppression, metastasis, and angiogenesis in renal cell carcinoma
Abstract
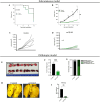
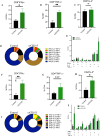
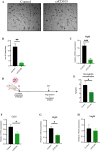
CD105 (endoglin) is a transmembrane protein that functions as a TGF-beta coreceptor and is highly expressed on endothelial cells. Unsurprisingly, preclinical and clinical evidence strongly suggests that CD105 is an important contributor to tumor angiogenesis and tumor progression. Emerging evidence suggests that CD105 is also expressed by tumor cells themselves in certain cancers such as renal cell carcinoma (RCC). In human RCC tumor cells, CD105 expression is associated with stem cell-like properties and contributes to the malignant phenotype in vitro and in xenograft models. However, as a regulator of TGF-beta signaling, there is a striking lack of evidence for the role of tumor-expressed CD105 in the anti-tumor immune response and the tumor microenvironment. In this study, we report that tumor cell-expressed CD105 potentiates both the in vitro and in vivo tumorigenic potential of RCC in a syngeneic murine RCC tumor model. Importantly, we find that tumor cell-expressed CD105 sculpts the tumor microenvironment by enhancing the recruitment of immunosuppressive cell types and inhibiting the polyfunctionality of tumor-infiltrating CD4+ and CD8+ T cells. Finally, while CD105 expression by endothelial cells is a well-established contributor to tumor angiogenesis, we also find that tumor cell-expressed CD105 significantly contributes to tumor angiogenesis in RCC.
Keywords: Angiogenesis; CD105; Endoglin; Renal cell carcinoma; Tumor microenvironment.
© 2022. The Author(s), under exclusive licence to Springer-Verlag GmbH Germany, part of Springer Nature.
Conflict of interest statement
The authors declare that they have no conflicting interests.
Figures


Similar articles
-
CD105 in the progression and therapy of renal cell carcinoma.Cancer Lett. 2023 Aug 28;570:216327. doi: 10.1016/j.canlet.2023.216327. Epub 2023 Jul 26. Cancer Lett. 2023. PMID: 37499740 Review.
-
Neovascularity as a prognostic marker in renal cell carcinoma.Hum Pathol. 2016 Nov;57:98-105. doi: 10.1016/j.humpath.2016.07.005. Epub 2016 Jul 17. Hum Pathol. 2016. PMID: 27436827
-
Expression of CEACAM1 and CD105 in Renal Cell Carcinoma and Its Correlation with Microvessel Density.Crit Rev Eukaryot Gene Expr. 2021;31(1):1-9. doi: 10.1615/CritRevEukaryotGeneExpr.2020037168. Crit Rev Eukaryot Gene Expr. 2021. PMID: 33639050
-
Comparative Gene Expression Profiling of Primary and Metastatic Renal Cell Carcinoma Stem Cell-Like Cancer Cells.PLoS One. 2016 Nov 3;11(11):e0165718. doi: 10.1371/journal.pone.0165718. eCollection 2016. PLoS One. 2016. PMID: 27812180 Free PMC article.
-
CD105 is important for angiogenesis: evidence and potential applications.FASEB J. 2003 Jun;17(9):984-92. doi: 10.1096/fj.02-0634rev. FASEB J. 2003. PMID: 12773481 Review.
Cited by
-
Unraveling the mechanisms of tricetin in renal cell carcinoma treatment through network pharmacology and experimental validation.Med Oncol. 2025 May 3;42(6):192. doi: 10.1007/s12032-025-02744-y. Med Oncol. 2025. PMID: 40319129
-
Evaluation of ENG/CD105 expression, methylation, immuno-response, and cordycepin (CD) regulation as a novel biomarker of breast invasive carcinoma (BRCA).J Cancer. 2024 Aug 13;15(16):5244-5257. doi: 10.7150/jca.98767. eCollection 2024. J Cancer. 2024. PMID: 39247590 Free PMC article.
-
Listeria-based vaccination against the pericyte antigen RGS5 elicits anti-vascular effects and colon cancer protection.Oncoimmunology. 2023 Sep 28;12(1):2260620. doi: 10.1080/2162402X.2023.2260620. eCollection 2023. Oncoimmunology. 2023. PMID: 37781234 Free PMC article.
-
Extranodal lymphoma: pathogenesis, diagnosis and treatment.Mol Biomed. 2023 Sep 18;4(1):29. doi: 10.1186/s43556-023-00141-3. Mol Biomed. 2023. PMID: 37718386 Free PMC article. Review.
References
-
- Kidney and Renal Pelvis Cancer [Internet]. Available from: https://seer.cancer.gov/statfacts/html/kidrp.html.
MeSH terms
Substances
Grants and funding
LinkOut - more resources
Full Text Sources
Medical
Research Materials

