. 2022 Dec 28;157(24):245101.
doi: 10.1063/5.0133826.

Probing conformational landscapes and mechanisms of allosteric communication in the functional states of the ABL kinase domain using multiscale simulations and network-based mutational profiling of allosteric residue potentials

Affiliations

Probing conformational landscapes and mechanisms of allosteric communication in the functional states of the ABL kinase domain using multiscale simulations and network-based mutational profiling of allosteric residue potentials

Keerthi Krishnan et al. J Chem Phys. .

Abstract

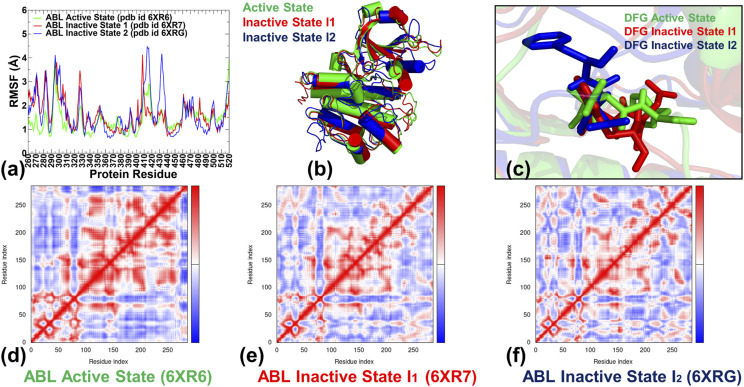
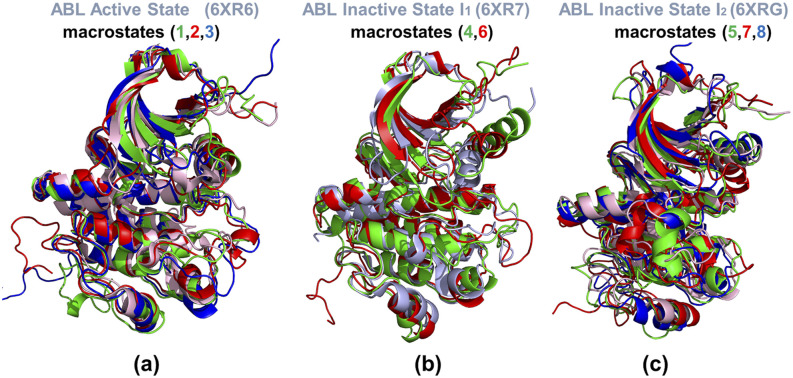
In the current study, multiscale simulation approaches and dynamic network methods are employed to examine the dynamic and energetic details of conformational landscapes and allosteric interactions in the ABL kinase domain that determine the kinase functions. Using a plethora of synergistic computational approaches, we elucidate how conformational transitions between the active and inactive ABL states can employ allosteric regulatory switches to modulate intramolecular communication networks between the ATP site, the substrate binding region, and the allosteric binding pocket. A perturbation-based network approach that implements mutational profiling of allosteric residue propensities and communications in the ABL states is proposed. Consistent with biophysical experiments, the results reveal functionally significant shifts of the allosteric interaction networks in which preferential communication paths between the ATP binding site and substrate regions in the active ABL state become suppressed in the closed inactive ABL form, which in turn features favorable allosteric coupling between the ATP site and the allosteric binding pocket. By integrating the results of atomistic simulations with dimensionality reduction methods and Markov state models, we analyze the mechanistic role of macrostates and characterize kinetic transitions between the ABL conformational states. Using network-based mutational scanning of allosteric residue propensities, this study provides a comprehensive computational analysis of long-range communications in the ABL kinase domain and identifies conserved regulatory hotspots that modulate kinase activity and allosteric crosstalk between the allosteric pocket, ATP binding site, and substrate binding regions.


Conflict of interest statement

The authors have no conflicts to disclose.

Figures

FIG. 1.
FIG. 1.
The NMR solution structure of the thermodynamically stable fully active ground state of the ABL kinase domain (pdb id 6XR6) is represented by green ribbons with cylindrical helices (a). The NMR structure of ABL in the inactive state I1 (pdb id 6XR7) is represented by red ribbons (b) and the ABL structure in the closed inactive state I2 (pdb id 6XRG) is represented by blue ribbons (c). The R-spine residues M309, L320, H380, F401, and D440 in the active state and inactive state I1 are represented by green and blue spheres, respectively. The R-spine positions in the inactive state I2 are L309, L320, H380, F401, and D440 and are represented by blue spheres. The structures point to similarities and differences in the key functional regions of the kinase domain exemplified by the αC helix, the A-loop, and the P-loop. In particular, A-loop in the inactive state I2 (c) adopts a completely different closed conformation. A fully assembled R-spine in the active ABL state (a) becomes partially broken in the inactive state I1 (b) and is fully disassembled in the closed inactive state I2 (c).
FIG. 2.
FIG. 2.
Conformational dynamics profiles of the ABL kinase domain states. (a) The root mean square fluctuation (RMSF) profiles are shown for the active ABL form in green lines, for the inactive I1 state in red lines, and for the inactive closed I2 state in blue lines. (b) Structural superposition of the ensemble-averaged conformations for the active state (in green ribbons), for the inactive I1 state (in red ribbons), and for the inactive I2 state (in blue ribbons). (c) Structural overlay of the regulatory 400-DFG-402 motif from the MD-averaged conformations of the active state (green sticks), the I1 state (red sticks), and the I2 state (blue sticks). A large movement of the F401 residue in the DFG-out conformation of the closed inactive I2 state can be seen. The covariance maps of dynamic cross correlations between pairs of residues in the ABL active state (d), the inactive state I1 (e), and the inactive state I2 (f). Cross correlations of residue-based fluctuations vary between +1 (correlated motion; fluctuation vectors in the same direction, colored in dark red) and −1 (anticorrelated motions; fluctuation vectors in the same direction, colored in dark blue). The values >0.5 are colored in dark red and the lower bound in the color bar indicates the value of the most anticorrelated pairs.
FIG. 3.
FIG. 3.
ollective dynamics profiles of the ABL conformational state. The essential mobility profiles are averaged over the first 10 major low frequency modes. (a) The slow mode profiles of the ABL kinase domain are shown for the active state (in green lines), the inactive I1 state (in red lines), and the inactive I2 state (in blue lines). Structural maps of the essential mobility profiles on PCA of the active state (b), the inactive I1 state (c), and the inactive I2 state (d). The mobility profiles are projected onto experimentally determined ABL structures represented by ribbons and colored from blue to red according to the rigidity-to-flexibility scale determined by PCA. The R-spine residues are shown in spheres colored according to their level of rigidity/flexibility and annotated.
FIG. 4.
FIG. 4.
The residue-based DFCI profiles for the ABL conformational states. (a) The DFCI distributions for the active state (in orange bars) and the inactive state I1 (in maroon-colored bars). (b) The DFCI distributions for the active state (in orange bars) and the inactive state I2 (in maroon-colored bars). The positions of the R-spine residues (M309/L309, L320, H380, F401, D440) are shown in magenta-colored filled circles. The residues involved in the N387-mediated local contact network (N387, C388, A389, D400, F401) are shown in yellow-colored filled squares. A close-up of the local interaction cluster mediated by N387 in the ensemble-averaged conformation of the active form (c), the inactive I1 state (d), and the inactive I2 state (e). The interacting residues are shown in atom-colored sticks and specific interaction contacts are annotated.
FIG. 5.
FIG. 5.
Structural mapping of the N387-medited local interaction cluster and the R-spine residues in the active state (a), the inactive I1 form (b), and the inactive I2 conformation (c). The residues involved in the N387-mediated local contact network (N387, A389, D400, F401) are shown in atom-colored sticks. The R-spine residues are shown in red spheres and annotated. The ABL structures are shown in light-pink colored ribbons.
FIG. 6.
FIG. 6.
Mutational profiling of allosteric residue propensities in the ABL states. The residue-based Z-score profile estimates the average mutation-induced changes in the ASPL network parameter for the active state (a), the inactive I1 state (c), and the inactive I2 state (e). The profiles are shown in brown-colored lines. The positions of the R-spine residues on the distribution are highlighted in magenta-filled circles. The residues in the N387-anchored mediating local cluster (N387, C388, A399, D400, F401) are shown in orange-colored circles. The sites targeted by Imatinib-resistant mutations G269E, 71H, Y272H, E274V, T334I, F378V, and H415V are indicated by yellow-colored filles squares. Structural mapping of the top 20 kinase residues with the highest allosteric mediating potential in the active state (b), the inactive I1 state (d), and the inactive I2 state (f). The highlighted centers (shown in red spheres) are determined by Z-score evaluation of mutational effects on the intramolecular communication paths. The mapped allosteric mediating sites form intramolecular communication routes connecting the ATP site, the substrate binding region, and the allosteric pocket. The observed shifts in preferential communication paths between the active site and the inactive state I2 are highlighted.
FIG. 7.
FIG. 7.
2D ivis dimensionality reduction map and the corresponding implied time scales under different lag times. (a) The distribution of three protein conformations on the reduced 2D space. (b) The estimated relaxation time scale of MSMs under different lag times. The number of steps in MD simulations were used as lag times, ranging from 1 to 2500. In each lag time, an MSM was constructed, and the estimated relaxation time scale was calculated from the transition matrix. The implied time scale converged with a lag time of 2000 steps, which was chosen for MSM construction in further analysis.
FIG. 8.
FIG. 8.
MSM analysis of the ABL conformational landscape. Macrostates 1–3 belong to the active kinase conformation, macrostates 4 and 6 are associated with the inactive structure I, while macrostates 5–8 belong to the inactive structure I2. Based on the RMSDs between representative structures in macrostates and the corresponding native structures, macrostate 1, 6, and 7 were considered as the active state, inactive state I1, and inactive state I2, respectively. Other macrostates were treated as intermediate states.
FIG. 9.
FIG. 9.
Structural analysis of the ABL macrostates. (a) Structural superposition of the conformations representing macrostates 1(in green ribbons), 2 (in red ribbons), and 3 (in blue ribbons) that belong to the active kinase conformation. The experimental active state conformation is shown in light-pink ribbons. (b) Structural superposition of the conformations representing macrostates 4 (in green ribbons) and 6 (in red ribbons) that belong to the inactive I1 state. The experimental I1 conformation is shown in light-pink ribbons. (c) Structural superposition of the conformations representing macrostates 5 (in green ribbons), 7 (in red ribbons), and 8 (in blue ribbons) that belong to the inactive I2 state (shown in light-pink ribbons).

Similar articles

Cited by

References

    1. Wodak S. J. et al., Structure 27, 566 (2019).10.1016/j.str.2019.01.003 - DOI - PMC - PubMed
    1. Tsai C.-J. and Nussinov R., PLoS Comput. Biol. 10, e1003394 (2014).10.1371/journal.pcbi.1003394 - DOI - PMC - PubMed
    1. Motlagh H. N. et al., Nature 508, 331 (2014).10.1038/nature13001 - DOI - PMC - PubMed
    1. Dokholyan N. V., Chem. Rev. 116, 6463 (2016).10.1021/acs.chemrev.5b00544 - DOI - PubMed
    1. Leander M. et al., Proc. Natl. Acad. Sci. U. S. A. 117, 25445 (2020).10.1073/pnas.2002613117 - DOI - PMC - PubMed

Substances