. 2022 Dec 31;12(1):22627.
doi: 10.1038/s41598-022-22175-3.

Immune cell populations differ in patients undergoing revision total knee arthroplasty for arthrofibrosis

Affiliations

Immune cell populations differ in patients undergoing revision total knee arthroplasty for arthrofibrosis

Afton K Limberg et al. Sci Rep. .

Abstract

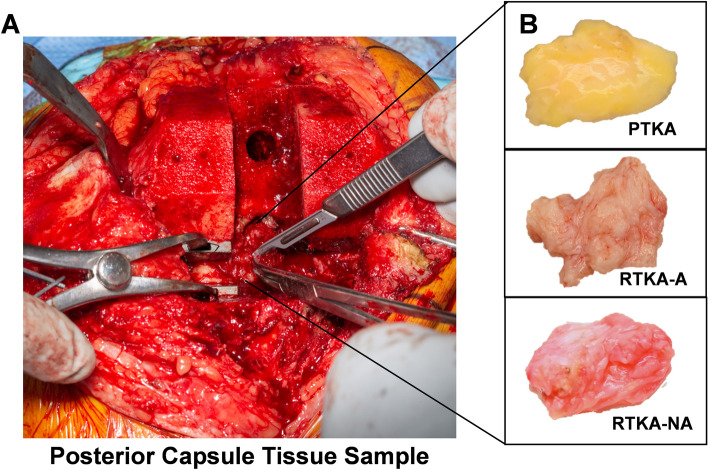
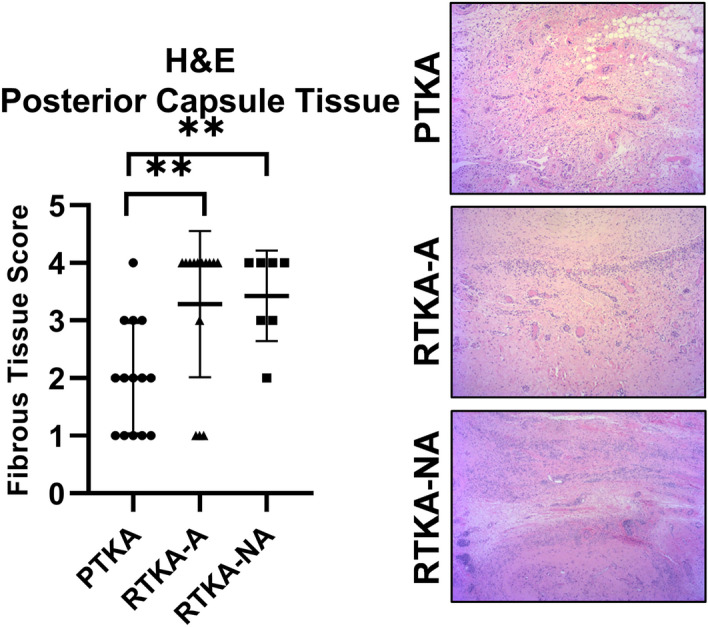
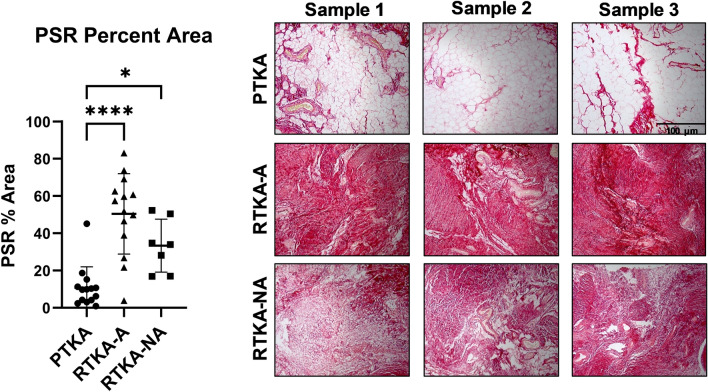
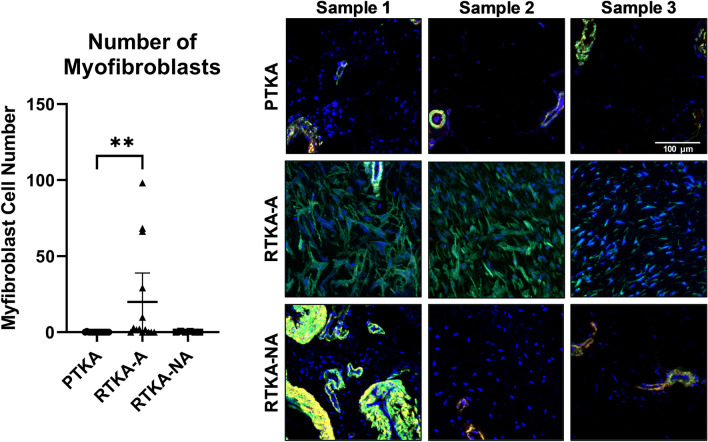
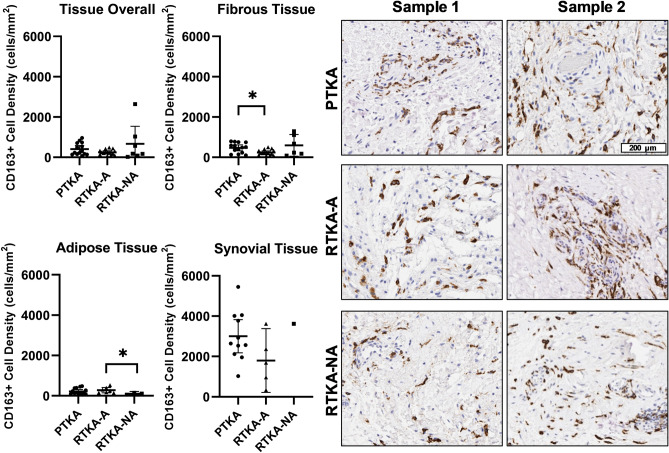
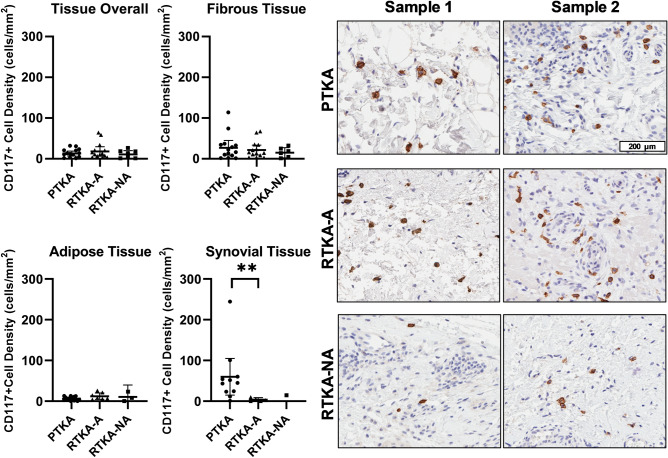
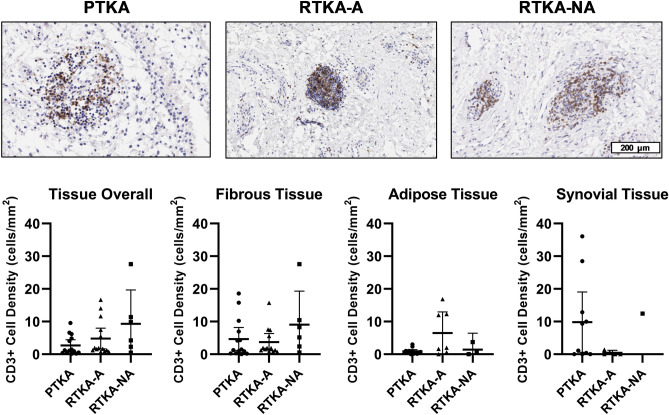
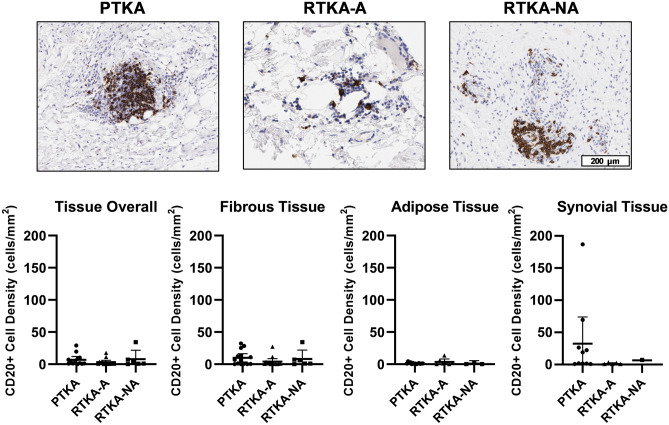
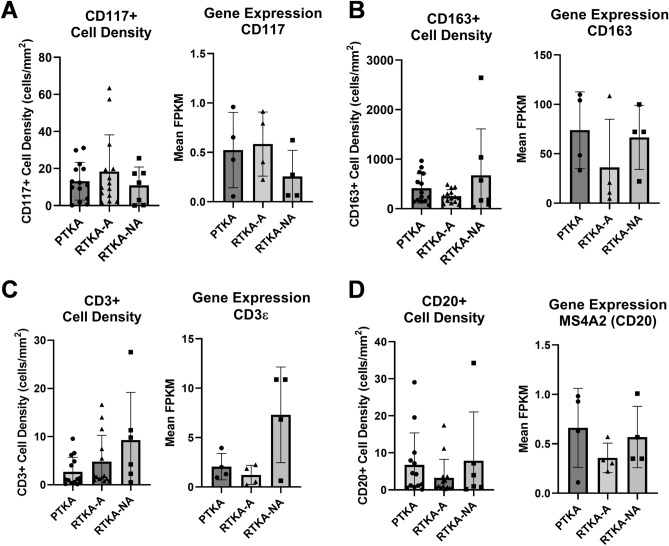
Arthrofibrosis following total knee arthroplasty (TKA) is a debilitating condition typically diagnosed based on clinical findings. To gain insight into the histopathologic immune cell microenvironment of arthrofibrosis, we assessed the extent of tissue fibrosis and quantified immune cell populations in specific tissue regions of the posterior capsule. We investigated specimens from three prospectively-collected, matched cohorts, grouped as patients receiving a primary TKA for osteoarthritis, revision TKA for arthrofibrosis, and revision TKA for non-arthrofibrotic, non-infectious reasons. Specimens were evaluated using hematoxylin and eosin staining, picrosirius red staining, immunofluorescence, and immunohistochemistry with Aperio®-based digital image analysis. Increased collagen deposition and increased number of α-SMA/ACTA2 expressing myofibroblasts were present in the arthrofibrosis group compared to the two non-arthrofibrotic groups. CD163 + macrophages were the most abundant immune cell type in any capsular sample with specific enrichment in the synovial tissue. CD163 + macrophages were significantly decreased in the fibrotic tissue region of arthrofibrosis patients compared to the patients with primary TKA, and significantly increased in adipose tissue region of arthrofibrotic specimens compared to non-arthrofibrotic specimens. Synovial CD117 + mast cells were significantly decreased in arthrofibrotic adipose tissue. Together, these findings inform diagnostic and targeted therapeutic strategies by providing insight into the underlying pathogenetic mechanisms of arthrofibrosis.


Conflict of interest statement

The authors declare no competing interests.

Figures

Figure 1
Figure 1
Intraoperative harvesting of posterior capsule tissue samples. An intraoperative photograph of the posterior capsule tissue sampling site (A). Gross appearance of representative posterior capsule specimens from each of the three patient groups (B). Abbreviations: TKA = total knee arthroplasty, PTKA = primary TKA, RTKA-A = revision TKA for arthrofibrosis, RTKA-NA = revision TKA for non-arthrofibrotic conditions.
Figure 2
Figure 2
Histopathologic assessment of fibrosis in the periarticular knee tissue. Histopathologic fibrotic scores of H&E-stained sections for the periarticular tissue and representative images from the three patient groups (PTKA = primary TKA, RTKA-A = arthrofibrosis, RTKA-NA = non-arthrofibrosis). The graphs depict mean fibrous tissue score ± standard deviation, with each data point representing one patient. Asterisk denotes a significant difference, (**p ≤ 0.01), by the Wilcoxon Rank Sum test. All images were taken using the 10X objective on a Nikon E600 bright-field light microscope.
Figure 3
Figure 3
Picrosirius red staining of periarticular knee tissue. Picrosirius red staining quantification and representative images of three patients from the three patient groups (PTKA = primary TKA, RTKA-A = arthrofibrosis, RTKA-NA = non-arthrofibrosis). The graphs depict mean picrosirius red staining (PSR) percent area ± standard deviation, with each data point representing one patient (average of three areas). Asterisk denotes a significant difference, (*p ≤ 0.05; ****p ≤ 0.0001), by the Wilcoxon Rank Sum test. The scale bar applies to all images in this figure.
Figure 4
Figure 4
Myofibroblast quantification of periarticular knee tissue. Myofibroblast quantification and representative immunofluorescence merged images for α-SMA (green), Laminin (red) and DAPI (blue) from the three patient groups (PTKA = primary TKA, RTKA-A = arthrofibrosis, RTKA-NA = non-arthrofibrosis). Sample 1, Sample 2, and Sample 3 depict images from three different patients for each group. The graphs depict mean myofibroblast number defined as ACTA2 + /Laminin- per area ± standard deviation, with each data point representing one patient. Two asterisks denote a significant difference, p ≤ 0.01, by the Wilcoxon Rank Sum test. The scale bar applies to all images in this figure.
Figure 5
Figure 5
Quantification of macrophages in periarticular knee tissue. Tissue density of CD163 + macrophages per mm2 in the overall tissue as well as the fibrotic, adipose, and synovium regions with representative images from the three groups (PTKA = primary TKA, RTKA-A = arthrofibrosis, RTKA-NA = non-arthrofibrosis). The graphs depict mean macrophage density (CD163 + cell/mm2) ± standard deviation, with each data point representing one patient. Asterisk denotes a significant difference, p ≤ 0.05, by the Wilcoxon Rank Sum test. Sample 1 and Sample 2 depict images from two different patients in the group. The scale bar applies to all images in this figure.
Figure 6
Figure 6
Quantification of mast cells in periarticular knee tissue. Tissue density of CD117 + mast cells per mm2 in the overall tissue and in the fibrotic, adipose and synovium regions with representative images from the three groups (PTKA = primary TKA, RTKA-A = arthrofibrosis, RTKA-NA = non-arthrofibrosis). The graphs depict mean mast cell density (CD117 + cell/mm2) ± standard deviation, with each data point representing one patient. Two asterisks denote a significant difference, p ≤ 0.01, by the Wilcoxon Rank Sum test. Sample 1 and Sample 2 depict images from two different patients in the group. The scale bar applies to all images in this figure.
Figure 7
Figure 7
Quantification of T-cells cells in periarticular knee tissue. Tissue density of CD3 + T-cells per mm2 in the overall tissue and in the fibrotic, adipose and synovium regions with representative images from the three groups (PTKA = primary TKA, RTKA-A = arthrofibrosis, RTKA-NA = non-arthrofibrosis). The graphs depict mean T-cell density (CD3 + cell/mm2) ± standard deviation, with each data point representing one patient. The scale bar applies to all images in this figure.
Figure 8
Figure 8
Quantification of B-cells cells in periarticular knee tissue. Tissue density of CD20 + B-cells per mm2 in the whole tissue and in the fibrotic, adipose and synovium regions with representative images from the three groups (PTKA = primary TKA, RTKA-A = arthrofibrosis, RTKA-NA = non-arthrofibrosis). The graphs depict mean B-cells density (CD20 + cell/mm2) ± standard deviation, with each data point representing one patient. The scale bar applies to all images in this figure.
Figure 9
Figure 9
Correlation between immune cell numbers and gene expression in periarticular knee tissue. Tissue density of CD117 + mast cells (A), CD163 + macrophages (B), CD3 + T-cells (C), and CD20 + B-cells (D) in whole tissues in relationship to mRNA expression levels of the corresponding genes as assessed by RNA-Seq analysis from bulk tissue. The graphs depict mean cells densities (# of cells/mm2) ± standard deviation and mean gene expression (FPKM) ± standard deviation, with each data point representing one patient.

References

    1. Tibbo ME, et al. Acquired idiopathic stiffness after total knee arthroplasty: A systematic review and meta-analysis. J. Bone Joint Surg. Am. 2019;101:1320–1330. doi: 10.2106/jbjs.18.01217. - DOI - PMC - PubMed
    1. Cheuy VA, et al. Arthrofibrosis associated with total knee arthroplasty. J. Arthroplast. 2017;32:2604–2611. doi: 10.1016/j.arth.2017.02.005. - DOI - PubMed
    1. Thompson R, et al. Arthrofibrosis after total knee arthroplasty: Pathophysiology, diagnosis and management. Orthop. Clin. North Am. 2019;50:269–279. doi: 10.1016/j.ocl.2019.02.005. - DOI - PubMed
    1. Gwam CU, et al. Use of neuromuscular electrical stimulation during physical therapy may reduce the incidence of arthrofibrosis after total knee arthroplasty. Surg. Technol. Int. 2018;32:356–360. - PubMed
    1. Kornuijt A, Das D, Sijbesma T, de Vries L, van der Weegen W. Manipulation under anesthesia following total knee arthroplasty: A comprehensive review of literature. Musculoskelet. Surg. 2018;102:223–230. doi: 10.1007/s12306-018-0537-9. - DOI - PubMed

Publication types

MeSH terms