. 2023 Feb;20(2):229-238.
doi: 10.1038/s41592-022-01687-w. Epub 2022 Dec 31.

Nonnegative spatial factorization applied to spatial genomics

Affiliations

Nonnegative spatial factorization applied to spatial genomics

F William Townes et al. Nat Methods. 2023 Feb.

Abstract

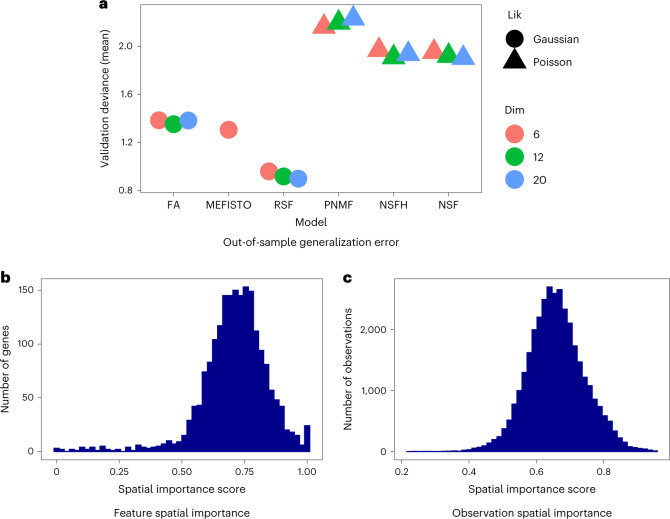
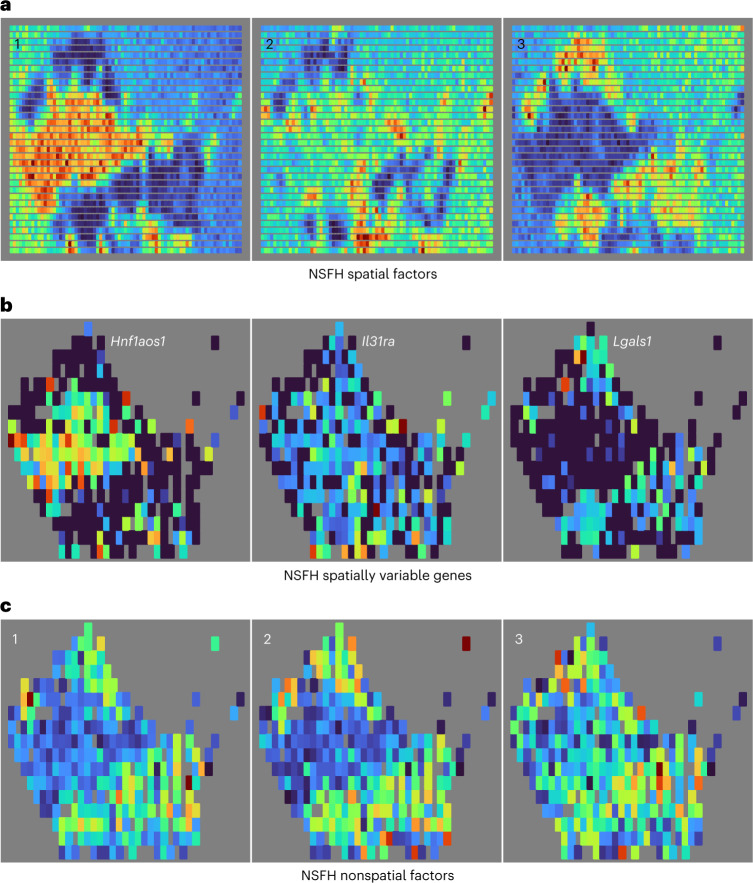
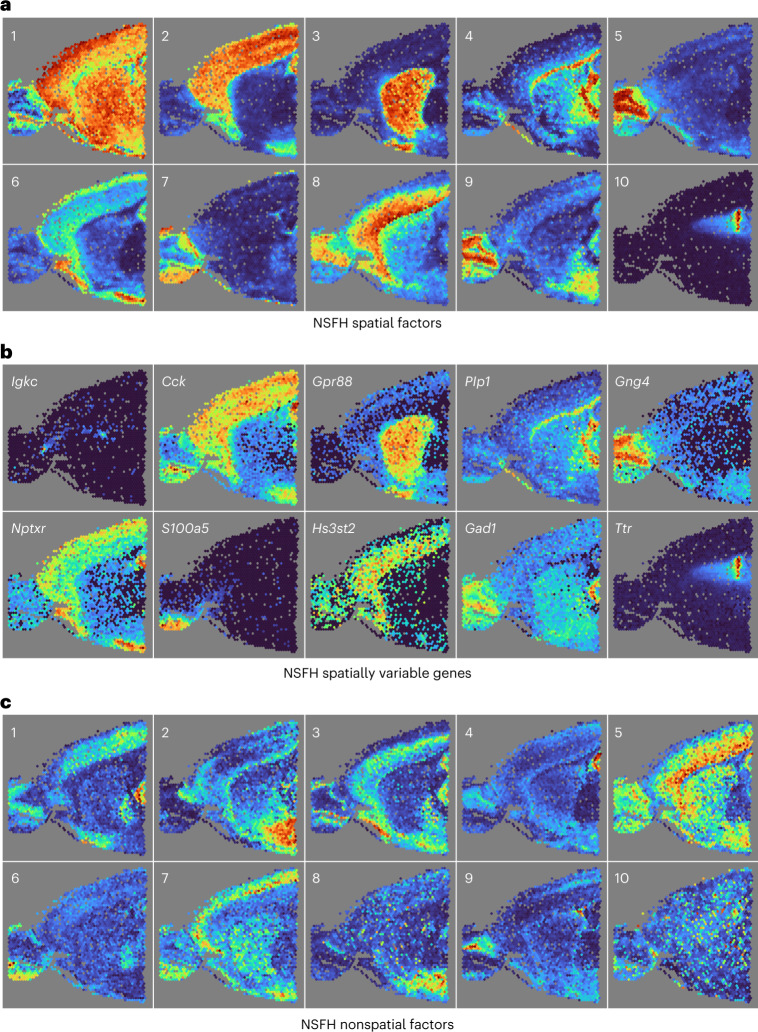
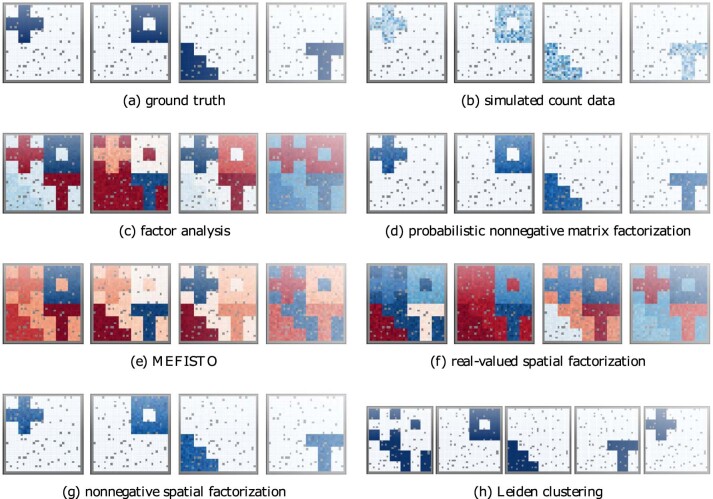
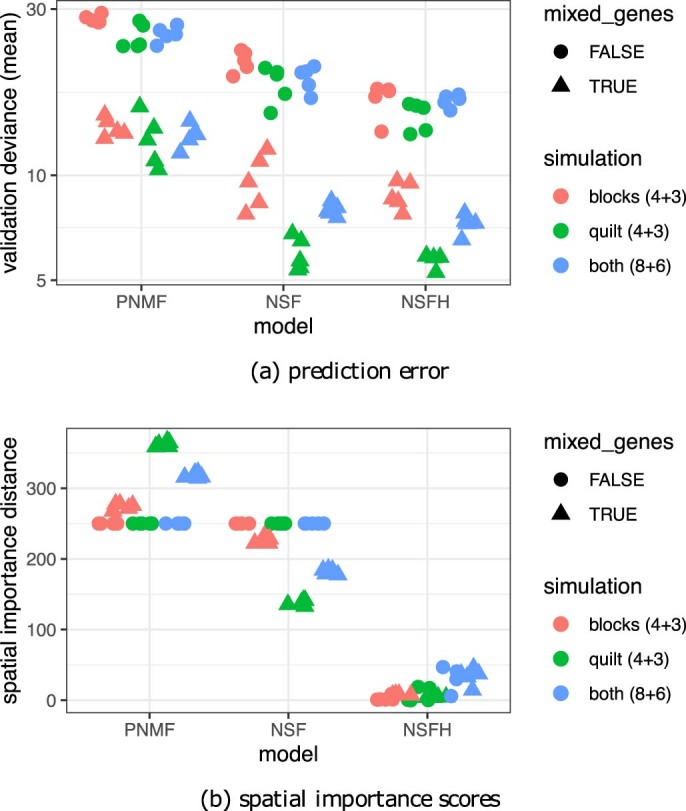
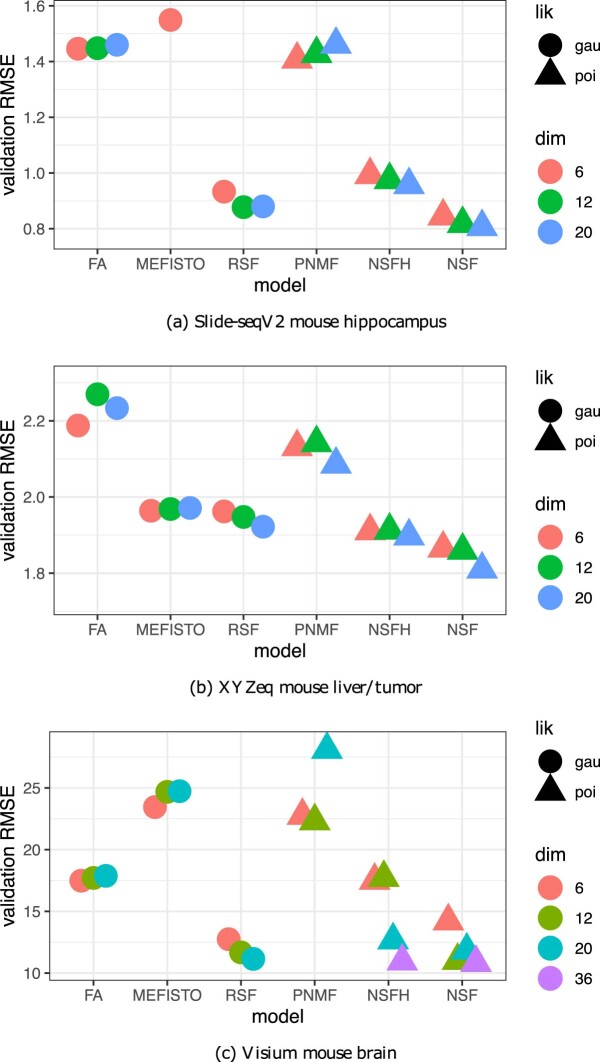
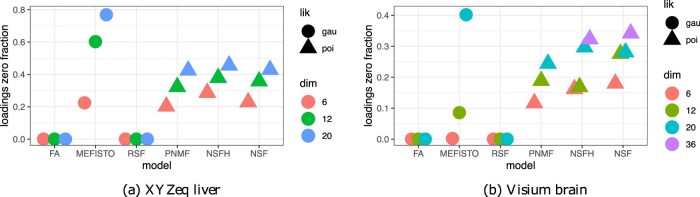
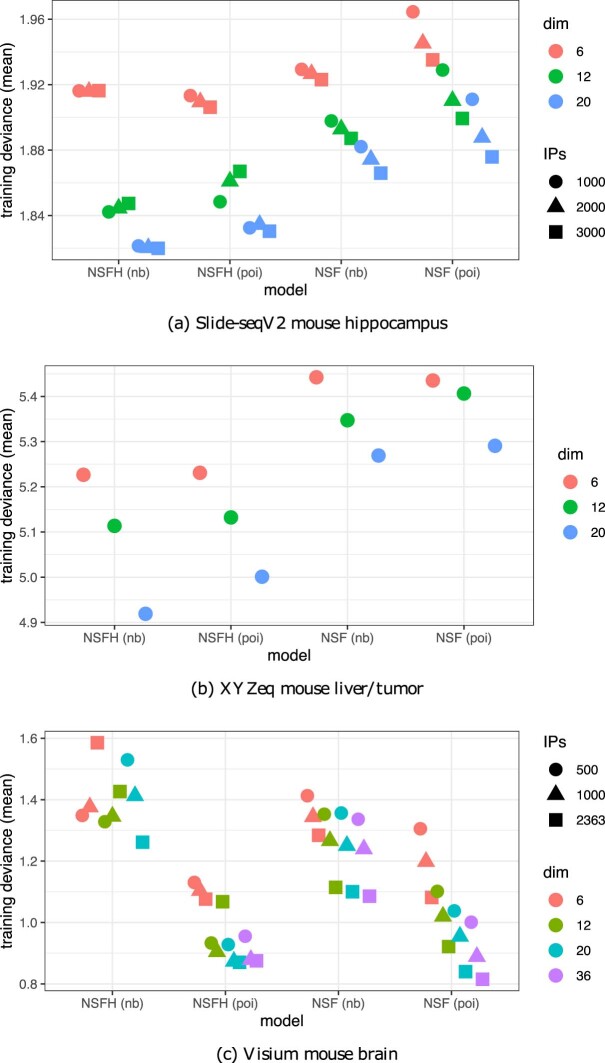
Nonnegative matrix factorization (NMF) is widely used to analyze high-dimensional count data because, in contrast to real-valued alternatives such as factor analysis, it produces an interpretable parts-based representation. However, in applications such as spatial transcriptomics, NMF fails to incorporate known structure between observations. Here, we present nonnegative spatial factorization (NSF), a spatially-aware probabilistic dimension reduction model based on transformed Gaussian processes that naturally encourages sparsity and scales to tens of thousands of observations. NSF recovers ground truth factors more accurately than real-valued alternatives such as MEFISTO in simulations, and has lower out-of-sample prediction error than probabilistic NMF on three spatial transcriptomics datasets from mouse brain and liver. Since not all patterns of gene expression have spatial correlations, we also propose a hybrid extension of NSF that combines spatial and nonspatial components, enabling quantification of spatial importance for both observations and features. A TensorFlow implementation of NSF is available from https://github.com/willtownes/nsf-paper .


Conflict of interest statement

B.E.E. is on the SAB for Creyon Bio, ArrePath and Freenome. B. E. E. consults for Neumora and Cellarity. The remaining author declares no competing interests.

Figures

Fig. 1
Fig. 1. Nonnegative factorizations recover a parts-based representation in ‘quilt’ simulated multivariate spatial count data.
a, Each of 200 features was randomly assigned to one of four nonnegative spatial factors. b, Negative binomial count data used for model fitting. c, Real-valued factors learned from unsupervised (nonspatial) dimension reduction. d, As c but using nonnegative components. e, Real-valued, spatially aware factors with EQ kernel. f, As e but with a Matérn kernel and without a sparsity-inducing prior. g, Nonnegative, spatially-aware factors. h, Unsupervised clustering of observations. Spatial models used all observations as IPs. Gray indicates observations held out for validation.
Fig. 2
Fig. 2. Benchmarking spatial and nonspatial factor models on Slide-seqV2 mouse hippocampus spatial gene expression data.
a, Poisson deviance on held-out validation data. Lower deviance indicates better generalization accuracy. All spatial models used 2,000 IPs. MEFISTO could not be fit with more than six components due to out of memory errors. Lik represents likelihood, and Dim represents the number of latent dimensions (components). b, Each feature (gene) was assigned a spatial importance score derived from NSFH fit with 20 components (ten spatial and ten nonspatial). A score of 1 indicates spatial components explain all the variation. c, As b but with observations instead of features.
Fig. 3
Fig. 3. NSFH combines spatial and nonspatial factors in Slide-seqV2 mouse hippocampus gene expression data.
FOV is a coronal section with left indicating the medial direction and right the lateral direction. a, Heatmap (red, high and blue, low) of square-root transformed posterior mean of ten spatial factors mapped into the (x, y) coordinate space. b, As a but mapping expression levels of top genes with strongest enrichment to each spatial component. c, As a but mapping ten nonspatial factors from the same model.
Fig. 4
Fig. 4. NSFH model combines spatial and nonspatial factors in XYZeq mouse liver gene expression data.
a, Heatmap (red, high and blue, low) of square-root transformed posterior mean of three spatial factors mapped into the (x, y) coordinate space. b, As a but mapping expression levels of top genes with strongest enrichment to each spatial component. c, As a but mapping three nonspatial factors from the same model.
Fig. 5
Fig. 5. Benchmarking spatial and nonspatial factor models on Visium mouse brain gene expression data.
a, Lower deviance indicates better generalization accuracy. b, Each feature (gene) was assigned a spatial importance score derived from NSFH fit with 20 components (ten spatial and ten nonspatial). A score of 1 indicates spatial components explain all the variation. c, As b but with observations instead of features. All spatial models used 2,363 IPs. Lik represents likelihood, and Dim represents the number of latent dimensions (components).
Fig. 6
Fig. 6. NSFH model combines spatial and nonspatial factors in Visium mouse brain gene expression data.
FOV is a sagittal section with left indicating the anterior direction and right the posterior direction. a, Heatmap (red represents high, and blue represents low) of square-root transformed posterior mean of ten spatial factors mapped into the (x, y) coordinate space. b, As a but mapping expression levels of top genes with strongest enrichment to each spatial component. c, As a but mapping ten nonspatial factors from the same model.
Extended Data Fig. 1
Extended Data Fig. 1. Nonnegative factorizations recover a parts-based representation in "ggblocks” simulated multivariate spatial count data.
(a) Each of 200 features was randomly assigned to one of four nonnegative spatial factors. (b) Negative binomial count data used for model fitting. (c) Real-valued factors learned from unsu- pervised (nonspatial) dimension reduction. (d) as (c) but using nonnegative components. (e) Real-valued, spatially aware factors with exponentiated quadratic (EQ) kernel. (f) as (e) but with Matern kernel and without sparsity-inducing prior. (g) Nonnegative, spatially-aware factors. (h) Unsupervised clustering of observations. Spatial models used all observations as inducing points. Gray indicates observations held out for validation.
Extended Data Fig. 2
Extended Data Fig. 2. Benchmarking spatial and nonspatial factor models on simulation scenario I.
(a) Nonnegative models PNMF and NSF closely matched ground truth. Each true factor was aligned by Pearson correlation to the closest matching factor in each fitted model and the minimum correlation across all factors was computed for each model and simulation replicate. Higher minimum correlations indicate more accurate models. (b) as (a) but using correlations between loadings matrices. (c) Spatially-aware models NSF and RSF had best prediction accuracy (lowest Poisson deviance) on held-out validation data. FA: factor analysis, RSF: real-valued spatial factorization, PNMF: probabilistic nonnegative matrix factorization, NSF: nonnegative spatial factorization. Spatial models used all observations as inducing points.
Extended Data Fig. 3
Extended Data Fig. 3. Benchmarking spatial, nonspatial, and hybrid factor models on simulation scenario II.
(a) Nonnegative spatial factorization hybrid (NSFH) model has highest generalization accuracy (lowest Poisson deviance prediction error) compared to purely nonspatial probabilistic nonnegative matrix factorization (PNMF) and or nonnegative spatial factorization (NSF). (b) NSFH spatial importance scores per feature are closest to scores computed from ground truth loadings. Spatial models used all observations as inducing points. Mixed genes is true for simulations where features have loadings on both spatial and nonspatial components. When mixed genes is false, a feature is assigned to be either strictly spatial or strictly nonspatial.
Extended Data Fig. 4
Extended Data Fig. 4. Comparison of predictive performance of spatial and nonspatial factor models on real datasets.
RMSE: root mean squared error on held-out observations, dim: number of latent dimensions or components, FA: factor analysis, RSF: real-valued spatial factorization, PNMF: probabilistic nonnegative matrix factorization, NSF: nonnegative spatial factorization, NSFH: NSF hybrid model, lik: likelihood, gau: Gaussian, poi: Poisson.
Extended Data Fig. 5
Extended Data Fig. 5. Benchmarking spatial and nonspatial factor models on Slide-seqV2 mouse hippocampus gene expression data.
FA: factor analysis, RSF: real-valued spatial factorization, PNMF: probabilistic nonnegative matrix factorization, NSF: nonnegative spatial factorization, NSFH: NSF hybrid model, lik: likelihood, gau: Gaussian, poi: Poisson, nb: negative binomial. (a) Sparsity of loadings matrix increases with larger numbers of components (dim) in nonnegative models PNMF, NSFH, and NSF. (b) Nonnegative spatial models NSF and NSFH converge faster than MEFISTO but not as fast as nonspatial models FA and PNMF. (c) Negative binomial and Poisson likelihoods provide similar generalization accuracy (lower deviance) in nonnegative models. (d) Negative binomial likelihood is more computationally expensive than Poisson likelihood in nonnegative models.
Extended Data Fig. 6
Extended Data Fig. 6. Sparsity of loadings matrices.
Sparsity increases with larger numbers of components (dim) in nonnegative models PNMF, NSFH, and NSF as well as real-valued model MEFISTO. (a) XYZeq mouse liver/tumor dataset. (b) Visium brain dataset.
Extended Data Fig. 7
Extended Data Fig. 7. Goodness-of-fit of nonnegative spatial factorization (NSF) and NSF hybrid model (NSFH) to real datasets.
Lower deviance indicates better fit to training data. dim: number of latent dimensions or components, IPs: number of inducing points, lik: likelihood, poi: Poisson, nb: negative binomial. For XYZeq, all 288 unique spatial locations were used as IPs.
Extended Data Fig. 8
Extended Data Fig. 8. Benchmarking number of inducing points (IPs) in spatial factor models on Slide-seqV2 mouse hippocampus gene expression data.
RSF: real-valued spatial factorization, NSF: nonnegative spatial factorization, NSFH: NSF hybrid model, dim: number of latent dimensions or components, gau: Gaussian, poi: Poisson, nb: negative binomial. (a) Goodness of fit increases (training deviance decreases) for increasing number of IPs in spatial models RSF and NSF with larger numbers of components. (b) No clear effect of number of IPs on predictive accuracy (validation deviance). (c) Higher numbers of IPs are more computationally expensive (time to convergence).
Extended Data Fig. 9
Extended Data Fig. 9. Autocorrelation of spatial and nonspatial factors.
All spatial transcriptomics datasets were analyzed with the nonnegative spatial factorization hybrid model (NSFH). Blue indicates spatial factors and red indicates nonspatial factors.
Extended Data Fig. 10
Extended Data Fig. 10. Benchmarking spatial and nonspatial factor models on XYZeq mouse liver gene expression data.
(a) Lower deviance indicates higher generalization accuracy. All spatial models used 288 inducing points. lik: likelihood, dim: number of latent dimensions (components), FA: factor analysis, RSF: real-valued spatial factorization, PNMF: probabilistic nonnegative matrix factorization, NSF: nonnegative spatial factorization, NSFH: NSF hybrid model. (b) Each feature (gene) was assigned a spatial importance score derived from NSFH fit with 6 components (3 spatial and 3 nonspatial). A score of 1 indicates spatial components explain all the variation. (c) as (b) but with observations instead of features.

Comment in

References

    1. Editors. Method of the year 2020: spatially resolved transcriptomics. Nat. Methods18, 1 (2021). - PubMed
    1. Bartholomew, D. J., Knott, M. & Moustaki, I. Latent Variable Models and Factor Analysis: A Unified Approach (John Wiley & Sons, 2011).
    1. Velten, B. et al. Identifying temporal and spatial patterns of variation from multimodal data using MEFISTO. Nat. Methods19, 179–186 (2022). - PMC - PubMed
    1. Rasmussen, C. E. & Williams, C. K. I. Gaussian Processes for Machine Learning (MIT Press, 2005).
    1. Banerjee, S., Carlin, B. P. & Gelfand, A. E. Hierarchical Modeling and Analysis for Spatial Data (CRC Press, 2014).

Publication types