. 2023 Apr;17(4):611-628.
doi: 10.1002/1878-0261.13373. Epub 2023 Jan 21.

Single-cell and spatial analyses reveal the association between gene expression of glutamine synthetase with the immunosuppressive phenotype of APOE+CTSZ+TAM in cancers

Affiliations

Single-cell and spatial analyses reveal the association between gene expression of glutamine synthetase with the immunosuppressive phenotype of APOE+CTSZ+TAM in cancers

Jinfen Wei et al. Mol Oncol. 2023 Apr.

Abstract

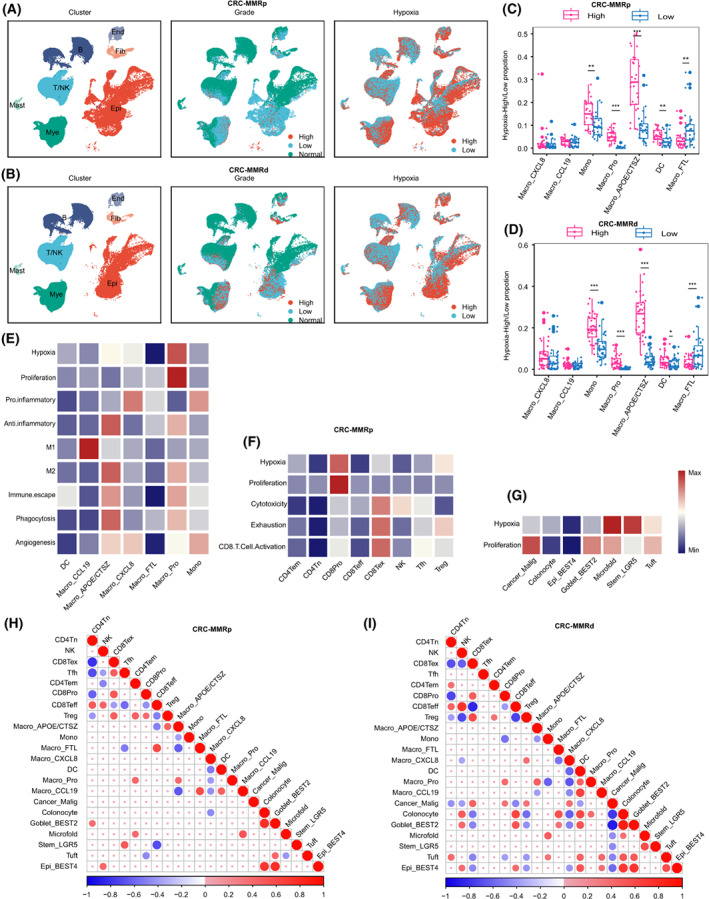
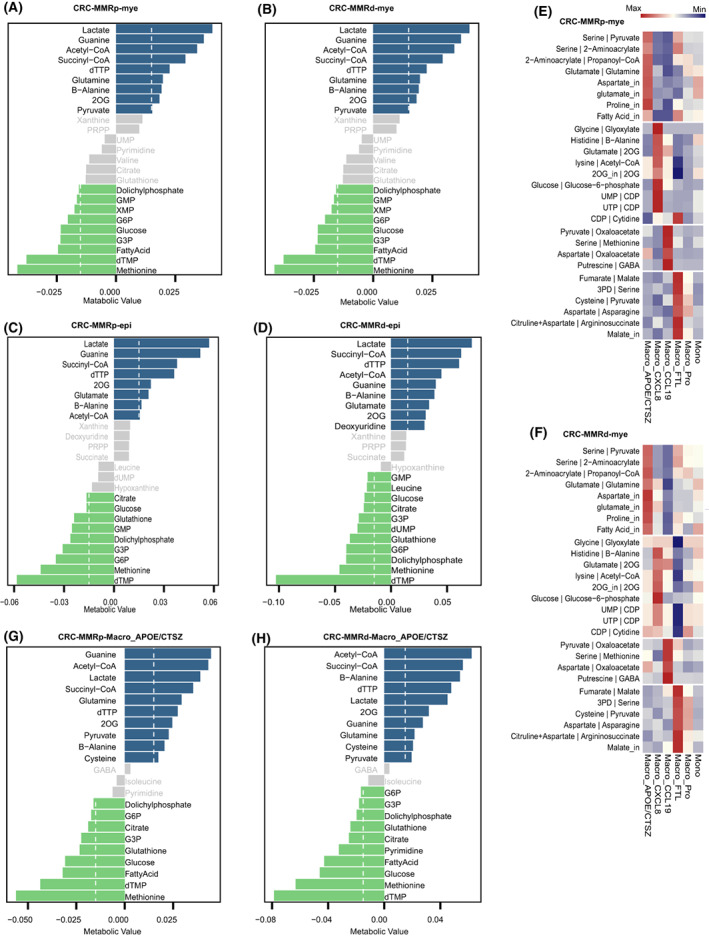
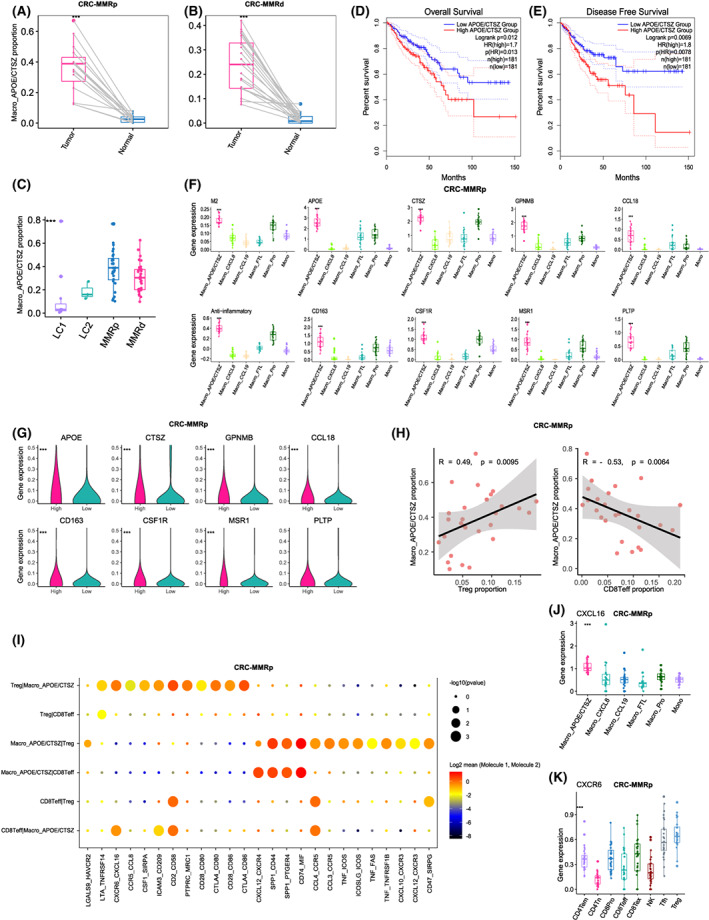
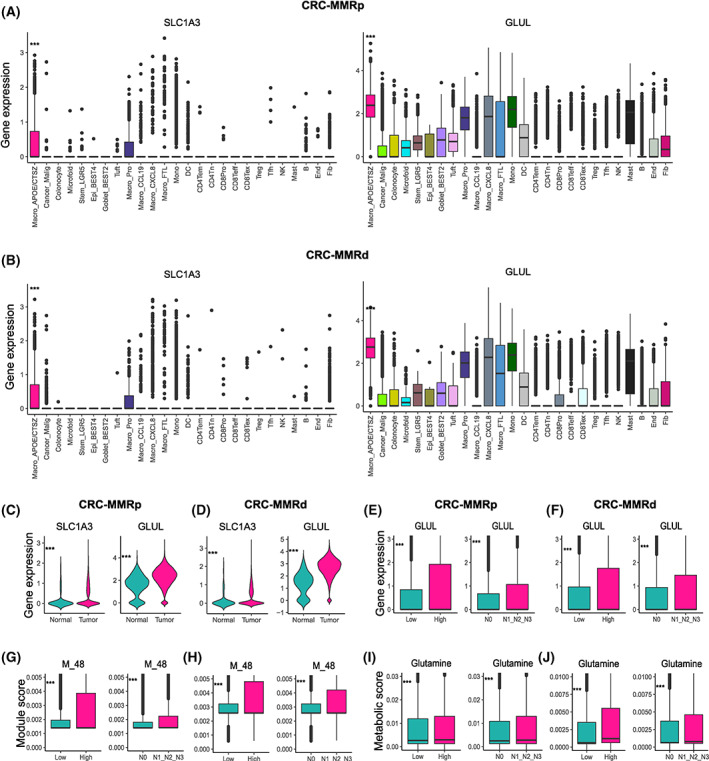
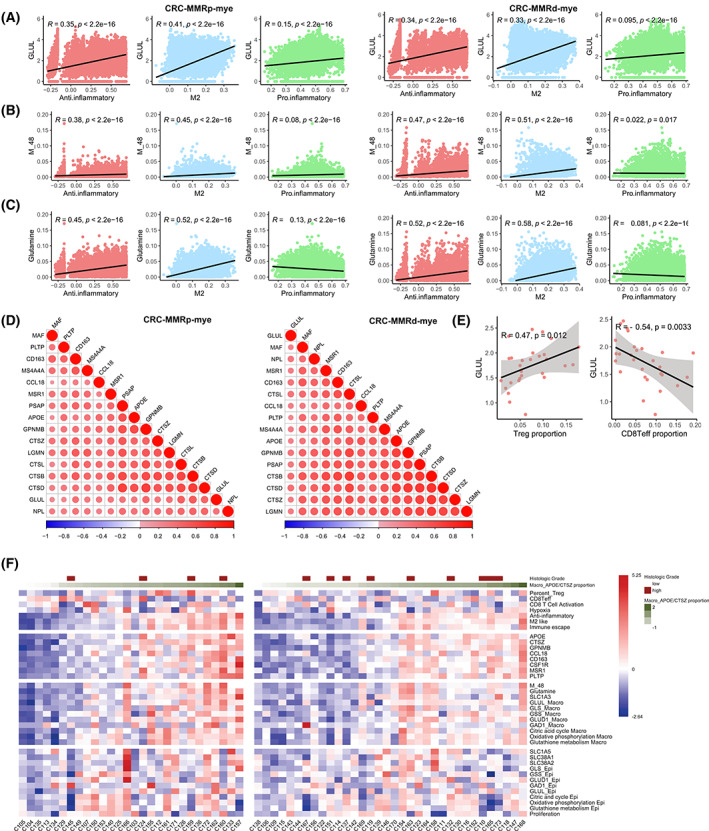
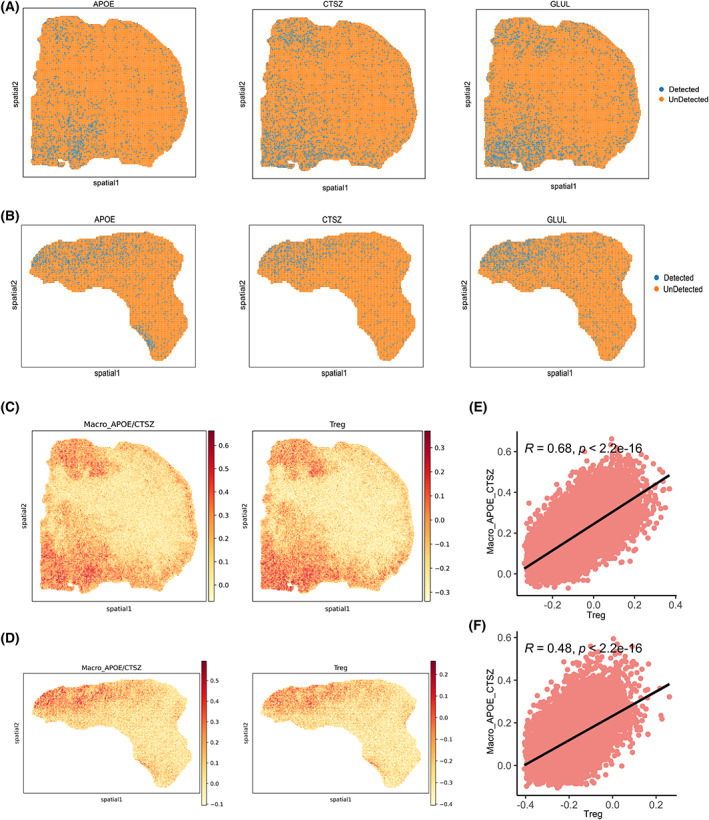
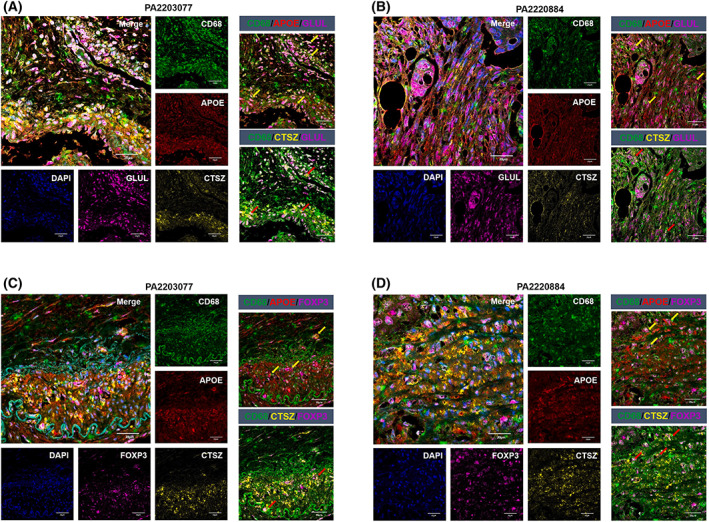
An immunosuppressive state is regulated by various factors in the tumor microenvironment (TME), including, but not limited to, metabolic plasticity of immunosuppressive cells and cytokines secreted by these cells. We used single-cell RNA-sequencing (scRNA-seq) data and applied single-cell flux estimation analysis to characterize the link between metabolism and cellular function within the hypoxic TME of colorectal (CRC) and lung cancer. In terms of metabolic heterogeneity, we found myeloid cells potentially inclined to accumulate glutamine but tumor cells inclined to accumulate glutamate. In particular, we uncovered a tumor-associated macrophage (TAM) subpopulation, APOE+CTSZ+TAM, that was present in high proportions in tumor samples and exhibited immunosuppressive characteristics through upregulating the expression of anti-inflammatory genes. The proportion of APOE+CTSZ+TAM and regulatory T cells (Treg) were positively correlated across CRC scRNA-seq samples. APOE+CTSZ+TAM potentially interacted with Treg via CXCL16-CCR6 signals, as seen by ligand-receptor interactions analysis. Notably, glutamate-to-glutamine metabolic flux score and glutamine synthetase (GLUL) expression were uniquely higher in APOE+CTSZ+TAM, compared with other cell types within the TME. GLUL expression in macrophages was positively correlated with anti-inflammatory score and was higher in high-grade and invasive tumor samples. Moreover, spatial transcriptome and multiplex immunofluorescence staining of samples showed that APOE+CTSZ+TAM and Treg potentially colocalized in the tissue sections from CRC clinical samples. These results highlight the specific role and metabolic characteristic of the APOE+CTSZ+TAM subpopulation and provide a new perspective for macrophage subcluster-targeted therapeutic interventions or metabolic checkpoint-based cancer therapies.

Keywords: GLUL; colorectal cancer; immunosuppressive microenvironment; metabolism; single-cell and spatial RNA-seq; tumor-associated macrophages.


Conflict of interest statement

The authors declare no conflict of interest.

Figures

Fig. 1
Fig. 1
Single‐cell atlas of human CRC tissues. (A) UMAP plots of cells from normal and tumor tissue of 28 CRC‐MMRp patients, showing seven clusters indicating cell type, three clusters indicating tumor staging information, and two clusters indicating hypoxia‐high and ‐low group cells. Each cluster was shown in different colors. (B) The same as shown in A but in 34 CRC‐MMRd patients. (C, D) Cell proportion in hypoxia‐high and ‐low groups of each cell type in CRC‐MMRp (C) and CRC‐MMRd (D). **P < 0.01, ***P < 0.001, paired two‐sided Wilcoxon test. The mean cell proportion is marked in the bar graph and vertical lines indicate the maximum and minimum values of the cell proportion. (E–G) Heatmap showing different expression patterns of cell function‐associated gene signatures among myeloid cell subsets (E), in T/NK cells (F), and in epithelial cells (G). (H, I) Correlation map showing the correlation between cellular proportion with positive (Spearman correlation; correlation coefficient r > 0.3 and FDR < 0.05, in red), negative (r < −0.3 and FDR < 0.05, in blue), or nonsignificant (blank) correlation for the infiltration of pairwise 22 cell types in 28 independent CRC‐MMRp samples (H) and 24 CRC‐MMRd samples (I). MMRd, mismatch repair deficient; MMRp, mismatch repair proficient; Mono, monocyte; DC, dendritic cell; NK, natural killer; Tfh, follicular helper T cell; Mye, myeloid cells; Epi, epithelial cells.
Fig. 2
Fig. 2
The metabolic characteristics across single cells. (A, B) Top accumulated and depleted metabolites predicted in the myeloid cells in CRC‐MMRp samples (A) and CRC‐MMRd samples (B). The x‐axis is metabolism stress level, where a positive value represents accumulation and a negative value represents depletion. (C, D) Top accumulated and depleted metabolites predicted in the epithelial cells in CRC‐MMRp samples (C) and CRC‐MMRd samples (D). (E, F) Distribution of predicted cell‐wise flux of metabolism in the subtypes of myeloid cells in CRC‐MMRp samples (E) and CRC‐MMRd samples (F). (G, H) Top accumulated and depleted metabolites predicted in the APOE+CTSZ+TAM in CRC‐MMRp samples (G) and CRC‐MMRd samples (H). The dashed line in A–D, G, and H shows the value of accumulated or depleted metabolites equaling 0.015. The values less than this value are gray bars.
Fig. 3
Fig. 3
The immunosuppressive function of APOE+CTSZ+TAM. (A, B) Comparison of APOE+CTSZ+TAM percentages in paired normal (n = 12) and tumor (n = 12) tissue of CRC‐MMRp (A) and CRC‐MMRd samples (B). ***P < 0.001, paired two‐sided Wilcoxon test. (C) Boxplot showing the proportion of APOE+CTSZ+TAM divided by the total macrophage number across CRC and LC samples. The mean cell proportion is marked in the bar graph and vertical lines indicate the maximum and minimum value of the cell proportion. (D) The Kaplan–Meier curve shows overall survival of COADREAD patients with different APOE+CTSZ+TAM infiltration. (E) The Kaplan–Meier curve shows disease‐free survival of COADREAD patients with different APOE+CTSZ+TAM infiltration. (F) Boxplot showing the different expressions of marker genes of APOE+CTSZ+TAM and M2 as well as anti‐inflammatory score among myeloid cells in CRC‐MMRp samples. ***P < 0.001, Kruskal–Wallis test. (G) Violin plots showing the different expressions of marker genes of APOE+CTSZ+TAM between low‐ and high‐grade samples in CRC‐MMRp samples. ***P < 0.001, paired two‐sided Wilcoxon test. (H) Scatterplot showing the Spearman correlation of the proportion of APOE+CTSZ+TAM (divided by the total macrophage number) and Treg cells or CD8+ Teff cells (divided by the total T/NK cell number) in tumor tissues of CRC‐MMRp samples. (I) Bubble chart showing the top predicated ligands expression in APOE+CTSZ+TAM that modulate Tregs by CellPhoneDB. (J) Boxplot showing the different expressions of CXCL16 among myeloid cell subclusters in CRC‐MMRp samples. ***P < 0.001, Kruskal–Wallis test. (K) Boxplot showing the different expressions of CXCR6 among T‐cell subclusters in CRC‐MMRp samples. ***P < 0.001, Kruskal–Wallis test. The mean gene expression is marked in the bar graph and vertical lines indicate the maximum and minimum value of the gene expression.
Fig. 4
Fig. 4
APOE+CTSZ+TAM upregulated GLUL and glutamate‐to‐glutamine metabolic flux. (A, B) SLC1A3 and GLUL expression among cell subtypes in CRC‐MMRp samples (A) and CRC‐MMRd samples (B). ***P < 0.001, Kruskal–Wallis test. The mean gene expression is marked in the bar graph and vertical lines indicate the maximum and minimum values of the gene expression. (C, D) SLC1A3 and GLUL expression in macrophage divided from tumor and normal samples in CRC‐MMRp samples (n = 29 in tumor samples, n = 29 in normal samples) (C) and CRC‐MMRd samples (n = 35 in tumor samples, n = 35 in normal samples) (D). (E, F) GLUL expression among different histologic grade samples and node status in CRC‐MMRp samples (E) and CRC‐MMRd samples (F). (G, H) M_48 score among different histologic grade samples and node status in CRC‐MMRp samples (G) and CRC‐MMRd samples (H). (I, J) Glutamine accumulation value among different histologic grade samples and node status in CRC‐MMRp samples (I) and CRC‐MMRd samples (J). ***P < 0.001, unpaired one‐sided Wilcoxon test. CRC‐MMRp tumor sample (n = 29), CRC‐MMRd sample (n = 35), high‐grade CRC‐MMRp tumor sample (n = 4), low‐grade CRC‐MMRp tumor sample (n = 25), high‐grade CRC‐MMRd tumor sample (n = 9), low‐grade CRC‐MMRd tumor sample (n = 26), N0 CRC‐MMRp tumor sample (n = 12), N1&2&3‐grade CRC‐MMRp tumor sample (n = 17), N0 CRC‐MMRd tumor sample (n = 23), and N1&2&3‐grade CRC‐MMRd tumor sample (n = 12). Mono, monocyte; DC, dendritic cell; NK, natural killer; Tfh, follicular helper T cell; Fib, fibroblast; End, endothelial cell; B, B cell; Mye, myeloid cells; Epi, epithelial cells.
Fig. 5
Fig. 5
The relevance between metabolism and cell function in macrophages. (A–C) The correlation among GLUL expression (A), M_48 score (B), and glutamine accumulation value (C) with anti‐inflammatory, M2, and proinflammatory score in CRC‐MMRp samples and CRC‐MMRd samples. (D) The expression correlation between GLUL with genes in anti‐inflammatory in CRC‐MMRp samples and CRC‐MMRd samples. (E) Scatterplot showing the Spearman correlation of the GLUL gene expression and infiltration proportion of Treg or CD8+ T effector cells (divided by the total T/NK cell number) in tumor tissues of CRC‐MMRp samples. CRC‐MMRp tumor sample (n = 29) and CRC‐MMRd sample (n = 35). (F) Molecular characteristics of different cell types across samples in CRC‐MMRp (left) and CRC‐MMRd patients (right).
Fig. 6
Fig. 6
Colocalization of APOE+CTSZ+TAM with cells expressing GLUL as well as Treg revealed by spatial transcriptomics. (A, B) Spatial feature plots of gene expression of APOE, CTSZ, and GLUL in patients 19 (A) and 36 (B). (C, D) Spatial feature plots of signature score of APOE+CTSZ+TAM and Treg in tissue sections in patients 19 (C) and 36 (D). (E, F) Spearman correlation of signature score of APOE+CTSZ+TAM (y‐axis) and Treg (x‐axis) in patients 19 (E) and 36 (F).
Fig. 7
Fig. 7
Tissue and cellular distribution of APOE+CTSZ+TAM, GLUL+ cells, and Treg. (A, B) Multiplex immunofluorescence staining of CD68 (green), APOE (red), CTSZ (yellow), GLUL (purple), and DAPI (blue) on CRC tissue section of patient PA2203077 and patient PA2220884, scale bar 20 μm. Left: merged and single‐channel photo of the tissue section. Right: combined channel of CD68/APOE/GLUL and CD68/CTSZ/GLUL on the tissue section. (C, D) Multiplex immunofluorescence staining of CD68 (green), APOE (red), CTSZ (yellow), FOXP3 (purple), and DAPI (blue) on CRC tissue section of patient PA2203077 and patient PA2220884, scale bar 20 μm. Left: Merged and single‐channel photo of the tissue section. Right: Combined channel of CD68/APOE/FOXP3 and CD68/CTSZ/FOXP3 on the tissue section. Arrows indicate the representative regions with three immunofluorescence staining.

References

    1. Hung MH, Lee JS, Ma C, Diggs LP, Heinrich S, Chang CW, et al. Tumor methionine metabolism drives T‐cell exhaustion in hepatocellular carcinoma. Nat Commun. 2021;12:1455. - PMC - PubMed
    1. Bian Y, Li W, Kremer DM, Sajjakulnukit P, Li S, Crespo J, et al. Cancer SLC43A2 alters T cell methionine metabolism and histone methylation. Nature. 2020;585:277–82. - PMC - PubMed
    1. Bhandari V, Hoey C, Liu LY, Lalonde E, Ray J, Livingstone J, et al. Molecular landmarks of tumor hypoxia across cancer types. Nat Genet. 2019;51:308–18. - PubMed
    1. Ye Y, Hu Q, Chen H, Liang K, Yuan Y, Xiang Y, et al. Characterization of hypoxia‐associated molecular features to aid hypoxia‐targeted therapy. Nat Metab. 2019;1:431–44. - PMC - PubMed
    1. Multhoff G, Vaupel P. Hypoxia compromises anti‐cancer immune responses. Adv Exp Med Biol. 2020;1232:131–43. - PubMed

Publication types