

Gray matter microstructure differences in autistic males: A gray matter based spatial statistics study
- PMID: 36587584
- PMCID: PMC9817031
- DOI: 10.1016/j.nicl.2022.103306
Gray matter microstructure differences in autistic males: A gray matter based spatial statistics study
Abstract
Background: Autism spectrum disorder (ASD) is a complex neurodevelopmental condition. Understanding the brain's microstructure and its relationship to clinical characteristics is important to advance our understanding of the neural supports underlying ASD. In the current work, we implemented Gray-Matter Based Spatial Statistics (GBSS) to examine and characterize cortical microstructure and assess differences between typically developing (TD) and autistic males.
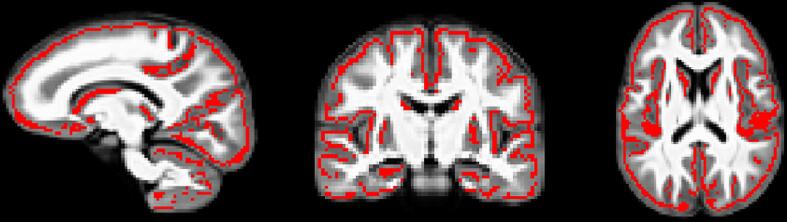
Methods: A multi-shell diffusion MRI (dMRI) protocol was acquired from 83 TD and 70 autistic males (5-to-21-years) and fit to the DTI and NODDI models. GBSS was performed for voxelwise analysis of cortical gray matter (GM). General linear models were used to investigate group differences, while age-by-group interactions assessed age-related differences between groups. Within the ASD group, relationships between cortical microstructure and measures of autistic symptoms were investigated.
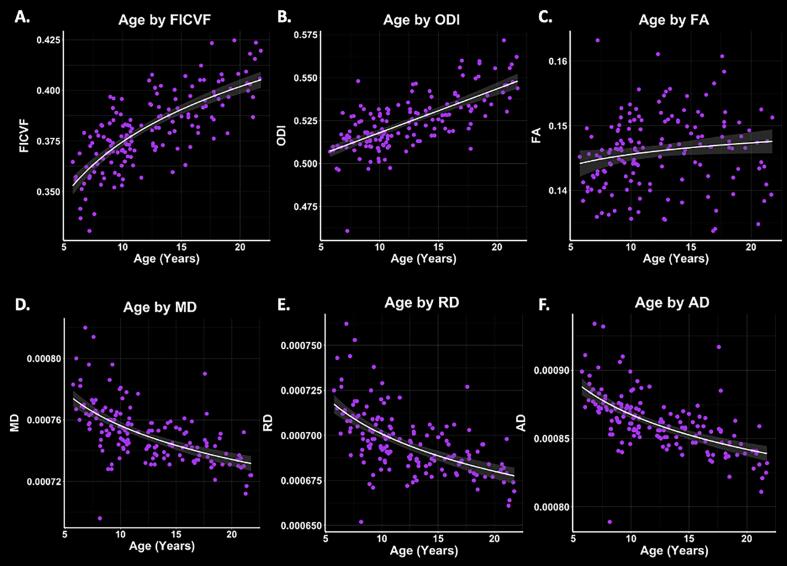
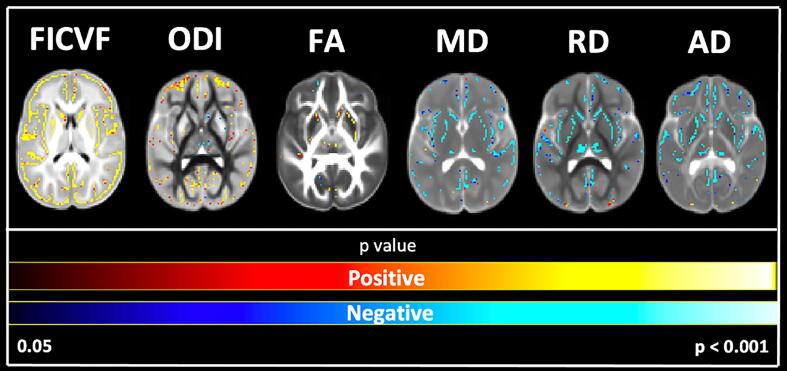
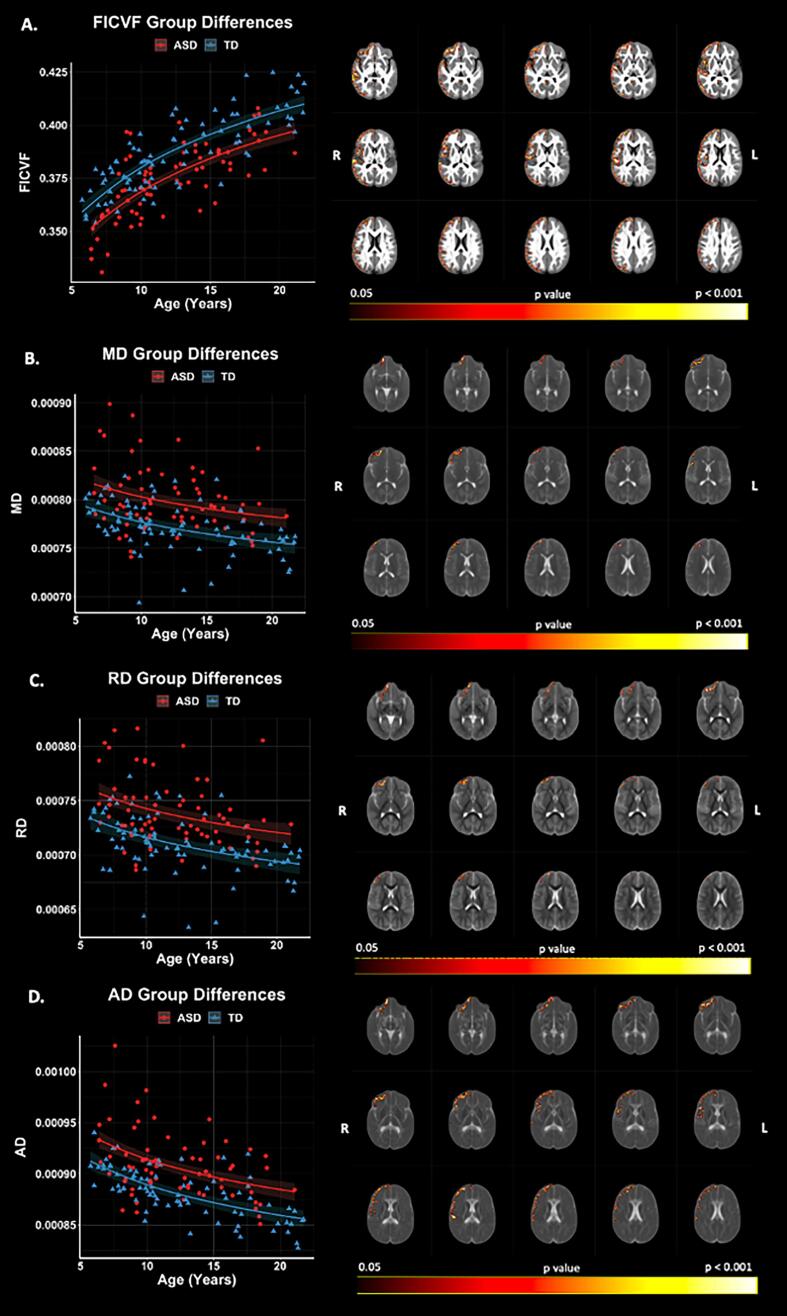
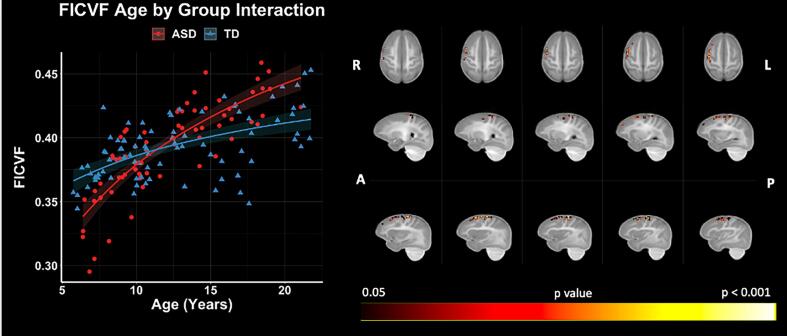
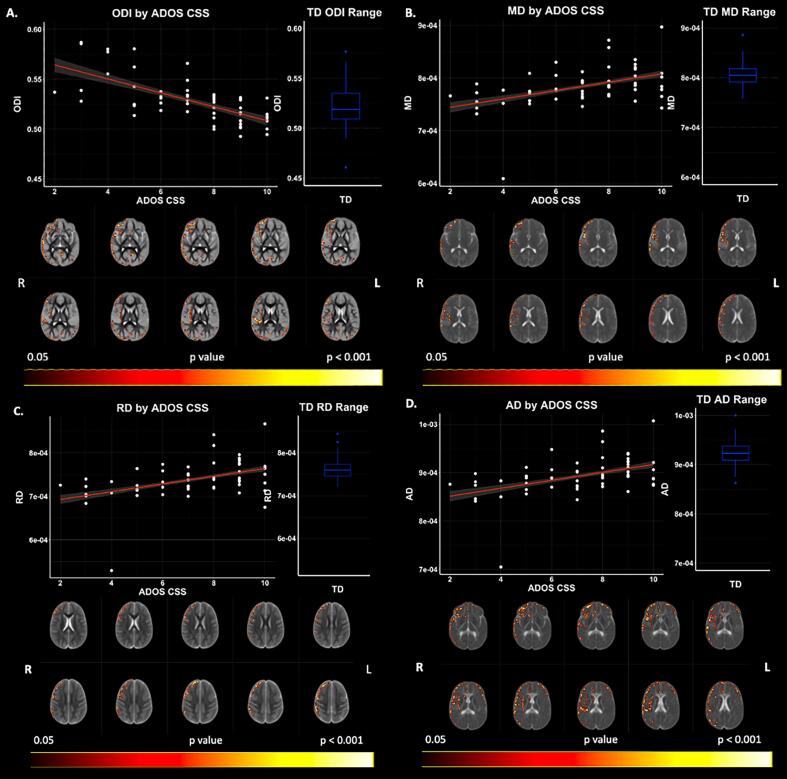
Results: All dMRI measures were significantly associated with age across the GM skeleton. Group differences and age-by-group interactions are reported. Group-wise increases in neurite density in autistic individuals were observed across frontal, temporal, and occipital regions of the right hemisphere. Significant age-by-group interactions of neurite density were observed within the middle frontal gyrus, precentral gyrus, and frontal pole. Negative relationships between neurite dispersion and the ADOS-2 Calibrated Severity Scores (CSS) were observed within the ASD group.
Discussion: Findings demonstrate group and age-related differences between groups in neurite density in ASD across right-hemisphere brain regions supporting cognitive processes. Results provide evidence of altered neurodevelopmental processes affecting GM microstructure in autistic males with implications for the role of cortical microstructure in the level of autistic symptoms.
Conclusion: Using dMRI and GBSS, our findings provide new insights into group and age-related differences of the GM microstructure in autistic males. Defining where and when these cortical GM differences arise will contribute to our understanding of brain-behavior relationships of ASD and may aid in the development and monitoring of targeted and individualized interventions.
Keywords: Adolescence; Autism; Childhood; DTI; GBSS; Gray matter microstructure; NODDI.
Copyright © 2022 The Authors. Published by Elsevier Inc. All rights reserved.
Conflict of interest statement
Declaration of Competing Interest The authors declare that they have no known competing financial interests or personal relationships that could have appeared to influence the work reported in this paper.
Figures
Similar articles
-
Tract- and gray matter- based spatial statistics show white matter and gray matter microstructural differences in autistic males.Front Neurosci. 2023 Sep 27;17:1231719. doi: 10.3389/fnins.2023.1231719. eCollection 2023. Front Neurosci. 2023. PMID: 37829720 Free PMC article.
-
Reduced neurite density index in the prefrontal cortex of adults with autism assessed using neurite orientation dispersion and density imaging.Front Neurol. 2023 Aug 11;14:1110883. doi: 10.3389/fneur.2023.1110883. eCollection 2023. Front Neurol. 2023. PMID: 37638188 Free PMC article.
-
Examining the Boundary Sharpness Coefficient as an Index of Cortical Microstructure in Autism Spectrum Disorder.Cereb Cortex. 2021 Jun 10;31(7):3338-3352. doi: 10.1093/cercor/bhab015. Cereb Cortex. 2021. PMID: 33693614 Free PMC article.
-
In Vivo Imaging of Gray Matter Microstructure in Major Psychiatric Disorders: Opportunities for Clinical Translation.Biol Psychiatry Cogn Neurosci Neuroimaging. 2020 Sep;5(9):855-864. doi: 10.1016/j.bpsc.2020.03.003. Epub 2020 Mar 25. Biol Psychiatry Cogn Neurosci Neuroimaging. 2020. PMID: 32381477 Review.
-
Atypical structural connectivity of language networks in autism spectrum disorder: A meta-analysis of diffusion tensor imaging studies.Autism Res. 2022 Sep;15(9):1585-1602. doi: 10.1002/aur.2789. Epub 2022 Aug 13. Autism Res. 2022. PMID: 35962721 Free PMC article. Review.
Cited by
-
Role of autonomic, nociceptive, and limbic brainstem nuclei in core autism features.Autism Res. 2024 Feb;17(2):266-279. doi: 10.1002/aur.3096. Epub 2024 Jan 26. Autism Res. 2024. PMID: 38278763 Free PMC article.
-
White matter microstructure as a potential contributor to differences in resting state alpha activity between neurotypical and autistic children: a longitudinal multimodal imaging study.Mol Autism. 2025 Mar 11;16(1):19. doi: 10.1186/s13229-025-00646-4. Mol Autism. 2025. PMID: 40069738 Free PMC article.
-
Gray matter based spatial statistics framework in the 1-month brain: insights into gray matter microstructure in infancy.Brain Struct Funct. 2024 Dec;229(9):2445-2459. doi: 10.1007/s00429-024-02853-w. Epub 2024 Sep 24. Brain Struct Funct. 2024. PMID: 39313671
-
Tract- and gray matter- based spatial statistics show white matter and gray matter microstructural differences in autistic males.Front Neurosci. 2023 Sep 27;17:1231719. doi: 10.3389/fnins.2023.1231719. eCollection 2023. Front Neurosci. 2023. PMID: 37829720 Free PMC article.
-
Reduced neurite density index in the prefrontal cortex of adults with autism assessed using neurite orientation dispersion and density imaging.Front Neurol. 2023 Aug 11;14:1110883. doi: 10.3389/fneur.2023.1110883. eCollection 2023. Front Neurol. 2023. PMID: 37638188 Free PMC article.
References
-
- Alexander D.C., Dyrby T.B., Nilsson M., Zhang H. Imaging brain microstructure with diffusion MRI: practicality and applications. NMR Biomed. 2019;32(4):e3841. - PubMed
-
- Alexander A.L., Hasan K.M., Lazar M., Tsuruda J.S., Parker D.L. Analysis of partial volume effects in diffusion-tensor MRI. Magn. Reson. Med. 2001;45(5):770–780. - PubMed
-
- Amaral D.G., Schumann C.M., Nordahl C.W. Neuroanatomy of autism. Trends Neurosci. 2008;31(3):137–145. - PubMed
-
- Ameis S.H., Catani M. Altered white matter connectivity as a neural substrate for social impairment in Autism Spectrum Disorder. Cortex. 2015;62:158–181. - PubMed
