

In Vivo Precision Evaluation of Lymphatic Function by SWIR Luminescence Imaging with PbS Quantum Dots
- PMID: 36587979
- PMCID: PMC9982568
- DOI: 10.1002/advs.202206579
In Vivo Precision Evaluation of Lymphatic Function by SWIR Luminescence Imaging with PbS Quantum Dots
Abstract
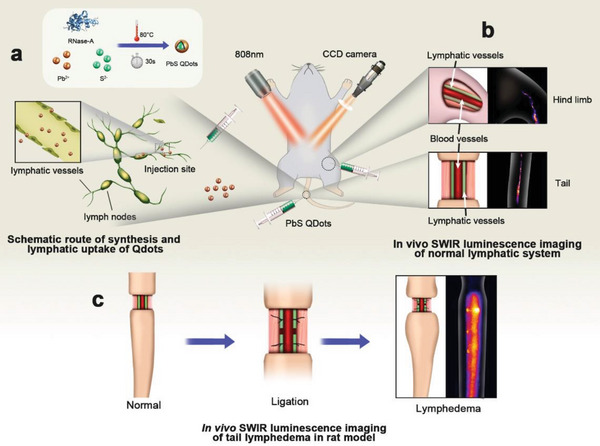
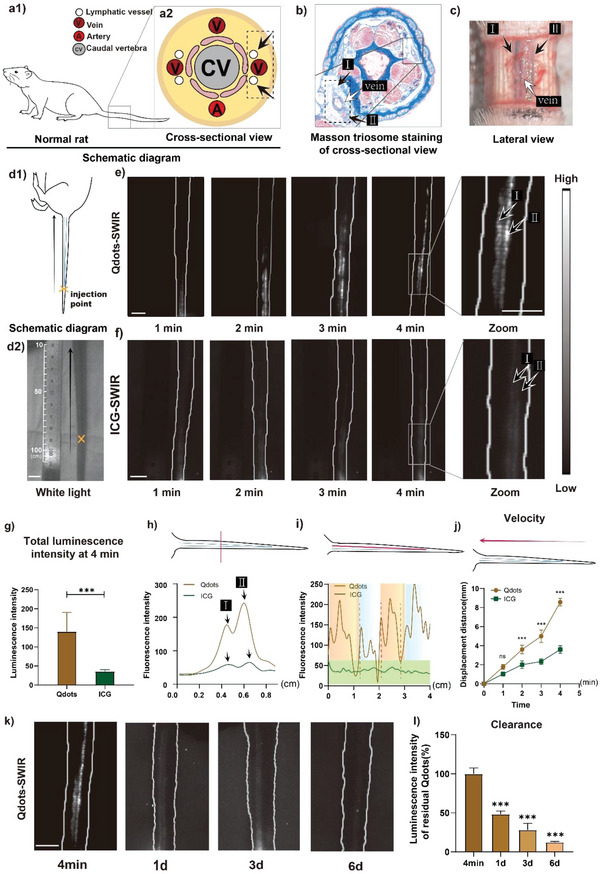
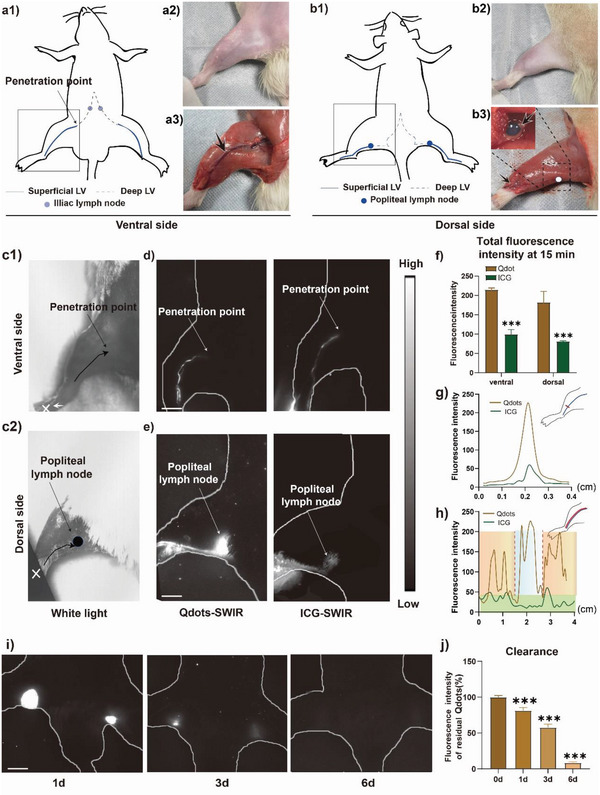
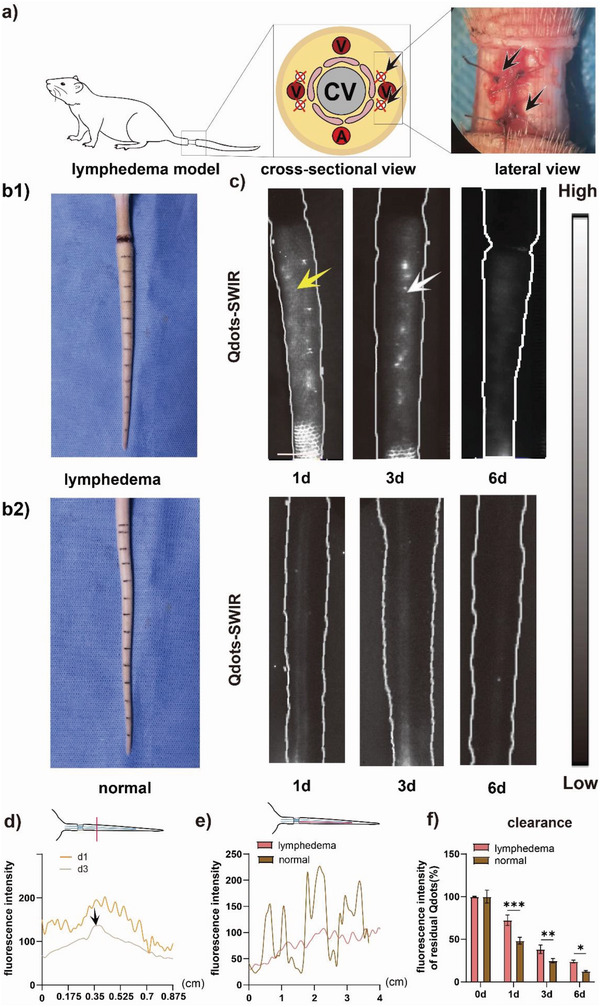
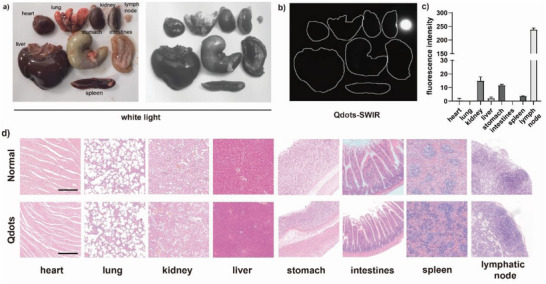
Advancements in lymphography technology are essential for comprehensive investigation of the lymphatic system and its function. Here, a shortwave infrared (SWIR) luminescence imaging of lymphatic vessels is proposed in both normal and lymphatic dysfunction in rat models with PbS quantum dots (PbS Qdots). The lymphography with PbS Qdots can clearly and rapidly demonstrate the normal lymphatic morphology in both the tail and hind limb. More importantly, compared to ICG, SWIR luminescence imaging with PbS Qdots can easily identify the dominant lymphatic vessel and node with higher luminescence signal in rats. Moreover, lymphatic pump is identified as segment contracting sections with a size of ≈1 cm in rat by in vivo SWIR lymphograhy, which propose a direct feature for precise evaluation of lymphatic function. Notably, in vivo SWIR luminescence imaging with PbS Qdots also clearly deciphers the in vivo pattern of morphological and function recovery from lymphatic system in rat model. In summary, SWIR luminescence imaging with PbS Qdots can improve the lymphography and thus deepen the understanding of the morphology and structure of the lymphatic system as well as lymphatic function such as lymphatic pump, which will facilitate the diagnosis of lymphatic dysfunction in the future.
Keywords: lymphatic function; lymphatic system; lymphography; shortwave infrared (SWIR).
© 2023 The Authors. Advanced Science published by Wiley-VCH GmbH.
Conflict of interest statement
The authors declare no conflict of interest.
Figures
Similar articles
-
Dynamic multispectral NIR/SWIR for in vivo lymphovascular architectural and functional quantification.J Biomed Opt. 2024 Oct;29(10):106001. doi: 10.1117/1.JBO.29.10.106001. Epub 2024 Sep 26. J Biomed Opt. 2024. PMID: 39347012 Free PMC article.
-
Multiplexed Shortwave Infrared Imaging Highlights Anatomical Structures in Mice.Angew Chem Int Ed Engl. 2024 Oct 21;63(43):e202410936. doi: 10.1002/anie.202410936. Epub 2024 Sep 12. Angew Chem Int Ed Engl. 2024. PMID: 39014295
-
Shortwave infrared fluorescence imaging with the clinically approved near-infrared dye indocyanine green.Proc Natl Acad Sci U S A. 2018 Apr 24;115(17):4465-4470. doi: 10.1073/pnas.1718917115. Epub 2018 Apr 6. Proc Natl Acad Sci U S A. 2018. PMID: 29626132 Free PMC article.
-
Current techniques for lymphatic imaging: State of the art and future perspectives.Eur J Surg Oncol. 2014 Mar;40(3):270-6. doi: 10.1016/j.ejso.2013.11.027. Epub 2013 Dec 14. Eur J Surg Oncol. 2014. PMID: 24368048 Review.
-
Non-contrast MR lymphography of the lymphatic system of the liver.Eur Radiol. 2019 Nov;29(11):5879-5888. doi: 10.1007/s00330-019-06151-6. Epub 2019 Apr 1. Eur Radiol. 2019. PMID: 30937582 Review.
Cited by
-
A Review of in vivo Toxicity of Quantum Dots in Animal Models.Int J Nanomedicine. 2023 Dec 29;18:8143-8168. doi: 10.2147/IJN.S434842. eCollection 2023. Int J Nanomedicine. 2023. PMID: 38170122 Free PMC article. Review.
-
Visualizing spatiotemporal pattern of vascularization by SWIR fluorescence imaging in a mouse model of perforator flap transplantation.J Nanobiotechnology. 2025 Feb 26;23(1):145. doi: 10.1186/s12951-025-03137-z. J Nanobiotechnology. 2025. PMID: 40001228 Free PMC article.
-
In vivo dynamic visualization and evaluation of collagen degradation utilizing NIR-II fluorescence imaging in mice models.Regen Biomater. 2025 Apr 11;12:rbaf025. doi: 10.1093/rb/rbaf025. eCollection 2025. Regen Biomater. 2025. PMID: 40405872 Free PMC article.
References
Publication types
MeSH terms
Grants and funding
- 2021YFA1201303/National Key R&D Program of China
- 82172222/National Natural Science Foundation of China
- 81772339/National Natural Science Foundation of China
- 82172511/National Natural Science Foundation of China
- 81972121/National Natural Science Foundation of China
- 81972129/National Natural Science Foundation of China
- 82072521/National Natural Science Foundation of China
- 82011530023/National Natural Science Foundation of China
- 82111530200/National Natural Science Foundation of China
- SZSM201612078/Sanming Project of Medicine in Shenzhen
- SZYJTD201714/The Introduction Project of Clinical Medicine Expert Team for Suzhou
- 2020080/Shanghai Talent Development Funding Scheme
- 21YF1404100/Shanghai Sailing Program
- 22YF1405200/Shanghai Sailing Program
- 22DZ2204900/Research Project of Shanghai Science and Technology Commission
- YG2022-14/Medical Engineering Joint Fund of Fudan University
- YG2019QNB09/Interdisciplinary Program of Shanghai Jiao Tong University
- shslczdzk00901/The program of Shanghai Municipal Key Clinical Specialty
- 3030278001/Huashan Hospital Talent Funding Scheme
- 20152227/Shanghai Municipal Education Commission Gaofeng Clinical Medicine Grant Support
- SHDC2020CR2045B/Clinical Research Plan of SHDC
LinkOut - more resources
Full Text Sources