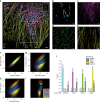
Tetra-color superresolution microscopy based on excitation spectral demixing
- PMID: 36588110
- PMCID: PMC9806106
- DOI: 10.1038/s41377-022-01054-6
Tetra-color superresolution microscopy based on excitation spectral demixing
Abstract
Multicolor imaging allows protein colocalizations and organelle interactions to be studied in biological research, which is especially important for single-molecule localization microscopy (SMLM). Here, we propose a multicolor method called excitation-resolved stochastic optical reconstruction microscopy (ExR-STORM). The method, which is based on the excitation spectrum of fluorescent dyes, successfully separated four spectrally very close far-red organic fluorophores utilizing three excitation lasers with cross-talk of less than 3%. Dyes that are only 5 nm apart in the emission spectrum were resolved, resulting in negligible chromatic aberrations. This method was extended to three-dimensional (3D) imaging by combining the astigmatic method, providing a powerful tool for resolving 3D morphologies at the nanoscale.
© 2023. The Author(s).
Conflict of interest statement
A patent describing the ExR-STORM system and image analysis in this work has been filed. W.J., L.G., W.W., S.L., C.F., and T.X. are the co-inventors. The remaining authors declare no competing interests.
Figures


Similar articles
-
Novel organic dyes for multicolor localization-based super-resolution microscopy.J Biophotonics. 2016 Jan;9(1-2):161-70. doi: 10.1002/jbio.201500119. Epub 2015 May 13. J Biophotonics. 2016. PMID: 25973835
-
Assessing crosstalk in simultaneous multicolor single-molecule localization microscopy.Cell Rep Methods. 2023 Sep 25;3(9):100571. doi: 10.1016/j.crmeth.2023.100571. Epub 2023 Sep 1. Cell Rep Methods. 2023. PMID: 37751691 Free PMC article.
-
Excitation-multiplexed multicolor superresolution imaging with fm-STORM and fm-DNA-PAINT.Proc Natl Acad Sci U S A. 2018 Dec 18;115(51):12991-12996. doi: 10.1073/pnas.1804725115. Epub 2018 Dec 3. Proc Natl Acad Sci U S A. 2018. PMID: 30509979 Free PMC article.
-
About samples, giving examples: Optimized Single Molecule Localization Microscopy.Methods. 2020 Mar 1;174:100-114. doi: 10.1016/j.ymeth.2019.05.008. Epub 2019 May 10. Methods. 2020. PMID: 31078795 Review.
-
Superresolution imaging of biological nanostructures by spectral precision distance microscopy.Biotechnol J. 2011 Sep;6(9):1037-51. doi: 10.1002/biot.201100031. Biotechnol J. 2011. PMID: 21910256 Review.
Cited by
-
Fluorescence-based super-resolution-microscopy strategies for chromatin studies.Chromosoma. 2023 Sep;132(3):191-209. doi: 10.1007/s00412-023-00792-9. Epub 2023 Mar 31. Chromosoma. 2023. PMID: 37000292 Free PMC article. Review.
-
Organelle landscape analysis using a multiparametric particle-based method.PLoS Biol. 2024 Sep 17;22(9):e3002777. doi: 10.1371/journal.pbio.3002777. eCollection 2024 Sep. PLoS Biol. 2024. PMID: 39288101 Free PMC article.
-
CO2-enhanced TADF of an ultra-stable Cu(i) cluster via guest-host π-π interaction.Chem Sci. 2025 Mar 10;16(16):6872-6878. doi: 10.1039/d4sc07949c. eCollection 2025 Apr 16. Chem Sci. 2025. PMID: 40115181 Free PMC article.
-
Multiplexed Nanoscopy via Buffer Exchange.ACS Nano. 2024 Aug 27;18(34):23445-23456. doi: 10.1021/acsnano.4c06829. Epub 2024 Aug 15. ACS Nano. 2024. PMID: 39143924 Free PMC article.
-
RegiSTORM: channel registration for multi-color stochastic optical reconstruction microscopy.BMC Bioinformatics. 2023 Jun 5;24(1):237. doi: 10.1186/s12859-023-05320-1. BMC Bioinformatics. 2023. PMID: 37277712 Free PMC article.
References
Grants and funding
- 91954202/National Natural Science Foundation of China (National Science Foundation of China)
- 31900419/National Natural Science Foundation of China (National Science Foundation of China)
- 2013066/Youth Innovation Promotion Association of the Chinese Academy of Sciences (Youth Innovation Promotion Association CAS)
LinkOut - more resources
Full Text Sources

