

Published Erratum
doi: 10.3389/fphar.2022.1042762.
eCollection 2022.
Corrigendum: Xiaoyaosan alleviates hippocampal glutamate-induced toxicity in the CUMS rats via NR2B and PI3K/Akt signaling pathway
Affiliations
- PMID: 36588727
- PMCID: PMC9800046
- DOI: 10.3389/fphar.2022.1042762
Item in Clipboard
Published Erratum
Corrigendum: Xiaoyaosan alleviates hippocampal glutamate-induced toxicity in the CUMS rats via NR2B and PI3K/Akt signaling pathway
Front Pharmacol.
.
Abstract
[This corrects the article DOI: 10.3389/fphar.2021.586788.].
Keywords: NR2B; PI3K/Akt pathway; depression; glutamate; hippocampal CA1 region; xiaoyaosan.
Copyright © 2022 Zhou, Liu, Liu, Ma, Zhao, Jiang, Li and Chen.
Figures
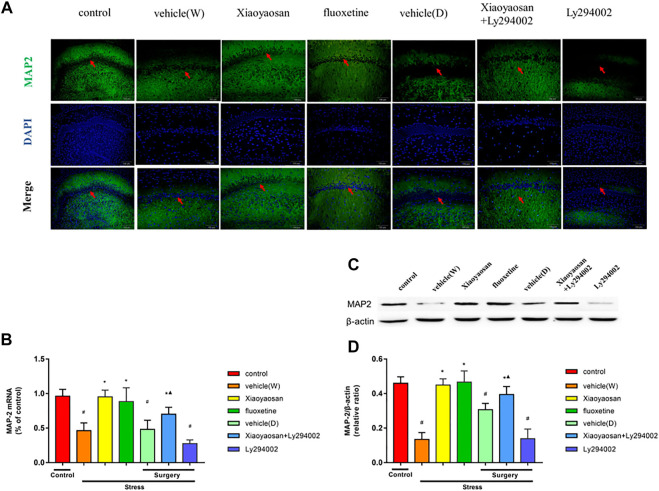
Xiaoyaosan elevates the expression of MAP2 in the hippocampal CA1 region of CUMS rats (A, original magnifification, ×200) Xiaoyaosan and Xiaoyaosan + Ly294002 promoted MAP2 expression in the CUMS rats. The green color represents MAP2 staining, and the blue color represents nuclear staining (C) Representative images and western blot analysis (D) of western blot assay showing the relative expression of MAP2 (B) Level of MAP2 mRNA in the hippocampal CA1 area of the rats in the treatment and control groups. All data are expressed as the mean ± SD. #
p < 0.05 compared to the control group; *
p < 0.05 compared to the vehicle (W) group; ▲
p < 0.05 compared to the Ly294002 group, n = 6.
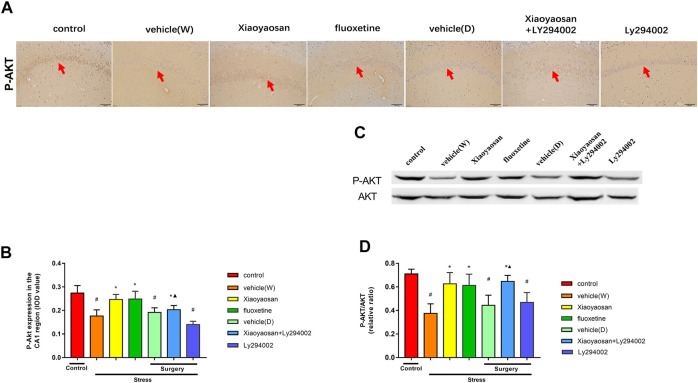
Xiaoyaosan elevates the expression of P-AKT/AKT in the hippocampal CA1 region of CUMS rats P-AKT/AKT in the hippocampal CA1 region of CUMS rats (A) Representative micrographs of immunohistochemical staining (sections were counterstained with hematoxylin; original magnifification, ×200) and (B) quantitative analysis showing the expression of P-AKT in the hippocampal CA1 region (C). Representative images and western blot analysis (D) of western blot assay showing the relative expression ratio of P-AKT/AKT in the hippocampal CA1 region. All data are expressed as the mean ± SD. #
p < 0.05 compared to the control group; *
p < 0.05, compared to the vehicle (W) group; ▲
p < 0.05 compared to the Ly294002 group, n = 6.
Erratum for
-
Xiaoyaosan Alleviates Hippocampal Glutamate-Induced Toxicity in the CUMS Rats via NR2B and PI3K/Akt Signaling Pathway.Front Pharmacol. 2021 Apr 12;12:586788. doi: 10.3389/fphar.2021.586788. eCollection 2021. Front Pharmacol. 2021. PMID: 33912031 Free PMC article.
Publication types
LinkOut - more resources
Full Text Sources
Miscellaneous