. 2022 Dec 16:13:1031906.
doi: 10.3389/fphar.2022.1031906. eCollection 2022.

C188-9, a specific inhibitor of STAT3 signaling, prevents thermal burn-induced skeletal muscle wasting in mice

Affiliations

C188-9, a specific inhibitor of STAT3 signaling, prevents thermal burn-induced skeletal muscle wasting in mice

Yuko Ono et al. Front Pharmacol. .

Abstract

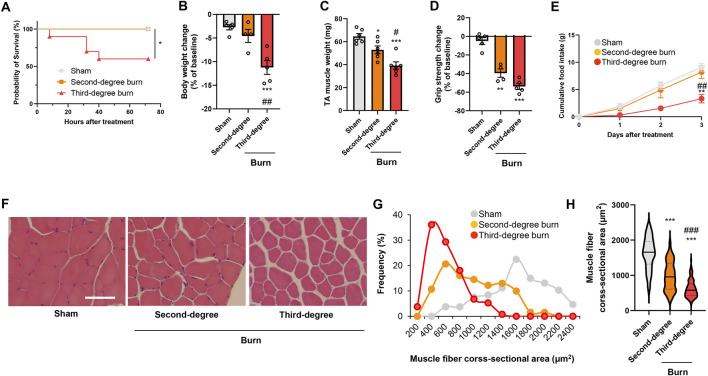
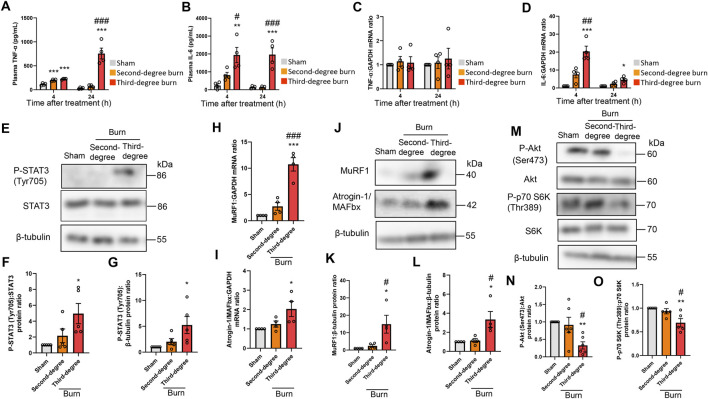
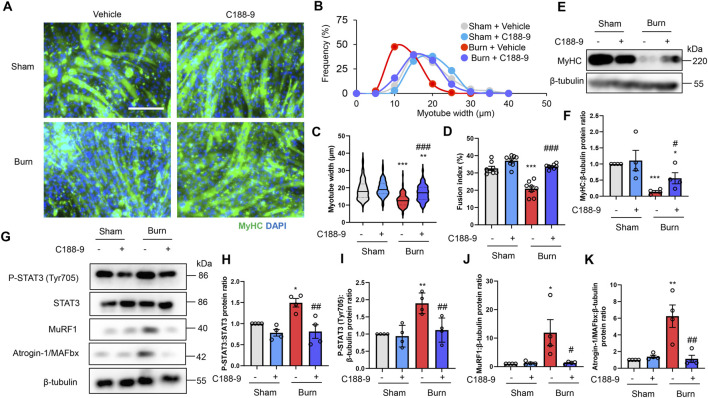
Burn injury is the leading cause of death and disability worldwide and places a tremendous economic burden on society. Systemic inflammatory responses induced by thermal burn injury can cause muscle wasting, a severe involuntary loss of skeletal muscle that adversely affects the survival and functional outcomes of these patients. Currently, no pharmacological interventions are available for the treatment of thermal burn-induced skeletal muscle wasting. Elevated levels of inflammatory cytokines, such as interleukin-6 (IL-6), are important hallmarks of severe burn injury. The levels of signal transducer and activator of transcription 3 (STAT3)-a downstream component of IL-6 inflammatory signaling-are elevated with muscle wasting in various pro-catabolic conditions, and STAT3 has been implicated in the regulation of skeletal muscle atrophy. Here, we tested the effects of the STAT3-specific signaling inhibitor C188-9 on thermal burn injury-induced skeletal muscle wasting in vivo and on C2C12 myotube atrophy in vitro after the administration of plasma from burn model mice. In mice, thermal burn injury severity dependently increased IL-6 in the plasma and tibialis anterior muscles and activated the STAT3 (increased ratio of phospho-STAT3/STAT3) and ubiquitin-proteasome proteolytic pathways (increased Atrogin-1/MAFbx and MuRF1). These effects resulted in skeletal muscle atrophy and reduced grip strength. In murine C2C12 myotubes, plasma from burn mice activated the same inflammatory and proteolytic pathways, leading to myotube atrophy. In mice with burn injury, the intraperitoneal injection of C188-9 (50 mg/kg) reduced activation of the STAT3 and ubiquitin-proteasome proteolytic pathways, reversed skeletal muscle atrophy, and increased grip strength. Similarly, pretreatment of murine C2C12 myotubes with C188-9 (10 µM) reduced activation of the same inflammatory and proteolytic pathways, and ameliorated myotube atrophy induced by plasma taken from burn model mice. Collectively, these results indicate that pharmacological inhibition of STAT3 signaling may be a novel therapeutic strategy for thermal burn-induced skeletal muscle wasting.

Keywords: humoral factor; hyper catabolism; interleukin-6; pharmacological intervention; skeletal muscle atrophy; systemic inflammatory response syndrome; ubiquitin proteasome pathway.


Conflict of interest statement

The authors declare that the research was conducted in the absence of any commercial or financial relationships that could be construed as a potential conflict of interest.

Figures

FIGURE 1
FIGURE 1
Thermal burn injury induces muscle atrophy and weakness in mice by a severity dependent mechanism. Second-degree, third-degree, or sham burns were administered to wild-type C57BL/6 mice (12–16-week-old male mice). (A) Cumulative survival after burn or sham burn injury. N = 5–10/group. *p < 0.05 by log rank test. After 3 days of burn or sham-burn injury, mice body weight (B), TA muscle weight (C), and grip strength (D) were assessed. Food intake (E) was measured every 24 h up to 72 h. N = 4–6/group. Representative images of H&E-stained TA muscle sections (F) and quantification of the distribution (G) and violin plot (H) of cross-sectional areas of TA muscle fibers 3 days after thermal burn injury. The continuous lines and dotted lines within the violin plot indicate the median and quartiles, respectively. The cross-sectional area of TA muscle fibers was measured. Scale bar, 50 µm. N = 106–133/group. For all panels, data are presented as the mean ± s.e.m. ***p < 0.001, **p < 0.01, *p < 0.05 vs. sham control group, ###p < 0.001, ##p < 0.01, #p < 0.05 vs. second-degree burn group by one-way ANOVA followed by Tukey’s honest significant difference test.
FIGURE 2
FIGURE 2
Thermal burn injury activates STAT3 and muscle proteolytic pathways, and reduces muscle anabolic pathways in mice by a severity dependent mechanism. Second-degree, third-degree, or sham burns were administered to wild-type C57BL/6 mice (12–16-week-old male mice) and 4 and 24 h after burn or sham-burn injury, plasma samples were prepared and TNF-α (A) and IL-6 (B) concentrations were measured by ELISA. N = 4/group. qRT-PCR analysis of TNF-α (C) and IL-6 (D) mRNAs in TA muscles 4 and 24 h after burn or sham-burn injury. Data were normalized to GAPDH mRNA levels and are shown as fold increase over the sham controls. N = 4/group. Western blot analysis (E) and quantification of P-STAT3 (F,G) in TA muscles 24 h after burn or sham-burn. Data were normalized to STAT3 protein levels (F) or β-tubulin protein levels (G) and the ratio in sham-control mice was set as 1. N = 5/group. qRT-PCR analysis of MuRF1 (H) and Atrogin-1/MAFbx (I) mRNAs in TA muscles 24 h after burn or sham-burn injury. Data were normalized to GAPDH mRNA levels and are shown as fold increase over the sham controls. N = 4/group. Western blot analysis (J) and quantification of MuRF1 (K) and Atrogin-1/MAFbx (L) expressions in TA muscles 24 h after burn or sham-burn treatment. Data were normalized to β-tubulin protein levels and the ratio in sham-control mice was set as 1. N = 4/group. Western blot analysis (M) and quantification of P-Akt (N) and P-p70 S6K (O) expressions in TA muscles 24 h after burn or sham-burn treatment. Data were normalized to Akt and p70 S6K protein levels, respectively, and the ratio in sham-control mice was set as 1. N = 5–6/group. For all panels, data are presented as the mean ± s.e.m. ***p < 0.001, **p < 0.01, *p < 0.05 vs. sham control group, ###p < 0.001, ##p < 0.01, #p < 0.05 vs. second-degree burn group by one-way ANOVA followed by Tukey’s honest significant difference test.
FIGURE 3
FIGURE 3
Plasma from burned mice induces the atrophy of C2C12 myotubes. C2C12 myotubes were incubated with plasma collected from burn or sham-burn mice (5% vol/vol) for 24 or 48 h. Representative immunofluorescence staining of MyHC in C2C12 myotubes (A) treated with plasma from burn or sham-burn mice for 48 h. Scale bar = 100 µm. Distribution of myotube widths (B), violin plot of myotube width (C), and fusion index (D). N = 97–124/group. The continuous lines and dotted lines within the violin plot indicate the median and quartiles, respectively. The fusion index was calculated from five randomly selected fields. Western blot analysis (E) and quantification (F) of MyHC expression in C2C12 myotubes treated for 48 h with plasma from burn or sham-burn mice. Data in (F) were normalized to β-tubulin protein levels, and the ratio in sham control cells was set as 1. N = 4/group. Western blot analysis (G) and quantification of P-STAT3 (H,I), MuRF1 (J), Atrogin-I/MAFbx (K), P-Akt (L), and P-p70 S6K (M) in C2C12 myotubes treated with plasma from burn or sham-burn mice for 24 h. Data were normalized to STAT3, β-tubulin, Akt, and p70 S6K protein levels, respectively, and the ratio in sham control cells was set as 1. N = 4/group. For all panels, data are presented as the mean ± s.e.m. ***p < 0.001, **p < 0.01, *p < 0.05 vs. cells treated with plasma from mice with sham burn; ##p < 0.01 #p < 0.05vs. cells treated with plasma from mice with second-degree burns. P-values were derived from one-way ANOVA followed by Tukey’s honest significant difference test or Kruskal-Wallis test followed by Dunn’s post hoc tests with Bonferroni correction.
FIGURE 4
FIGURE 4
C188-9 reduces thermal burn-induced muscle atrophy and weakness in mice. Third-degree or sham burns were administered to wild-type C57BL/6 mice (12–16-week-old male mice) that were then ip injected with vehicle (5% wt/vol dextrose in distilled water containing 5% vol/vol DMSO) or C188-9 (50 mg/kg) 1 h later. The ip injection of C188-9 or vehicle was repeated every 24 h until sacrifice. (A) Cumulative survival after burn or sham-burn injury in mice given vehicle or C188-9. N = 9–11/group. *p < 0.05 by log rank test. After 3 days, mice were assessed for body weight (B), TA muscle weight (C), and grip strength (D). Food intake (E) was measured every 24 h up to 72 h. N = 4–6/group. Representative images of H&E-stained TA muscle sections (F) and quantification of the distribution (G) and violin plot (H) of cross-sectional areas of TA muscle fibers 3 days after thermal burn injury. The continuous lines and dotted lines within the violin plot indicate the median and quartiles, respectively. Scale bar, 50 µm. N = 73–131/group. For all panels, data are presented as the mean ± s.e.m. ***p < 0.001 vs. sham injury with vehicle-treated group, ###p < 0.001, ##p < 0.01 vs. sham injury with vehicle-treated group by one-way ANOVA followed by Tukey’s honest significant difference test.
FIGURE 5
FIGURE 5
C188-9 reduces burn-induced muscle proteolytic pathway activation in mice. Third-degree or sham burns were administered to wild-type C57BL/6 mice (12–16-week-old male mice) that were then ip injected with vehicle (5% wt/vol dextrose in distilled water containing 5% vol/vol DMSO) or C188-9 (50 mg/kg) 1 h later. The ip injection of C188-9 or vehicle was repeated every 24 h until sacrifice. Then, 24 h after burn or sham-burn injury, plasma samples were prepared and TNF-α (A) and IL-6 (B) concentrations were measured by ELISA. N = 4/group. qRT-PCR analysis of TNF-α (C) and IL-6 (D) mRNAs in TA muscles 24 h after burn or sham-burn injury. Data were normalized to GAPDH mRNA levels and are shown as fold increase over the sham-vehicle group. N = 4/group. Western blot analysis (E) and quantification of P-STAT3 (F,G) in TA muscles 24 h after burn or sham-burn. Data were normalized to STAT3 protein levels or β-tubulin protein levels (G) and the ratio in the sham-vehicle group was set as 1. N = 5/group. qRT-PCR analysis of MuRF1 (H) and Atrogin-1/MAFbx (I) mRNAs in TA muscles 24 h after burn or sham-burn injury. Data were normalized to GAPDH mRNA levels and are shown as fold increase over the sham-vehicle group. N = 4/group. Western blot analysis (J) and quantification of MuRF1 (K) and Atrogin-1/MAFbx (L) expressions in TA muscles 24 h after burn or sham-burn injury. Data were normalized to β-tubulin protein levels, and the ratio in sham-vehicle group was set as 1. N = 8/group. Western blot analysis (M) and quantification of P-Akt (N) and P-p70 S6K (O) expressions in TA muscles 24 h after burn or sham-burn. Data were normalized to Akt and p70 S6K protein levels, respectively, and the ratio in the sham-vehicle group was set as 1. N = 6–7/group. For all panels, data are presented as the mean ± s.e.m.***p < 0.001, **p < 0.01, *p < 0.05 vs. sham injury with vehicle-treated group: ###p < 0.001, #p < 0.05 vs. thermal burn injury with vehicle-treated group. P-values were derived from one-way ANOVA followed by Tukey’s honest significant difference test or Kruskal-Wallis test followed by Dunn’s post hoc tests with Bonferroni correction.
FIGURE 6
FIGURE 6
C188-9 reduces proteolytic pathway activation and atrophy of C2C12 myotubes induced by plasma from mice with thermal burn injury. C2C12 myotubes were treated with vehicle (0.1% vol/vol DMSO) or C188-9 (10 µM) and then with plasma collected from mice with third-degree burns or sham-burn injuries (5% vol/vol) 1 h later. Representative immunofluorescence staining of MyHC in C2C12 myotubes (A) treated with vehicle or C188-9, and with plasma from burn or sham-burn mice for 48 h. Scale bar = 100 µm. Distribution of myotube widths (B), violin plot of myotube width (C), and fusion index (D). N = 103–127/group. The continuous lines and dotted lines within the violin plot indicate the median and quartiles, respectively. The fusion index was calculated from eight randomly selected fields. Western blot analysis (E) and quantification (F) of MyHC expression in C2C12 myotubes treated for 48 h with vehicle or C188-9, and with plasma from burn or sham-burn mice. Data in (F) were normalized to β-tubulin protein levels, and the ratio in sham-vehicle cells was set as 1. N = 4/group. Western blot analysis (G) and quantification of P-STAT3 (H,I), MuRF1 (J), and Atrogin-I/MAFbx (K) in C2C12 myotubes treated with vehicle, C188-9, and plasma from burn or sham-burn mice for 24 h. Data were normalized to STAT3 protein levels and β-tubulin protein levels, respectively, and the ratio in sham-vehicle cells was set as 1. N = 4/group. For all panels, data are presented as the mean ± s.e.m. ***p < 0.001, **p < 0.01, *p < 0.05 vs. sham-vehicle cells: ###p < 0.001, ##p < 0.01, #p < 0.05 vs. sham-burn cells. P-values were derived from one-way ANOVA followed by Tukey’s honest significant difference test.
FIGURE 7
FIGURE 7
Proposed mechanism of thermal burn injury-induced skeletal muscle wasting.

Similar articles

Cited by

References

    1. Abdullahi A., Amini-Nik S., Jeschke M. G. (2014). Animal models in burn research. Cell. Mol. Life Sci. 71, 3241–3255. 10.1007/s00018-014-1612-5 - DOI - PMC - PubMed
    1. Ali A. M., Kunugi H. (2021). Skeletal muscle damage in COVID-19: A call for action. Medicina 57, 372. 10.3390/medicina57040372 - DOI - PMC - PubMed
    1. Ali N. A., O’Brien J. M., Jr, Hoffmann S. P., Phillips G., Garland A., Finley J. C., et al. (2008). Acquired weakness, handgrip strength, and mortality in critically ill patients. Am. J. Respir. Crit. Care Med. 178, 261–268. 10.1164/rccm.200712-1829OC - DOI - PubMed
    1. Alves C., MacDonald T. L., Nigro P., Pathak P., Hirshman M. F., Goodyear L. J., et al. (2019). Reduced sucrose nonfermenting AMPK-related kinase (SNARK) activity aggravates cancer-induced skeletal muscle wasting. Biomed. Pharmacother. 117, 109197. 10.1016/j.biopha.2019.109197 - DOI - PMC - PubMed
    1. Belizário J. E., Fontes-Oliveira C. C., Borges J. P., Kashiabara J. A., Vannier E. (2016). Skeletal muscle wasting and renewal: A pivotal role of myokine IL-6. SpringerPlus 5, 619. 10.1186/s40064-016-2197-2 - DOI - PMC - PubMed