. 2022 Dec 13:13:1012293.
doi: 10.3389/fpls.2022.1012293. eCollection 2022.

Estimation of soybean yield parameters under lodging conditions using RGB information from unmanned aerial vehicles

Affiliations

Estimation of soybean yield parameters under lodging conditions using RGB information from unmanned aerial vehicles

Dong Bai et al. Front Plant Sci. .

Abstract

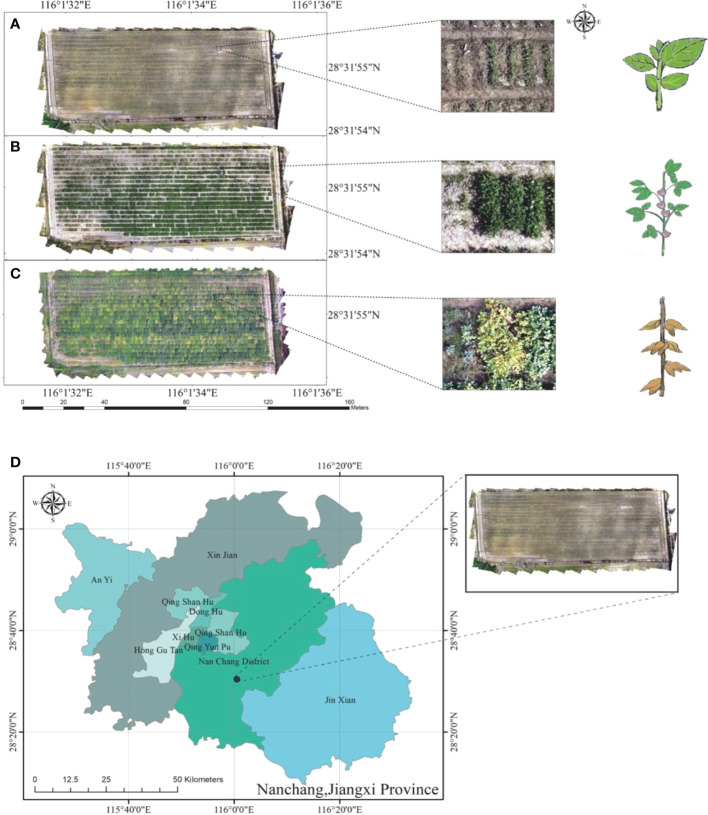
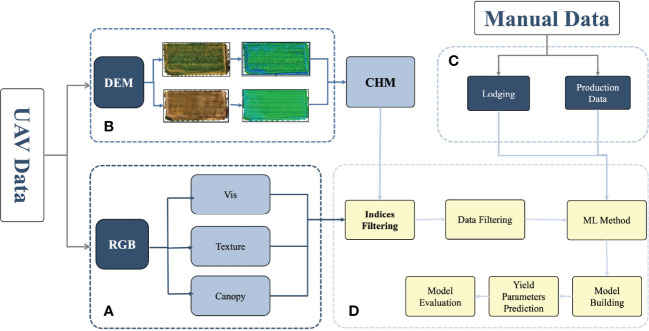
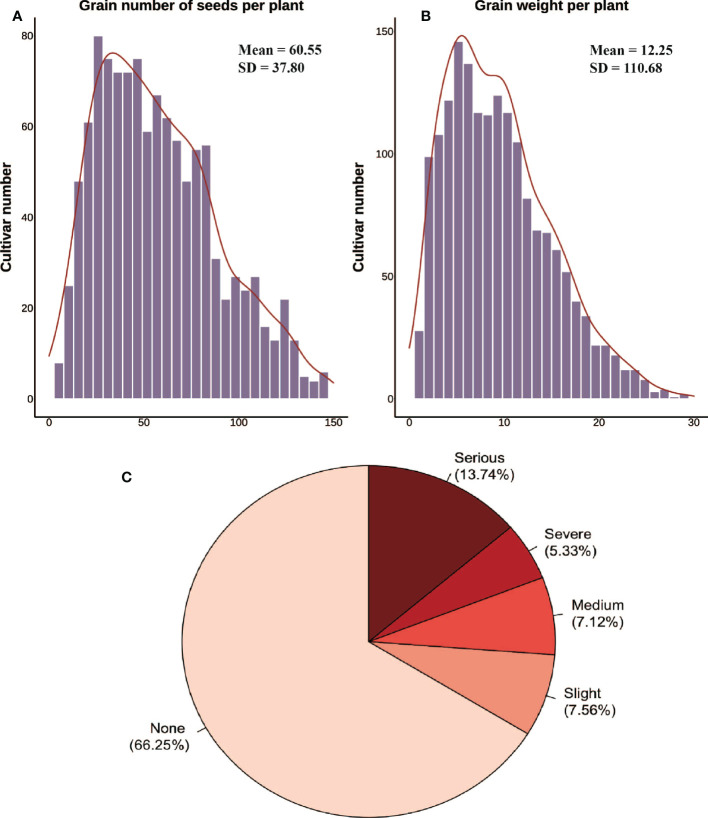
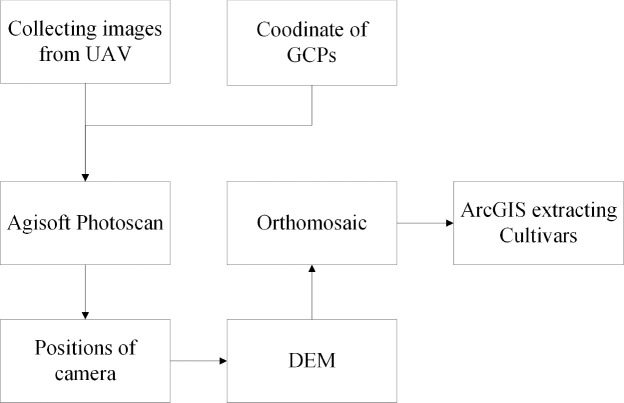
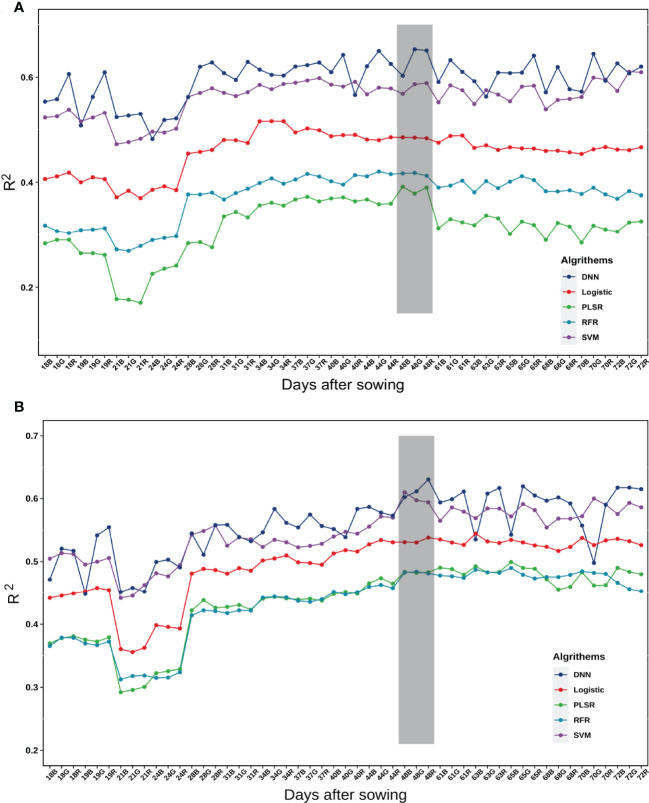
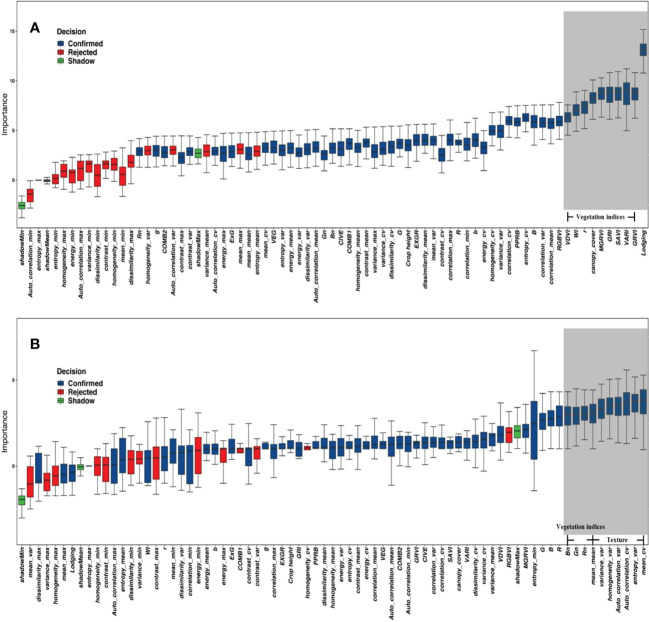
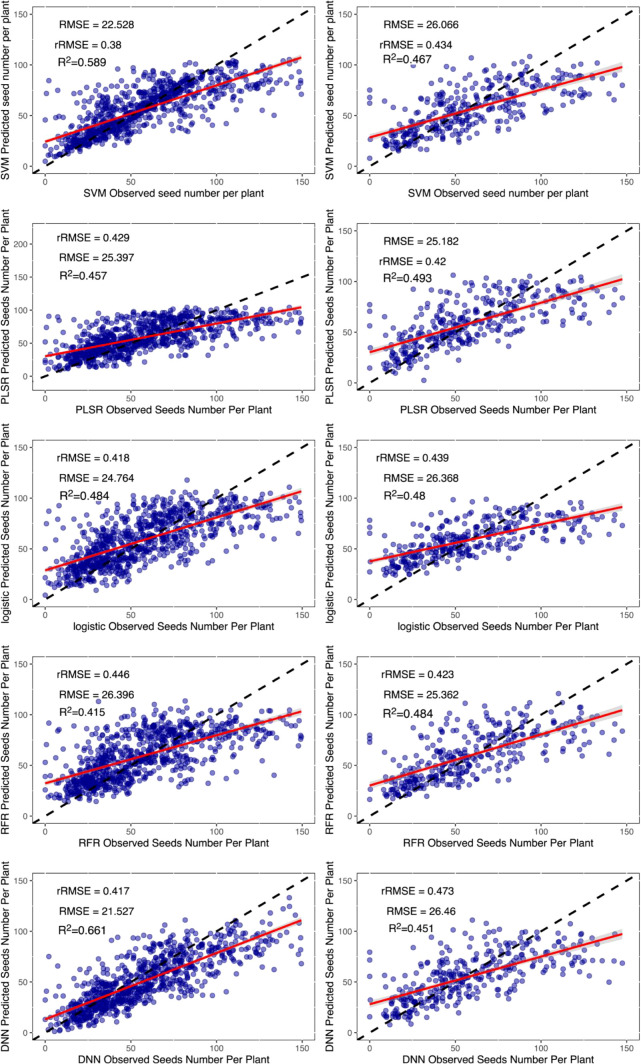
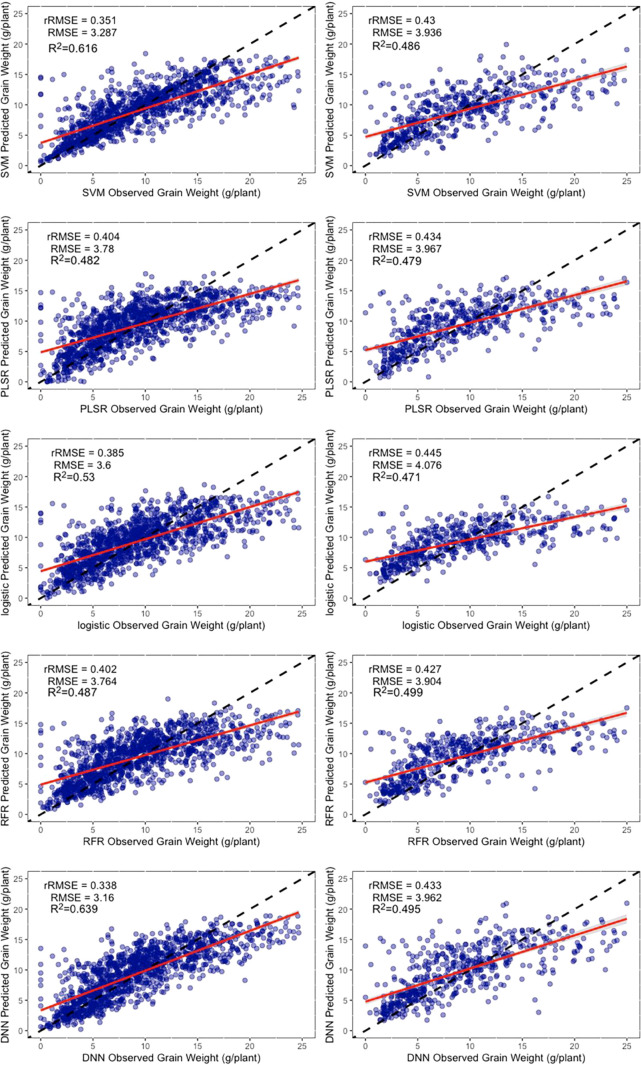
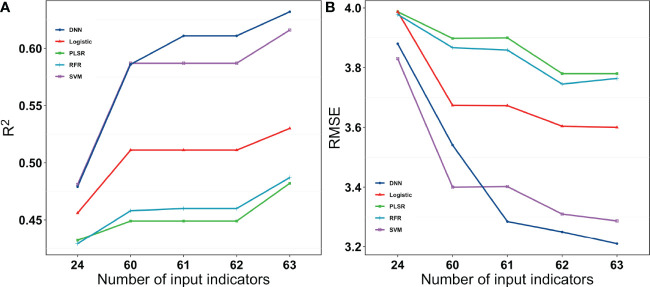
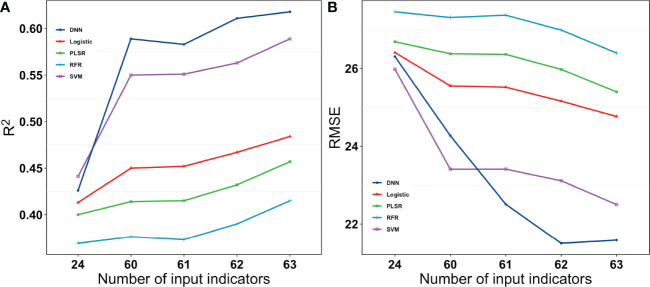
The estimation of yield parameters based on early data is helpful for agricultural policymakers and food security. Developments in unmanned aerial vehicle (UAV) platforms and sensor technology help to estimate yields efficiency. Previous studies have been based on less cultivars (<10) and ideal experimental environments, it is not available in practical production. Therefore, the objective of this study was to estimate the yield parameters of soybean (Glycine max (L.) Merr.) under lodging conditions using RGB information. In this study, 17 time point data throughout the soybean growing season in Nanchang, Jiangxi Province, China, were collected, and the vegetation index, texture information, canopy cover, and crop height were obtained by UAV-image processing. After that, partial least squares regression (PLSR), logistic regression (Logistic), random forest regression (RFR), support vector machine regression (SVM), and deep learning neural network (DNN) were used to estimate the yield parameters. The results can be summarized as follows: (1) The most suitable time point to estimate the yield was flowering stage (48 days), which was when most of the soybean cultivars flowered. (2) The multiple data fusion improved the accuracy of estimating the yield parameters, and the texture information has a high potential to contribute to the estimation of yields, and (3) The DNN model showed the best accuracy of training (R2=0.66 rRMSE=32.62%) and validation (R2=0.50, rRMSE=43.71%) datasets. In conclusion, these results provide insights into both best estimate period selection and early yield estimation under lodging condition when using remote sensing.

Keywords: UAV; lodging; machine learning; soybean; yield.


Conflict of interest statement

The authors declare that the research was conducted in the absence of any commercial or financial relationships that could be construed as a potential conflict of interest.

Figures

Figure 1
Figure 1
Study area. (A) RGB orthomosaic map on August 1, 2020. (B) RGB orthomosaic map on August 20, 2020. (C) RGB orthomosaic map on September 24, 2020. (D) The test field was in Nanchang, Jiangxi Province, China.
Figure 2
Figure 2
Flowchart for estimating the yield parameters. (A) RGB indices extraction process. (B) Calculation of the plant height using DEM. (C) Manual data, including lodging and yield parameters, such as the grain number of seeds per plant and grain weight per plant. (D) Data cleaning and model building. DEM, digital elevation model; RGB, red green blue.
Figure 3
Figure 3
Yield parameters and inversions collected manually. (A, B) Histogram distribution of the grain number of seeds per plant and the grain weight per plant from manual surveys. (C) Lodging classification and percentage.
Figure 4
Figure 4
Flowchart of the UAV RGB image mosaic processing.
Figure 5
Figure 5
Correlation between CHM and Observation. CHM is crop height model, it is the plant height estimated data.
Figure 6
Figure 6
Accuracy of the estimation of different models on yield parameters at different dates. (A) Grain number of seeds per plant. (B) Grain weight per plant. The digital numbers represent the days after sowing, and R, G, and B represent the spectral bands. The grey background represents the selected optimal estimation model from day 48.
Figure 7
Figure 7
The importance of indices for yield parameters. (A) Grain weight per plant. (B) Grain number of seeds per plant. The red box plot was the indices recommended for removal; the blue box plot was the Indices recommended to be retained. The grey background represents the top 10 indices.
Figure 8
Figure 8
Results of machine learning algorithms to estimate the grain number of seeds per plant. The left column is the training dataset, and the right column is the validation dataset. The black dashed line is the 1:1 line, and the red solid line is the data fitted line. SVM, support vector machines regression; RFR, random forests regression; PLSR, partial least squares regression; Logistic, logistic regression; DNN, deep neural network.
Figure 9
Figure 9
Results of the machine learning algorithms to estimate the grain weight per plant. The left column is the training dataset, and the right column is the validation dataset. The black dashed line is the 1:1 line, and the solid red line is the data fitted line. SVM, support vector machines regression; RFR, random forest regression; PLSR, partial least squares regression; Logistic, logistic regression; DNN, deep neural network.
Figure 10
Figure 10
R2 and RMSE for the different models with different input indices for grain weight per plant. 24 were vegetation indices. 60 were vegetation indices and texture indices. 61 were vegetation indices, texture indices, and canopy cover. 62 were vegetation indices, texture indices, canopy cover, and crop height. 63 were vegetation indices, texture indices, canopy cove, crop height, and lodging.
Figure 11
Figure 11
R2 and RMSE for different models with different numbers of input Indices for the grain number of seeds per plant. 24 were vegetation indices. 60 were vegetation indices and texture indices. 61 were vegetation indices, texture indices, and canopy cover. 62 were vegetation indices, texture indices, canopy cover, and crop height. 63 were vegetation indices, texture indices, canopy cove, crop height, and lodging.

References

    1. Agriculture, U. S. D. O (2021). 2021 U.S. soybean outlook remains strong after record first quarter export volume (International Agricultural Trade Report; ). Available at: https://www.fas.usda.gov/data/2021-us-soybean-outlook-remains-strong-aft....
    1. Araus J. L., Kefauver S. C., Diaz O. V., Gracia-Romero A., Rezzouk F. Z., Segarra J., et al. . (2021). Crop phenotyping in a context of global change: what to measure and how to do it. J. Integr. Plant Biol. 64, 27–88. doi: 10.1111/jipb.13191 - DOI - PubMed
    1. Arroyo J., Guijarro M., Pajares G. (2016). An instance-based learning approach for thresholding in crop images under different outdoor conditions. Comput. Electron. Agric. 127, 669–679. doi: 10.1016/j.compag.2016.07.018 - DOI
    1. Bendig J., YU K., Aasen H., Bolten A., Bennertz S., Broscheit J., et al. . (2015). Combining UAV-based plant height from crop surface models, visible, and near infrared vegetation indices for biomass monitoring in barley. Int. J. Appl. Earth Observation Geoinformation 39, 79–87. doi: 10.1016/j.jag.2015.02.012 - DOI
    1. Bharati M. H., Liu J. J., Macgregor J. F. (2004). Image texture analysis: methods and comparisons. Chemometrics Intelligent Lab. Syst. 72, 57–71. doi: 10.1016/j.chemolab.2004.02.005 - DOI

LinkOut - more resources