. 2022 Dec 15:13:1045854.
doi: 10.3389/fpls.2022.1045854. eCollection 2022.

Genetic basis of maize kernel protein content revealed by high-density bin mapping using recombinant inbred lines

Affiliations

Genetic basis of maize kernel protein content revealed by high-density bin mapping using recombinant inbred lines

Xin Lu et al. Front Plant Sci. .

Abstract

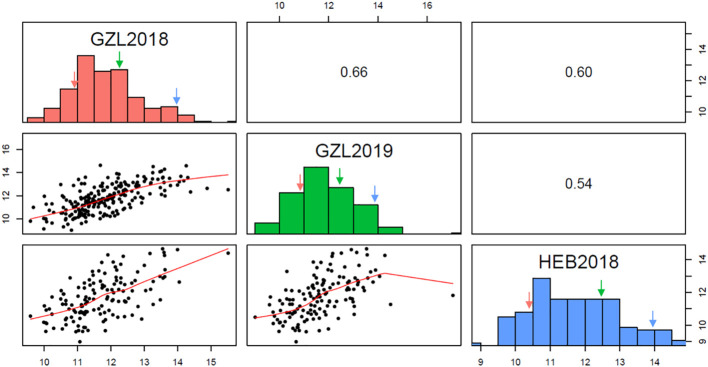
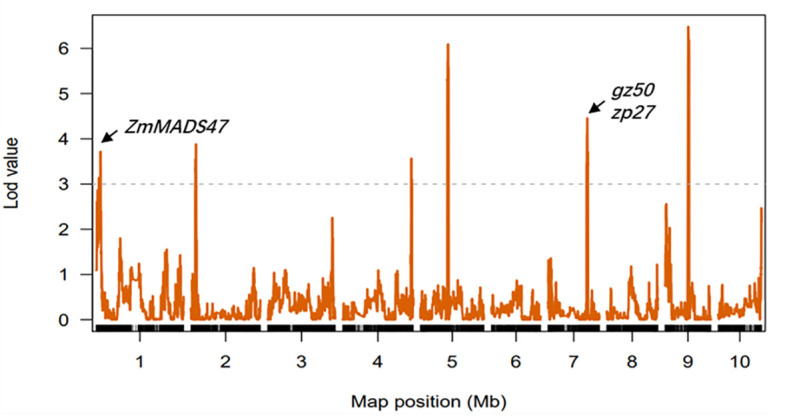
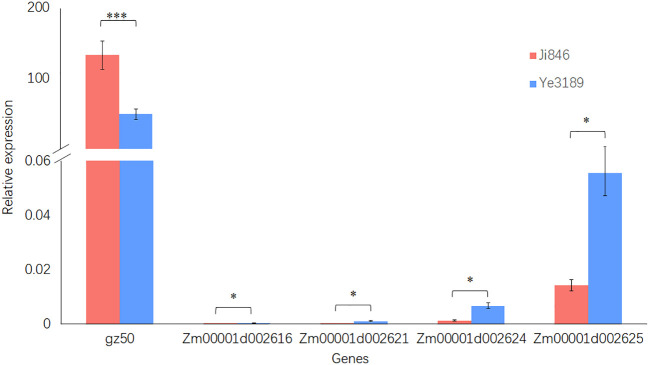
Maize with a high kernel protein content (PC) is desirable for human food and livestock fodder. However, improvements in its PC have been hampered by a lack of desirable molecular markers. To identify quantitative trait loci (QTL) and candidate genes for kernel PC, we employed a genotyping-by-sequencing strategy to construct a high-resolution linkage map with 6,433 bin markers for 275 recombinant inbred lines (RILs) derived from a high-PC female Ji846 and low-PC male Ye3189. The total genetic distance covered by the linkage map was 2180.93 cM, and the average distance between adjacent markers was 0.32 cM, with a physical distance of approximately 0.37 Mb. Using this linkage map, 11 QTLs affecting kernel PC were identified, including qPC7 and qPC2-2, which were identified in at least two environments. For the qPC2-2 locus, a marker named IndelPC2-2 was developed with closely linked polymorphisms in both parents, and when tested in 30 high and 30 low PC inbred lines, it showed significant differences (P = 1.9E-03). To identify the candidate genes for this locus, transcriptome sequencing data and PC best linear unbiased estimates (BLUE) for 348 inbred lines were combined, and the expression levels of the four genes were correlated with PC. Among the four genes, Zm00001d002625, which encodes an S-adenosyl-L-methionine-dependent methyltransferase superfamily protein, showed significantly different expression levels between two RIL parents in the endosperm and is speculated to be a potential candidate gene for qPC2-2. This study will contribute to further research on the mechanisms underlying the regulation of maize PC, while also providing a genetic basis for marker-assisted selection in the future.

Keywords: genotyping by sequencing; high resolution linkage map; maize; protein content; quantitative trait loci.


Conflict of interest statement

The reviewer QC declared a shared affiliation with the authors YW, RW, ZW, YZ to the handling editor at the time of the review. The remaining authors declare that the research was conducted in the absence of any commercial or financial relationships that could be construed as a potential conflict of interest.

Figures

Figure 1
Figure 1
Frequency distribution of protein content (PC) and correlations across three environments. GZL2018, GZL2019, and HEB2018 indicate Gongzhuling in 2018, Gongzhuling in 2019, and Harbin in 2018, respectively. Red arrow: Ye3189; blue arrow: Ji846; blue arrow: mid-parent.
Figure 2
Figure 2
Genome-wide distribution of SNPs and genetic variants in the Ji846 and Ye3189 genomes. The outermost circle with scale represents the ten chromosomes. The orange histogram represents the density of SNPs that are polymorphic between Ji846 and Ye3189; the green histogram represents the density of polymorphic SNPs within the coding sequences of Ji846 and Ye3189; the blue histogram indicates the density of insertions and deletions (Indels) between Ji846 and Ye3189.
Figure 3
Figure 3
Genetic linkage map construction with bin markers. (A) SNP density distribution across the ten chromosomes. (B) Graphic genotype of 275 RILs. red, Ye3189 genotype; blue, Ji846 genotype; yellow, heterozygous genotypes. (C) Mapping of 2.09 and 3.04, which control maize head smut, in the RIL population. The curves with different colors represent the QTL regions according to the confidence intervals for linkage mapping under the three environments, respectively. Red, 2007 Harbin; black, 2008 Harbin; blue, 2009 Harbin; The x-axis indicates genetic positions across the maize genome in Mb. The y-axis indicates the LOD score of the detected QTL. The red dashed lines represent the LOD threshold.
Figure 4
Figure 4
Mapping of QTLs for protein on the ten maize chromosomes in three different environments (combined). The curves indicate the physical positions (x-axis) of the bin markers against the LOD scores (y-axis) for QTLs detected on each of the ten chromosomes. The gray dashed lines represent the LOD threshold.
Figure 5
Figure 5
Distribution of the phenotypes and QTLs identified on chromosomes in the different environments assessed in this study. (A) The curves indicate the physical positions (x-axis) of bin markers against the LOD scores (y-axis) for QTLs detected on qPC2-2. Different colors represent different environments. 2018GZL and 2018HEB represent Gongzhuling and Harbin in 2018, respectively; BLUE represents joint analyses. (B) Tests for differences among phenotypic values for the BLUE values of PCs associated with MK1131 in maize inbred lines. AA represents the Ji846 genotype; BB represents the Ye3189 genotype. The y-axis indicates the phenotypic values for the BLUE values of PC. (C) Indels between Ji846 and Ye3189 around the peak position (MK1131) in qPC2-2. (D) Genotyping of maize inbred lines with 30 high and 30 low PCs using marker IndelPC2-2, lane 1: marker; lane 2: genotype of Ji846; lane 3: genotype of Ye3189; lane 4-63: genotypes of 60 inbred lines. (E) Tests for differences among phenotypic BLUE values of PCs associated with the IndelPC2-2 marker in maize inbred lines with 30 high and 30 low PCs. Hap1 represents Ye3189 genotype; hap2 represents Ji846 genotype. The y-axis indicates the phenotypic values for the BLUE values for PC.
Figure 6
Figure 6
Relative quantitative expression analysis of Zm00001d002625 in the endosperm (20 DAP) of Ji846 and Ye3189 using qRT-PCR. The red bars represent Ji846 (high-protein parent), and the blue bars represent Ye3189 (low-protein parent). The horizontal axis of the graph indicates the different genes, and the vertical axis indicates the relative expression levels. The data are presented as the means of three biological and technical replicates ± standard errors. * and *** indicate P< 0.05 and P< 0.001, respectively, by a t-test.

References

    1. Broman K. W., Wu H., Sen S., Churchill G. A. (2003). R/qtl: QTL mapping in experimental crosses. Bioinformatics 19, 889–890. doi: 10.1093/bioinformatics/btg112 - DOI - PubMed
    1. Cartwright D. A., Troggio M., Velasco R., Gutin A. (2007). Genetic mapping in the presence of genotyping errors. Genetics 176, 2521–2527. doi: 10.1534/genetics.106.063982 - DOI - PMC - PubMed
    1. Chen Z., Wang B., Dong X., Liu H., Ren L., Chen J., et al. . (2014). An ultra-high density bin-map for rapid QTL mapping for tassel and ear architecture in a large F2 maize population. BMC Genomics 15, 433. doi: 10.1186/1471-2164-15-433 - DOI - PMC - PubMed
    1. Chunthawodtiporn J., Hill T., Stoffel K., Deynze A. V. (2019). Genetic analysis of resistance to multiple isolates of phytophthora capsici and linkage to horticultural traits in bell pepper. HortScience 54, 1143–1148. doi: 10.21273/HORTSCI13359-18 - DOI
    1. Coleman C. E., Clore A. M., Ranch J. P., Higgins R., Lopes M. A., Larkins B. A. (1997). Expression of a mutant α-zein creates the floury2 phenotype in transgenic maize. Proc. Natl. Acad. Sci. U.S.A. 94, 7094–7097. doi: 10.1073/pnas.94.13.7094 - DOI - PMC - PubMed