

Diffuse reflectance spectroscopy sensor to differentiate between glial tumor and healthy brain tissue: a proof-of-concept study
- PMID: 36589562
- PMCID: PMC9774850
- DOI: 10.1364/BOE.474344
Diffuse reflectance spectroscopy sensor to differentiate between glial tumor and healthy brain tissue: a proof-of-concept study
Abstract
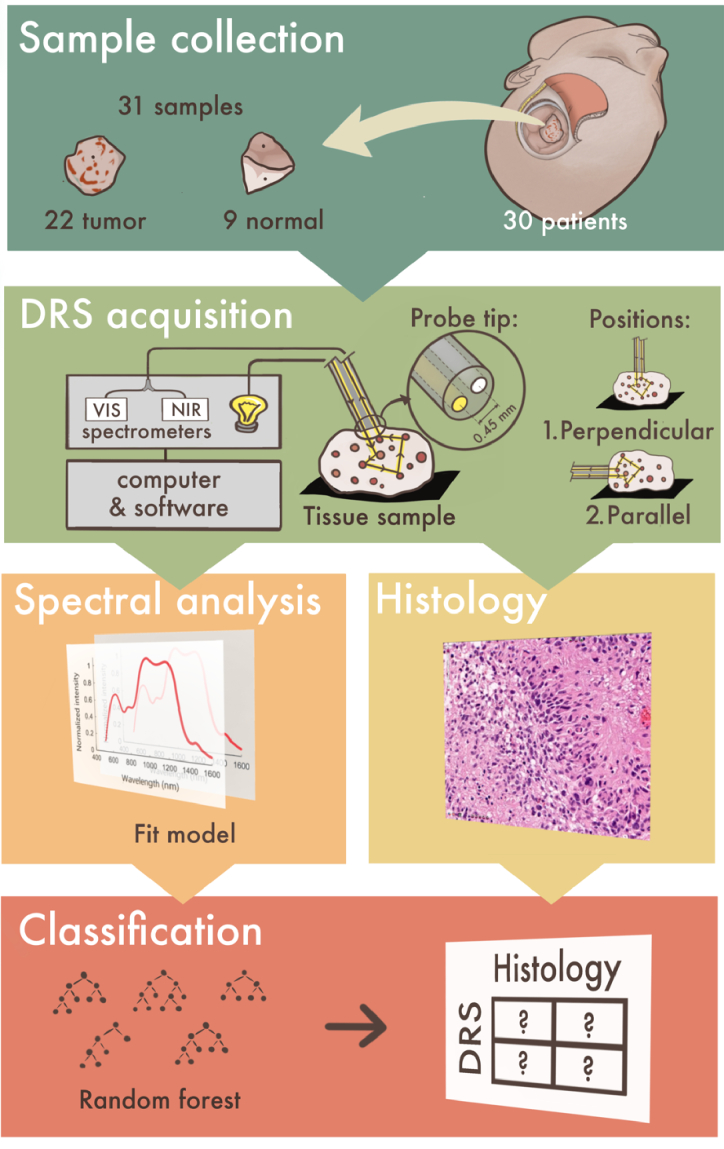
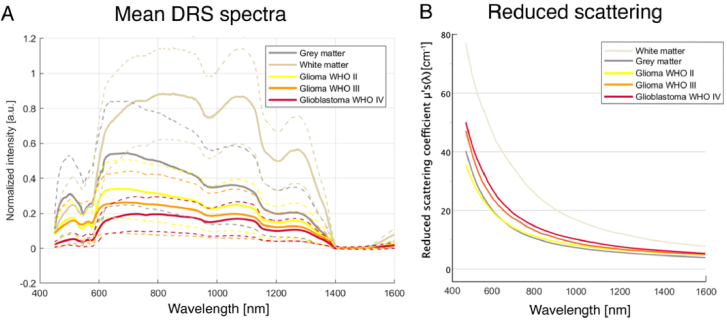
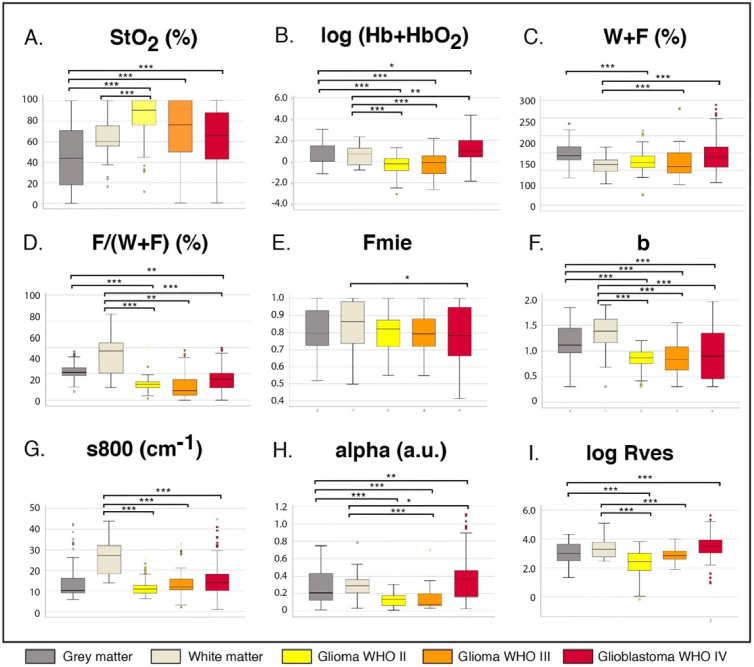
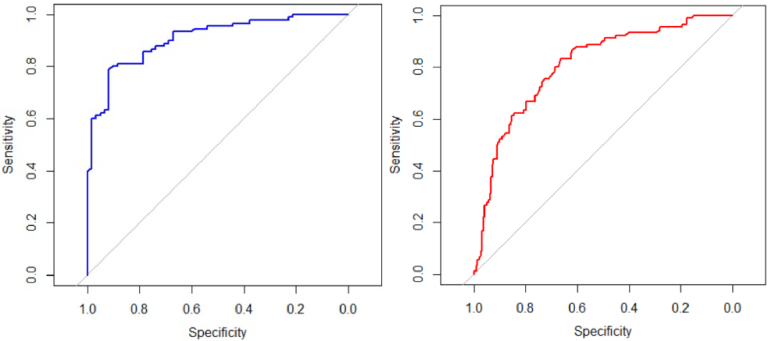
Glial tumors grow diffusely in the brain. Survival is correlated to the extent of tumor removal, but tumor borders are often invisible. Resection beyond the borders as defined by conventional methods may further improve prognosis. In this proof-of-concept study, we evaluate diffuse reflectance spectroscopy (DRS) for discrimination between glial tumors and normal brain ex vivo. DRS spectra and histology were acquired from 22 tumor samples and nine brain tissue samples retrieved from 30 patients. The content of biological chromophores and scattering features were estimated by fitting a model derived from diffusion theory to the DRS spectra. DRS parameters differed significantly between tumor and normal brain tissue. Classification using random forest yielded a sensitivity and specificity for the detection of low-grade gliomas of 82.0% and 82.7%, respectively, and the area under curve (AUC) was 0.91. Applied in a hand-held probe or biopsy needle, DRS has the potential to provide intra-operative tissue analysis.
© 2022 Optica Publishing Group under the terms of the Optica Open Access Publishing Agreement.
Conflict of interest statement
None of the authors who are affiliated with clinical institutions or universities (S.S., G.B., F.M., A.F., E.E., O.P., A.E.-T) have financial interests in the subject matter, materials, or equipment or with any competing materials and did not receive any payments from Philips. Karolinska University hospital and Philips have a major collaboration agreement. The authors affiliated with Philips Research (M.L., B.H.) have financial interests in the subject matter, materials, and equipment, in the sense that they are employees of Philips. Philips provided support in the form of salaries but did not have any additional role in the study design, data collection and analysis, decision to publish, or preparation of the manuscript. Authors without conflicts of interest had full control of all data labelling, data analysis and information submitted for publication and over all conclusions drawn in the manuscript.
Figures
Similar articles
-
Diffuse reflectance spectroscopy can differentiate high grade and low grade prostatic carcinoma.Annu Int Conf IEEE Eng Med Biol Soc. 2016 Aug;2016:5148-5151. doi: 10.1109/EMBC.2016.7591886. Annu Int Conf IEEE Eng Med Biol Soc. 2016. PMID: 28325017
-
Clot composition characterization using diffuse reflectance spectroscopy in acute ischemic stroke.Biomed Opt Express. 2022 May 10;13(6):3311-3323. doi: 10.1364/BOE.458445. eCollection 2022 Jun 1. Biomed Opt Express. 2022. PMID: 35781943 Free PMC article.
-
Diffuse Reflectance Spectroscopy for Surface Measurement of Liver Pathology.Eur Surg Res. 2017;58(1-2):40-50. doi: 10.1159/000449378. Epub 2016 Sep 23. Eur Surg Res. 2017. PMID: 27658312 Clinical Trial.
-
Breast Cancer Diagnosis Using Extended-Wavelength-Diffuse Reflectance Spectroscopy (EW-DRS)-Proof of Concept in Ex Vivo Breast Specimens Using Machine Learning.Diagnostics (Basel). 2023 Sep 28;13(19):3076. doi: 10.3390/diagnostics13193076. Diagnostics (Basel). 2023. PMID: 37835819 Free PMC article.
-
Optical Methods for Brain Tumor Detection: A Systematic Review.J Clin Med. 2024 May 2;13(9):2676. doi: 10.3390/jcm13092676. J Clin Med. 2024. PMID: 38731204 Free PMC article. Review.
Cited by
-
Point Projection Mapping System for Tracking, Registering, Labeling, and Validating Optical Tissue Measurements.J Imaging. 2024 Jan 30;10(2):37. doi: 10.3390/jimaging10020037. J Imaging. 2024. PMID: 38392085 Free PMC article.
-
Study of Minor Chromophores in Biological Tissues by Diffuse Optical Spectroscopy (Review).Sovrem Tekhnologii Med. 2025;17(1):146-162. doi: 10.17691/stm2025.17.1.12. Epub 2025 Feb 28. Sovrem Tekhnologii Med. 2025. PMID: 40071075 Free PMC article. Review.
-
Introduction to the Optics and the Brain 2023 feature issue.Biomed Opt Express. 2024 Mar 4;15(4):2110-2113. doi: 10.1364/BOE.517678. eCollection 2024 Apr 1. Biomed Opt Express. 2024. PMID: 38633102 Free PMC article.
-
Advances in Diagnostic Tools and Therapeutic Approaches for Gliomas: A Comprehensive Review.Sensors (Basel). 2023 Dec 15;23(24):9842. doi: 10.3390/s23249842. Sensors (Basel). 2023. PMID: 38139688 Free PMC article. Review.
-
In situ optical feedback in brain tumor biopsy: A multiparametric analysis.Neurooncol Adv. 2024 Oct 24;6(1):vdae175. doi: 10.1093/noajnl/vdae175. eCollection 2024 Jan-Dec. Neurooncol Adv. 2024. PMID: 39687792 Free PMC article.
References
LinkOut - more resources
Full Text Sources