. 2022 Nov 14;13(12):6416-6430.
doi: 10.1364/BOE.471198. eCollection 2022 Dec 1.

Spatiotemporal singular value decomposition for denoising in photoacoustic imaging with a low-energy excitation light source

Affiliations

Spatiotemporal singular value decomposition for denoising in photoacoustic imaging with a low-energy excitation light source

Mengjie Shi et al. Biomed Opt Express. .

Abstract

Photoacoustic (PA) imaging is an emerging hybrid imaging modality that combines rich optical spectroscopic contrast and high ultrasonic resolution, and thus holds tremendous promise for a wide range of pre-clinical and clinical applications. Compact and affordable light sources such as light-emitting diodes (LEDs) and laser diodes (LDs) are promising alternatives to bulky and expensive solid-state laser systems that are commonly used as PA light sources. These could accelerate the clinical translation of PA technology. However, PA signals generated with these light sources are readily degraded by noise due to the low optical fluence, leading to decreased signal-to-noise ratio (SNR) in PA images. In this work, a spatiotemporal singular value decomposition (SVD) based PA denoising method was investigated for these light sources that usually have low fluence and high repetition rates. The proposed method leverages both spatial and temporal correlations between radiofrequency (RF) data frames. Validation was performed on simulations and in vivo PA data acquired from human fingers (2D) and forearm (3D) using a LED-based system. Spatiotemporal SVD greatly enhanced the PA signals of blood vessels corrupted by noise while preserving a high temporal resolution to slow motions, improving the SNR of in vivo PA images by 90.3%, 56.0%, and 187.4% compared to single frame-based wavelet denoising, averaging across 200 frames, and single frame without denoising, respectively. With a fast processing time of SVD (∼50 µs per frame), the proposed method is well suited to PA imaging systems with low-energy excitation light sources for real-time in vivo applications.


Conflict of interest statement

T.V. is co-founder and shareholder of Hypervision Surgical Ltd, London, UK. He is also a shareholder of Mauna Kea Technologies, Paris, France.

Figures

Fig. 1.
Fig. 1.
Rank estimators based on temporal singular vectors (a) and spatial singular vectors (b) for an in vivo radiofrequency (RF) acquisition using human fingers. (a) Power spectral density (PSD) and 99% bandwidth (BW) of temporal singular vectors. (b) Correlation matrix of spatial singular vectors. The inflection point of the BW curve in (a) was denoted by a black arrow. The red dashed square in (b) from 1 to 10 represents the tissue subspace while the blue dashed square in (b) represents the noise subspace. Noted that the blue dashed square has weak correlation values. Estimations were shown on singular vectors ranging from 1 to 75.
Fig. 2.
Fig. 2.
Schematic illustration of spatiotemporal SVD based PA denoising. A finger of a healthy human volunteer is imaged (for around 22 s) in water with a LED-based photoacoustic (PA)/ultrasound (US) imaging system. Radiofrequency (RF) data are acquired for offline processing. A Casorati matrix is then formulated based on the RF data, and randomised singular value decomposition (rSVD) is performed on the Casorati matrix. The corresponding filtered RF data is then obtained by unrolling the filtered Casorati matrix along the time dimension and reconstructed using a Fast Flourier Transform (FFT)-based algorithm. The reconstruction PA images cover a region of 38.4 mm × 10 mm.
Fig. 3.
Fig. 3.
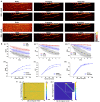
Numerical experiments comparing spatiotemporal SVD (STSVD) and frame averaging on simulated vascular data without slow movements. a. Noisy and denoised photoacoustic (PA) images by STSVD and corresponding averaged and noise-free images. Two typical noise levels at −10 dB and −15 dB respectively were compared. b. Quantitative analysis of STSVD and frame averaging in terms of peak-to-noise ratio (PSNR), edge preservation index (EPI), and structural similarity index measure (SSIM). (i)-(iii) reported the quantitative results of STSVD against different numbers of singular value components (SVCs) for signal reconstruction and frame averaging (dotted lines) using simulated vascular data at three noisy levels; 75 frames were used both for STSVD and averaging. (iv)-(vi) showed the quantitative results of STSVD and frame averaging against different numbers of frames using simulated vascular data at the middle noisy level (−10 dB in SNR). Data of STSVD in (i)-(vi) and averaging in (iv)-(vi) represent mean values with shades denoting standard deviations. c. Temporal (i) and spatial criteria (ii) for rank selection for simulated vascular data without motions. All PA images share the same scale bar of 5 mm.
Fig. 4.
Fig. 4.
Numerical experiments comparing spatiotemporal SVD (STSVD) and frame averaging on simulated vascular data with slow movements. a. Noisy and denoised photoacoustic (PA) images at t1 and t2 by STSVD and corresponding averaged and noise-free images; noise level: −10 dB in SNR. b. Quantitative analysis of STSVD and frame averaging in terms of peak-to-noise ratio (PSNR), edge preservation index (EPI), and structural similarity index measure (SSIM). (i)-(iii) reported the quantitative results of STSVD against different numbers of singular value components (SVCs) for signal reconstruction and frame averaging (dotted lines) using simulated vascular data at three noisy levels; 75 frames were used both for STSVD and averaging. (iv)-(vi) showed the quantitative results of STSVD and frame averaging against different numbers of frames using simulated vascular data at the middle noisy level (−10 dB in SNR). Data of STSVD in (i)-(vi) and averaging in (iv)-(vi) represent mean values with shades denoting standard deviations. c. Temporal (i) and spatial criteria (ii) for rank selection for simulated vascular data with motions. All PA images share the same scale bar of 5 mm.
Fig. 5.
Fig. 5.
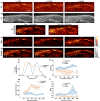
In vivo comparison using human finger data. (a) Three noisy photoacoustic (PA) frames, (b) corresponding ultrasound (US) frames, (c) frame averaging PA denoising, (d) discrete wavelet transform (DWT) PA denoising, and (e) spatiotemporal SVD (STSVD) PA denoising (see Visualization 1). Comparison of real-time PA image frames acquired from a human finger before and after spatiotemporal SVD denoising and corresponding US image frames). (f) Axial profiles drawn along the white lines marked in the denoised PA image by spatiotemporal SVD and the corresponding averaged image. (g)-(i) Quantitative performance of frame averaging and STSVD in terms of axial resolution at the vessel edges, signal-to-noise ratio (SNR), and contrast-to-noise ratio (CNR). Data of averaging and STSVD in (g)-(i) represent average values with shades denoting standard deviations. SNR and CNR values of DWT in (h)-(i) represent average values with error bars denoting standard deviations. PA and US images share the same scale bar of 5 mm.
Fig. 6.
Fig. 6.
Comparison of spatiotemporal SVD, discrete wavelet transform (DWT), and averaging for photoacoustic (PA) denoising with 3D scanning of the human forearm in vivo. (a) The experimental set-up with the right forearm of a healthy volunteer imaged in water. (b, c) Maximum intensity projections (MIPs) of the reconstructed 3D PA volumes onto XY-plane (b) and ZY-plane (c) with the depth Z ranging from 5 mm to 25 mm.

Similar articles

Cited by

References

    1. Beard P., “Biomedical photoacoustic imaging,” Interface Focus. 1(4), 602–631 (2011).10.1098/rsfs.2011.0028 - DOI - PMC - PubMed
    1. Tzoumas S., Rosenthal A., Lutzweiler C., Razansky D., Ntziachristos V., “Spatiospectral denoising framework for multispectral optoacoustic imaging based on sparse signal representation,” Med. Phys. 41(11), 113301 (2014).10.1118/1.4893530 - DOI - PubMed
    1. Zhang C., Maslov K. I., Yao J., Wang L. V., “In vivo photoacoustic microscopy with 7.6-µm axial resolution using a commercial 125-MHz ultrasonic transducer,” J. Biomed. Opt. 17(11), 1 (2012).10.1117/1.JBO.17.11.116016 - DOI - PMC - PubMed
    1. Holan S. H., Viator J. A., “Automated wavelet denoising of photoacoustic signals for circulating melanoma cell detection and burn image reconstruction,” Phys. Med. Biol. 53(12), N227 (2008).10.1088/0031-9155/53/12/N01 - DOI - PubMed
    1. Ermilov S. A., Khamapirad T., Conjusteau A., Leonard M. H., Lacewell R., Mehta K., Miller T., Oraevsky A. A., “Laser optoacoustic imaging system for detection of breast cancer,” J. Biomed. Opt. 14(2), 024007 (2009).10.1117/1.3086616 - DOI - PubMed

LinkOut - more resources