In Vivo Assessment and Monitoring of Burn Wounds Using a Handheld Terahertz Hyperspectral Scanner
- PMID: 36589697
- PMCID: PMC9797155
- DOI: 10.1002/adpr.202100095
In Vivo Assessment and Monitoring of Burn Wounds Using a Handheld Terahertz Hyperspectral Scanner
Abstract
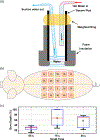
The accuracy of clinical assessment techniques in diagnosing partial-thickness burn injuries has remained as low as 50-76%. Depending on the burn depth and environmental factors in the wound, such as reactive oxygen species, inflammation, and autophagy, partial-thickness burns can heal spontaneously or require surgical intervention. Herein, it is demonstrated that terahertz time-domain spectral imaging (THz-TDSI) is a promising tool for in vivo quantitative assessment and monitoring of partial-thickness burn injuries in large animals. We used a novel handheld THz-TDSI scanner to characterize burn injuries in a porcine scald model with histopathological controls. Statistical analysis (n= 40) indicates that the THz-TDSI modality can accurately differentiate between partial-thickness and full-thickness burn injuries (1-way ANOVA, p< 0.05). THz-TDSI has the potential to improve burn care outcomes by helping surgeons in making objective decisions for early excision of the wound.
Keywords: burn imaging; handheld THz-TDS scanner; histology; partial-thickness burn characterization; skin tissue hyperspectral imaging; terahertz time-domain spectroscopy.
Conflict of interest statement
Conflict of Interest MHA discloses intellectual property owned by the University of Washington, US Patent No. US9295402B1.[60]
Figures


Similar articles
-
Supervised machine learning for automatic classification of in vivo scald and contact burn injuries using the terahertz Portable Handheld Spectral Reflection (PHASR) Scanner.Sci Rep. 2022 Mar 24;12(1):5096. doi: 10.1038/s41598-022-08940-4. Sci Rep. 2022. PMID: 35332207 Free PMC article.
-
Accurate and early prediction of the wound healing outcome of burn injuries using the wavelet Shannon entropy of terahertz time-domain waveforms.J Biomed Opt. 2022 Nov;27(11):116001. doi: 10.1117/1.JBO.27.11.116001. J Biomed Opt. 2022. PMID: 36348509 Free PMC article.
-
Deep neural network classification of in vivo burn injuries with different etiologies using terahertz time-domain spectral imaging.Biomed Opt Express. 2022 Mar 3;13(4):1855-1868. doi: 10.1364/BOE.452257. eCollection 2022 Apr 1. Biomed Opt Express. 2022. PMID: 35519269 Free PMC article.
-
THz Imaging of Skin Burn: Seeing the Unseen-An Overview.Adv Wound Care (New Rochelle). 2016 Aug 1;5(8):338-348. doi: 10.1089/wound.2015.0685. Adv Wound Care (New Rochelle). 2016. PMID: 27602253 Free PMC article. Review.
-
Research Advances in Terahertz Technology for Skin Detection.Photobiomodul Photomed Laser Surg. 2025 Jan;43(1):1-7. doi: 10.1089/photob.2024.0079. Photobiomodul Photomed Laser Surg. 2025. PMID: 39841526 Review.
Cited by
-
Supervised machine learning for automatic classification of in vivo scald and contact burn injuries using the terahertz Portable Handheld Spectral Reflection (PHASR) Scanner.Sci Rep. 2022 Mar 24;12(1):5096. doi: 10.1038/s41598-022-08940-4. Sci Rep. 2022. PMID: 35332207 Free PMC article.
-
Robotically Controlled Terahertz Probe for In Vivo Skin Evaluation: Imaging with the PicoBot.J Infrared Millim Terahertz Waves. 2025;46(6):36. doi: 10.1007/s10762-025-01055-7. Epub 2025 May 30. J Infrared Millim Terahertz Waves. 2025. PMID: 40452865 Free PMC article.
-
Multiresolution spectrally-encoded terahertz reflection imaging through a highly diffusive cloak.Opt Express. 2022 Aug 29;30(18):31550-31566. doi: 10.1364/OE.463599. Opt Express. 2022. PMID: 36242235 Free PMC article.
-
[Strengthening the development and application of precision burn medicine].Zhonghua Shao Shang Yu Chuang Mian Xiu Fu Za Zhi. 2023 Jul 20;39(7):612-617. doi: 10.3760/cma.j.cn501225-20230407-00116. Zhonghua Shao Shang Yu Chuang Mian Xiu Fu Za Zhi. 2023. PMID: 37805689 Free PMC article. Chinese.
-
Triage of in vivo burn injuries and prediction of wound healing outcome using neural networks and modeling of the terahertz permittivity based on the double Debye dielectric parameters.Biomed Opt Express. 2023 Jan 30;14(2):918-931. doi: 10.1364/BOE.479567. eCollection 2023 Feb 1. Biomed Opt Express. 2023. PMID: 36874480 Free PMC article.
References
-
- Rui P, Kang K, National Hospital Ambulatory Medical Care Survey: 2017 Emergency Department Tummary Tables, US Department of Health and Human Services, Centers for Disease Control, Hyattsville, MD: 2017.
-
- Kim DE, Phillips TM, Jeng JC, Rizzo AG, Roth RT, Stanford JL, Jablonski KA, Jordan MH, J. Burn Care Rehabil. 2001, 22, 406. - PubMed
-
- Ward PA, Till GO, J. Trauma 1990, 30, S75. - PubMed
-
- Atiyeh BS, Gunn SW, Hayek SN, World J. Surg. 2005, 29, 131. - PubMed
Grants and funding
LinkOut - more resources
Full Text Sources
