. 2022 Dec 16:10:993580.
doi: 10.3389/fcell.2022.993580. eCollection 2022.

Construction of a prognostic assessment model for colon cancer patients based on immune-related genes and exploration of related immune characteristics

Affiliations

Construction of a prognostic assessment model for colon cancer patients based on immune-related genes and exploration of related immune characteristics

Yanhua Wan et al. Front Cell Dev Biol. .

Abstract

Objectives: To establish a novel risk score model that could predict the survival and immune response of patients with colon cancer. Methods: We used The Cancer Genome Atlas (TCGA) database to get mRNA expression profile data, corresponding clinical information and somatic mutation data of patients with colon cancer. Limma R software package and univariate Cox regression were performed to screen out immune-related prognostic genes. GO (Gene ontology) and KEGG (Kyoto Encyclopedia of Genes and Genomes) were used for gene function enrichment analysis. The risk scoring model was established by Lasso regression and multivariate Cox regression. CIBERSORT was conducted to estimate 22 types of tumor-infiltrating immune cells and immune cell functions in tumors. Correlation analysis was used to demonstrate the relationship between the risk score and immune escape potential. Results: 679 immune-related genes were selected from 7846 differentially expressed genes (DEGs). GO and KEGG analysis found that immune-related DEGs were mainly enriched in immune response, complement activation, cytokine-cytokine receptor interaction and so on. Finally, we established a 3 immune-related genes risk scoring model, which was the accurate independent predictor of overall survival (OS) in colon cancer. Correlation analysis indicated that there were significant differences in T cell exclusion potential in low-risk and high-risk groups. Conclusion: The immune-related gene risk scoring model could contribute to predicting the clinical outcome of patients with colon cancer.

Keywords: colon cancer; immune cell infiltration; immune escape; immune-related gene; risk model.


Conflict of interest statement

The authors declare that the research was conducted in the absence of any commercial or financial relationships that could be construed as a potential conflict of interest.

Figures
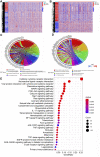
FIGURE 1
FIGURE 1
Results of differential gene analysis and enrichment analysis. (A) The heat map of the differentially expressed genes (DEGs). (B) The heat map of the immune-related DEGs. The horizontal axis is the sample. The vertical axis is different genes. Red indicated the high expression of the gene. Blue indicated the low expression of the gene. (C) The Circos plot of the main GO term for immune-related DEGs enrichment. (D) The Circos plot of the main KEGG signaling pathways for immune-related DEGs enrichment. (E) The bubble plot of the main KEGG pathways. The horizontal axis of the map indicated the gene ratio. The longitudinal axis indicated the names of each pathway.
FIGURE 2
FIGURE 2
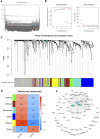
WGCNA co-expression model (A) The tree diagram of gene cluster analysis. (B) Left: Analysis of the scale free topology model fit for various soft threshold powers. Red line indicated Scale Free Topology Model Fit, signed R2 was 0.90. Right: Mean connectivity analysis of various soft threshold powers. (C) Gene dendrogram and module colors. (D) Heatmap of the correlation between modules and samples traits. The numbers in each square indicated the Pearson correlation coefficient (up) and p value (down). (E) Interaction network of genes in the grey module.
FIGURE 3
FIGURE 3
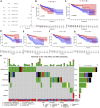
Identification of prognostic immune-related genes in colon cancer (A) The forest map of 6 immune-related genes significantly associated with colon cancer prognosis. (B–G) Kaplan Meier survival curves of colon cancer samples with different expression levels of 6 immune-related prognostic genes. (H) The waterfall plot of mutation types of prognostic genes in colon cancer patients.
FIGURE 4
FIGURE 4
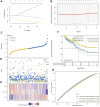
Establishment of prognostic risk model. (A) The coefficients of the selected features are shown by the lambda parameter, with the abscissa representing the value of the independent variable lambda and the ordinate representing the coefficient of the independent variable. (B) Partial likelihood deviations were plotted against log(λ) using the LASSO Cox regression model. (C) The risk score distribution between the low-risk and high-risk groups. (D) The survival status and survival time of patients in the low-risk and high-risk groups. (E) Risk-related heatmap of three immune-related genes in risk model. (F) The Kaplan-Meier survival curve of colon cancer samples in the low-risk and high-risk groups. (G) ROC curve of the prognostic signature to evaluate the accuracy.
FIGURE 5
FIGURE 5
Verification of risk model and differential landscape of somatic mutation burden in the low-risk and high-risk groups (A) The Kaplan-Meier survival curve of colon cancer samples in GSE40967 dataset. (B) ROC curve of the test set. (C) The forest plot of multivariate cox regression analysis. (D) GSEA showed five pathways enriched in the low-risk group. (E) The waterfall plot of mutation details and tumor mutation burden (TMB) for each colon cancer patient sample in the high-risk group. (F) The waterfall plot of mutation details and tumor mutation burden for each colon cancer patient sample in the low-risk group.
FIGURE 6
FIGURE 6
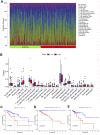
Infiltration characteristics of immune cells. (A) The bar plot of the percentage of 22 immune cell subtypes in each colon cancer sample. (B) The box plot of differences in infiltration of 22 types of immune cells in low-risk and high-risk groups. (C–E) The Kaplan-Meier survival curve of colon cancer patients with different levels of plasma cells, T cells CD4 memory resting and Macrophage M1.
FIGURE 7
FIGURE 7
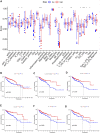
Characteristics of immune function in different risk groups (A) The box plot of risk scores of immune cells and immune functions in low-risk and high-risk groups. The overall survival rate of different levels of iDCs (B), T cell co-stimulation (C), Th1 cells (D), Th2 cells (E), TIL (F) and Treg (G).
FIGURE 8
FIGURE 8
Correlation analysis of clinical characteristics in different risk groups (A) The scatterplot of correlation analysis of risk score and CD274 gene expression. (B) The scatterplot of correlation analysis of risk score and TMB. (C) The box plot of the analysis of differences in CD274 gene expression in low-risk and high-risk groups. (D) The box plot of the analysis of differences in TMB in low-risk and high-risk groups. (E) The heat map of clinical characteristics in low-risk and high-risk groups. (F) The quadrangle map of the analysis of differences in ages in IRGPI-low and IRGPI-high groups.
FIGURE 9
FIGURE 9
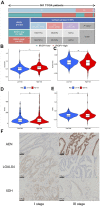
Correlation analysis of immune escape potential in different risk groups and immunohistochemical validation results (A) The quadrangle map of the analysis of differences in immune subtypes in IRGPI-low and IRGPI-high groups. (B) The violin plot of analysis of differences in T cells exclusion in low-risk and high-risk groups. (C) The violin plot of analysis of differences in T cells dysfunction in low-risk and high-risk groups. (D) The violin plot of analysis of differences in interferon gamma (IFNG) in low-risk and high-risk groups. (E) The violin plot of analysis of differences in Tumor Immune Dysfunction and Exclusion (TIDE) in low-risk and high-risk groups. (F) Immunohistochemical results of expression of AEN, LGALS4 and XDH in stage I and stage III colon cancer patients. p < 0.05.

Similar articles

Cited by

References

    1. Aran D., Lasry A., Zinger A., Biton M., Pikarsky E., Hellman A., et al. (2016). Widespread parainflammation in human cancer. Genome Biol. 17 (1), 145. PubMed PMID: 27386949. 10.1186/s13059-016-0995-z - DOI - PMC - PubMed
    1. Beatty G. L., Gladney W. L. (2015). Immune escape mechanisms as a guide for cancer immunotherapy. Clin. Cancer Res. 21 (4), 687–692. PubMed PMID: 25501578. 10.1158/1078-0432.CCR-14-1860 - DOI - PMC - PubMed
    1. Belo A. I., van der Sar A. M., Tefsen B., van Die I. (2013). Galectin-4 reduces migration and metastasis formation of pancreatic cancer cells. PLoS One 8 (6), e65957. PubMed PMID: 23824659. 10.1371/journal.pone.0065957 - DOI - PMC - PubMed
    1. Bray F., Ferlay J., Soerjomataram I., Siegel R. L., Torre L. A., Jemal A. (2018). Global cancer statistics 2018: GLOBOCAN estimates of incidence and mortality worldwide for 36 cancers in 185 countries. Ca. Cancer J. Clin. 68 (6), 394–424. PubMed PMID: 30207593. 10.3322/caac.21492 - DOI - PubMed
    1. Chen L., Flies D. B. (2013). Molecular mechanisms of T cell co-stimulation and co-inhibition. Nat. Rev. Immunol. 13 (4), 227–242. PubMed PMID: 23470321. 10.1038/nri3405 - DOI - PMC - PubMed

LinkOut - more resources