. 2022 Dec 28;8(12):1683-1694.
doi: 10.1021/acscentsci.2c01032. Epub 2022 Dec 5.

Stable Isotopomers of myo- Inositol Uncover a Complex MINPP1-Dependent Inositol Phosphate Network

Affiliations

Stable Isotopomers of myo- Inositol Uncover a Complex MINPP1-Dependent Inositol Phosphate Network

Minh Nguyen Trung et al. ACS Cent Sci. .

Abstract

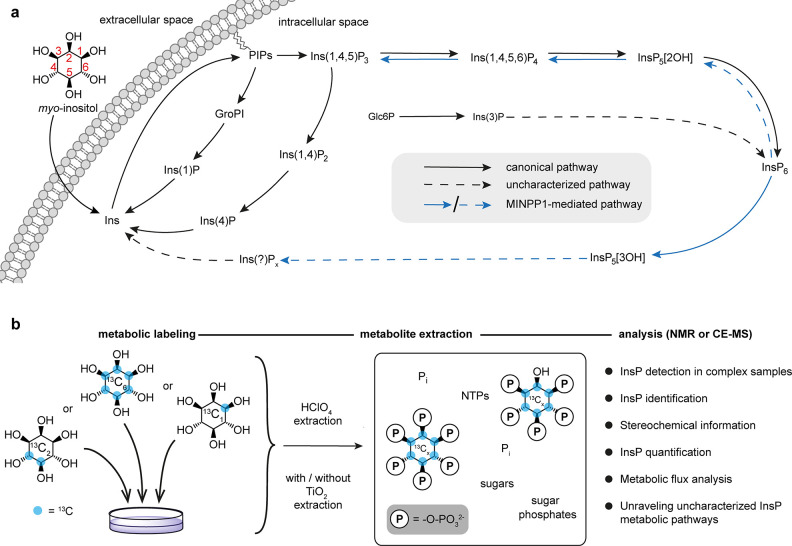
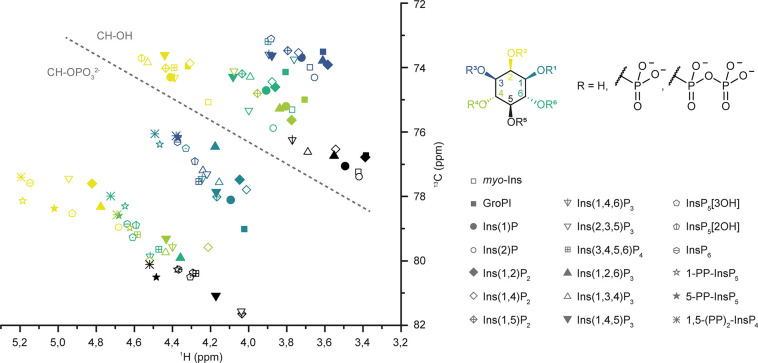
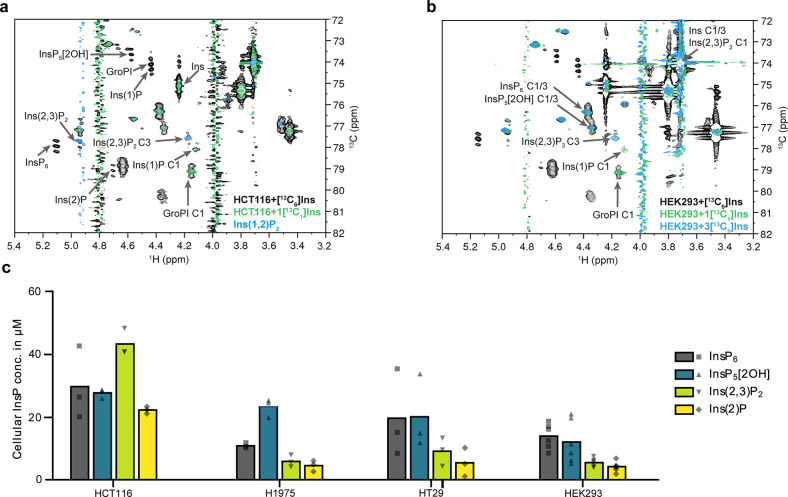
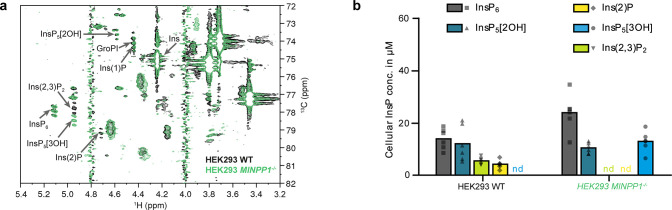
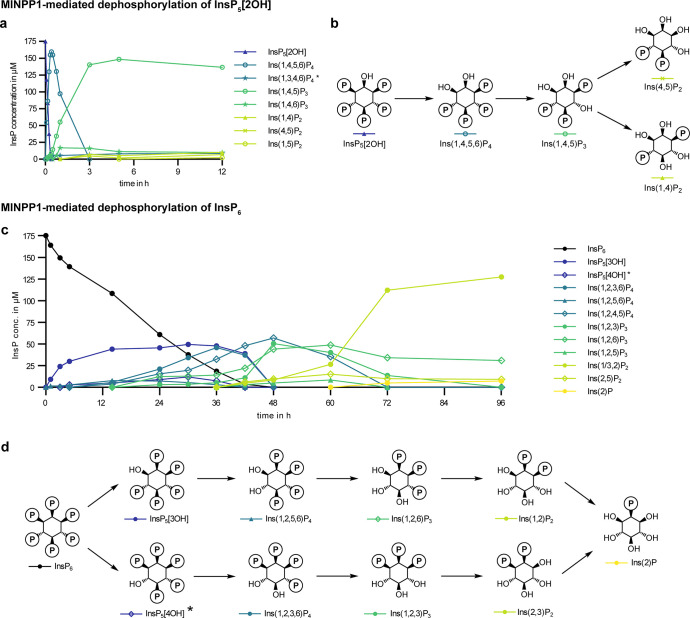
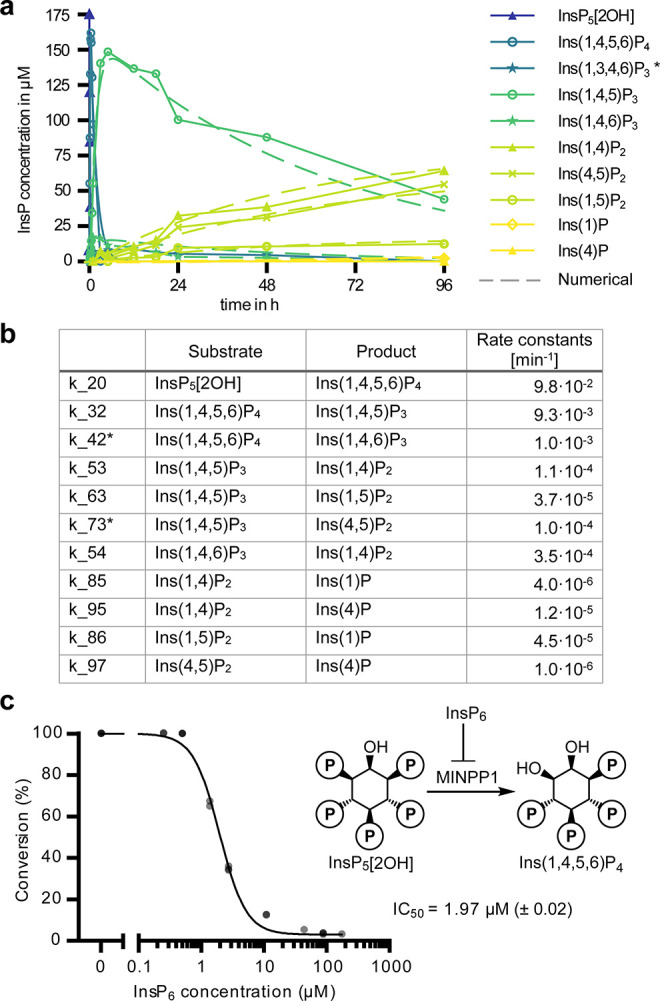
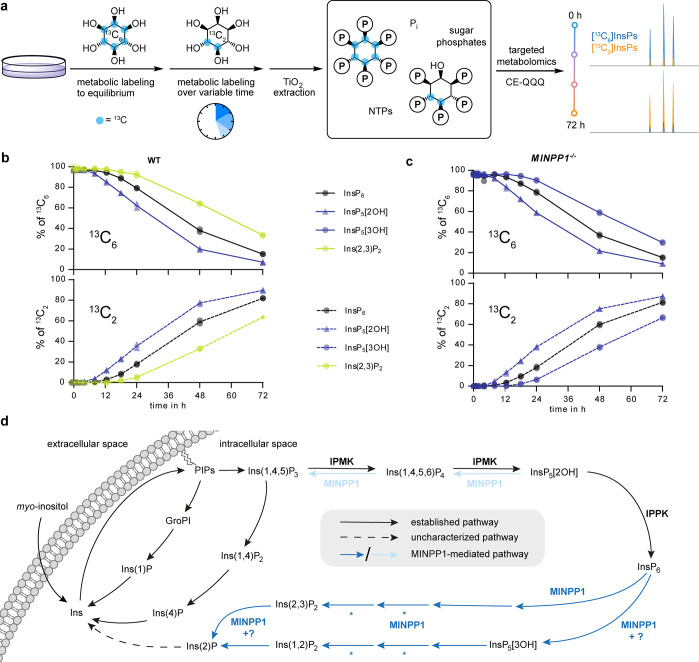
The water-soluble inositol phosphates (InsPs) represent a functionally diverse group of small-molecule messengers involved in a myriad of cellular processes. Despite their centrality, our understanding of human InsP metabolism is incomplete because the available analytical toolset to characterize and quantify InsPs in complex samples is limited. Here, we have synthesized and applied symmetrically and unsymmetrically 13C-labeled myo-inositol and inositol phosphates. These probes were utilized in combination with nuclear magnetic resonance spectroscopy (NMR) and capillary electrophoresis mass spectrometry (CE-MS) to investigate InsP metabolism in human cells. The labeling strategy provided detailed structural information via NMR-down to individual enantiomers-which overcomes a crucial blind spot in the analysis of InsPs. We uncovered a novel branch of InsP dephosphorylation in human cells which is dependent on MINPP1, a phytase-like enzyme contributing to cellular homeostasis. Detailed characterization of MINPP1 activity in vitro and in cells showcased the unique reactivity of this phosphatase. Our results demonstrate that metabolic labeling with stable isotopomers in conjunction with NMR spectroscopy and CE-MS constitutes a powerful tool to annotate InsP networks in a variety of biological contexts.


Conflict of interest statement

The authors declare no competing financial interest.

Figures

Figure 1
Figure 1
Probing InsP metabolism with myo-inositol isotopomers. (a) Simplified overview of InsP metabolism with MINPP1-mediated processes highlighted. It is assumed that MINPP1 dephosphorylates InsP6 and various other InsPs down to sparsely annotated InsP3 isomers. PIPs, phosphatidylinositol phosphates; GroPI, glycerophosphoinositol; Glc6P, glucose-6-phosphate; MINPP1, multiple inositol polyphosphate phosphatase1; Ins(X,Y)Pz, myo-inositol with z phosphoryl groups at positions X,Y; InsP5[XOH], inositol pentakisphosphate with a hydroxyl group at position X. IUPAC numbering convention of the positions on the inositol scaffold is shown in red. (b) Workflow for the analysis of cellular InsP pools through metabolic labeling: human cells are grown in medium devoid of nonlabeled myo-inositol but supplemented with an isotopomer of myo-inositol ([13C6]Ins, 4,5[13C2]myo-inositol, 1[13C1]myo-inositol, or 3[13C1]myo-inositol) which are incorporated into the cellular InsP pool. Metabolites are then extracted, resulting in a complex sample containing all water-soluble biomolecules, such as nucleotide triphosphates (NTPs), inorganic phosphate (Pi), and the labeled InsPs. This mixture can be analyzed via NMR or CE-MS exploiting NMR activity and mass difference of the 13C label.
Figure 2
Figure 2
HMQC signals of InsPs with different phosphorylation patterns cluster systematically. Collection of BIRD-{1H,13C}HMQC NMR data of various InsP standards in metabolic extract buffer conditions (saturated KClO4 in D2O, pH* 6.0). HMQC signals of different InsPs are represented with symbols, while the position on the inositol ring is color-coded. HMQC signals cluster together depending on phosphorylation status (dotted line) and position on the inositol ring. CH groups bearing the pyrophosphate moiety of PP-InsPs or the 1-glyceryl phosphate group of GroPI cluster with the phosphorylated CH groups and were treated accordingly for creating bagplots (Figure S1).
Figure 3
Figure 3
Identification and quantification of major InsPs in human cells. (a) Overlay of BIRD-{1H,13C}HMQC-NMR spectra of metabolic extracts from HCT116 cells which were labeled with either [13C6]myo-inositol (black spectrum) or 1[13C1]myo-inositol (green) and a reference spectrum of Ins(1,2)P2 (blue). Annotation of identified InsPs was limited to the most important signals for clarity. Complete annotation is provided in Figure S2. (b) Overlay of BIRD-{1H,13C}HMQC-NMR spectra of metabolic extracts from HEK293 cells which were labeled with [13C6]myo-inositol (black), 1[13C1]myo-inositol (green), or 3[13C1]myo-inositol (blue). Annotation was limited to C1/3 positions for clarity. 1[13C1]myo-inositol-labeled 1 positions of GroPI and Ins(1)P confirm their enantiomeric identity. In contrast, the phosphorylated 3 position of Ins(2,3)P2 is confirmed by labeling with 3[13C1]myo-inositol. (c) Scatter dot plot of quantified InsPs from metabolic extracts of various cells (HCT116, n = 3; H1975, n = 3; HT29, n = 3; HEK293, n = 6, biological replicates) with bars representing the means.
Figure 4
Figure 4
Identification of InsPs in HEK293 and MINPP1–/– HEK293 cells. (a) Overlay of [13C6]myo-inositol-labeled HEK293 (black) and MINPP1–/– HEK293 cells (green). Ins(2,3)P2 and Ins(2)P are not observable in MINPP1–/– cells; instead, InsP5[3OH] accumulates. (b) Scatter dot plot of quantified InsPs from these cell lines (WT, n = 6 same data as in Figure 3c for illustrative purposes; MINPP1–/–, n = 6, biological replicates). Bars represent the means, nd = not detected. Enantiomer-specific identification of InsP5[3OH] is shown in Figure S6.
Figure 5
Figure 5
Dephosphorylation of InsP5[2OH] and InsP6 by MINPP1 in vitro. (a) Progress curves of MINPP1 reaction with 175 μM [13C6]InsP5[2OH] showing the first 12 h of the reaction (for full scope of progress curves and progress curves at 50 μM substrate concentration see SI). Progress curves shown here are representative of two replicates. (b) Simplified reaction scheme of the MINPP1-mediated dephosphorylation of InsP5[2OH]. Complete reaction scheme that includes all minor intermediates is in Figure S10. (c) Progress curves of MINPP1 reaction with 175 μM [13C6]InsP6 with simplified reaction scheme depicting the two main reaction paths. Progress curves shown here are representative of two replicates. Corresponding progress curve for 50 μM substrate concentration in Figure S13. (d) Simplified reaction scheme for the dephosphorylation of InsP6. Complete reaction scheme that includes all intermediates is in Figure S11. Note that the two enantiomers Ins(1,2)P2 and Ins(2,3)P2 are quantified together. (*) Structure of these InsPs could not be assigned with certainty due to low abundance and interference of more abundant signals.
Figure 6
Figure 6
Numerical assessment of MINPP1 reaction rates. (a) Experimental and numerically approximated progress curves of MINPP1 dephosphorylation reactions with 175 μM InsP5[2OH]. Solid lines represent the experimental data (same data as in Figure 5a). Dashed lines represent the progress curves predicted by the numerically determined reaction rates. (b) Numerically determined reaction rates representative of two replicates. Reaction rates marked with an asterisk (*) are subject to constraints. SI also includes attempted numerical approximation of the MINPP1 reaction with InsP6. (c) Demonstration that InsP6 can inhibit dephosphorylation of InsP5[2OH] (175 μM) by MINPP1 (0.5 μM) with high potency. IC50 value is reported with standard error of log10 IC50 in brackets.
Figure 7
Figure 7
Metabolic flux analysis via time-dependent isotopic exchange of InsPs in HEK293 and MINPP1–/– HEK293 cells. (a) General workflow of the metabolic flux analysis. (b and c) Ratios of 6-fold 13C-labeled and doubly 13C-labeled InsPs HEK293 (b) and MINPP1–/– HEK293 (c) cells in TiO2-extracted cell lysates. Data of two biological replicates are plotted individually, and means are connected with lines. All extracts contained a constant ∼3% of nonlabeled InsP species, likely stemming from de novo inositol synthesis (Figure S16). Ins(2,3)P2 in MINPP1–/– cells and InsP5[3OH] in WT cells were below the limit of detection. (d) Updated overview of MINPP1-mediated InsP metabolism in human cells. As shown in this work, MINPP1 can dephosphorylate both InsP6 (blue arrows) and InsP5[2OH] (light blue arrows) via through two distinct, nonoverlapping metabolic pathways. Question mark hints toward unidentified phosphatase activities, which might explain the accumulation of InsP5[3OH] observed in MINPP1–/– cells or how Ins(2,3)P2 accumulates selectively in cells while both enantiomers are generated in vitro. Asterisks indicate that we cannot rule out the existence of additional phosphatases that might assist MINPP1-mediated dephosphorylation of InsP6.

References

    1. Watson P. J.; Fairall L.; Santos G. M.; Schwabe J. W. R. Structure of HDAC3 Bound to Co-Repressor and Inositol Tetraphosphate. Nature 2012, 481 (7381), 335–340. 10.1038/nature10728. - DOI - PMC - PubMed
    1. Wang Q.; Vogan E. M.; Nocka L. M.; Rosen C. E.; Zorn J. A.; Harrison S. C.; Kuriyan J. Autoinhibition of Bruton’s Tyrosine Kinase (Btk) and Activation by Soluble Inositol Hexakisphosphate. Elife 2015, 4, e06074.10.7554/eLife.06074. - DOI - PMC - PubMed
    1. Blind R. D. Structural Analyses of Inositol Phosphate Second Messengers Bound to Signaling Effector Proteins. Adv. Biol. Regul. 2020, 75, 100667.10.1016/j.jbior.2019.100667. - DOI - PMC - PubMed
    1. Kanehisa M. Toward Understanding the Origin and Evolution of Cellular Organisms. Protein Sci. 2019, 28 (11), 1947–1951. 10.1002/pro.3715. - DOI - PMC - PubMed
    1. Irvine R. F.; Schell M. J. Back in the Water: The Return of the Inositol Phosphates. Nat. Rev. Mol. Cell Biol. 2001, 2 (5), 327–338. 10.1038/35073015. - DOI - PubMed