. 2022 Oct;1(10):933-945.
doi: 10.1038/s44161-022-00133-6. Epub 2022 Oct 6.

Fat infiltration in the infarcted heart as a paradigm for ventricular arrhythmias

Affiliations

Fat infiltration in the infarcted heart as a paradigm for ventricular arrhythmias

Eric Sung et al. Nat Cardiovasc Res. 2022 Oct.

Abstract

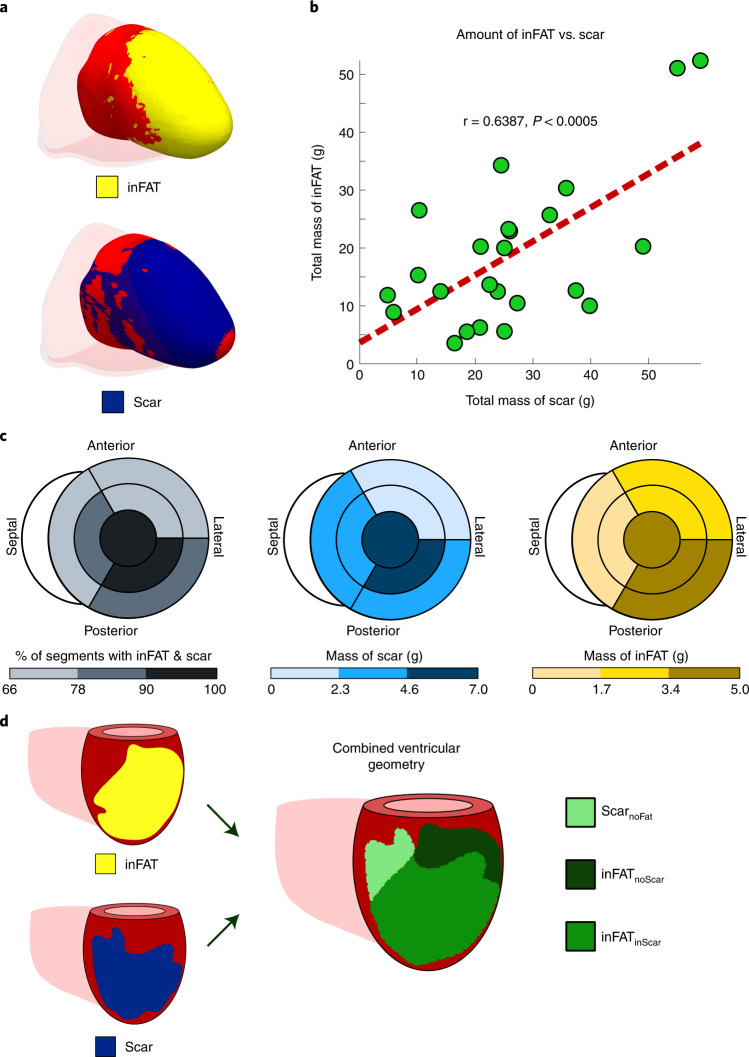
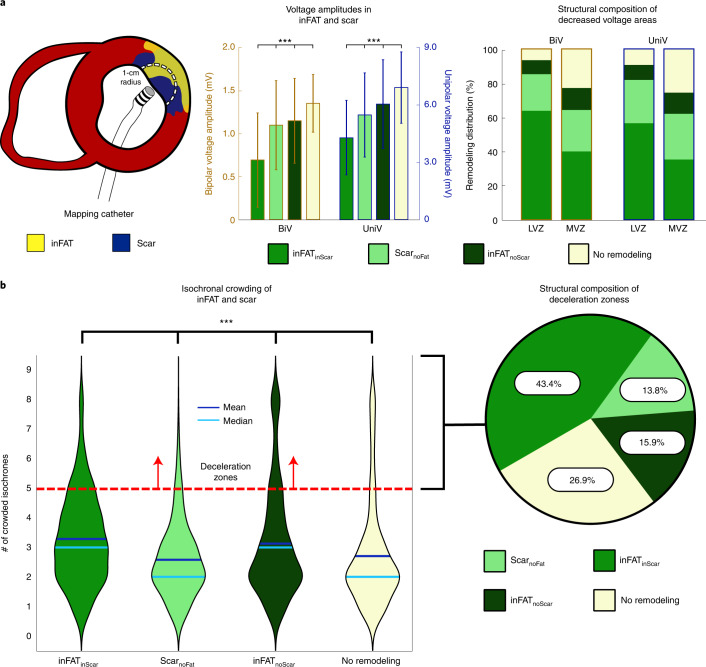
Infiltrating adipose tissue (inFAT) has been recently found to co-localize with scar in infarcted hearts and may contribute to ventricular arrhythmias (VAs), a life-threatening heart rhythm disorder. However, the contribution of inFAT to VA has not been well-established. We investigated the role of inFAT versus scar in VA through a combined prospective clinical and mechanistic computational study. Using personalized computational heart models and comparing the results from simulations of VA dynamics with measured electrophysiological abnormalities during the clinical procedure, we demonstrate that inFAT, rather than scar, is a primary driver of arrhythmogenic propensity and is frequently present in critical regions of the VA circuit. We determined that, within the VA circuitry, inFAT, as opposed to scar, is primarily responsible for conduction slowing in critical sites, mechanistically promoting VA. Our findings implicate inFAT as a dominant player in infarct-related VA, challenging existing paradigms and opening the door for unexplored anti-arrhythmic strategies.


Conflict of interest statement

Competing interests The authors declare no competing interests.

Figures

Fig. 1
Fig. 1. Overview of study.
Schematic illustrating the combined two-center prospective clinical and mechanistic computational heart study. EP, electrophysiologcal.
Fig. 2
Fig. 2. Distributions of inFAT and scar.
a, Example of overlap between inFAT and scar distribution in a heart with an anterior infarct. b, Relationship between the total amount of scar and the total amount of inFAT across the patient cohort. Green dots represent data from individual patient hearts; in red is the line of best fit. c, Relationship between scar and inFAT distributions across different anatomical regions. The bullseye diagram shows a short-axis view (looking upward from below the heart). For each bullseye diagram, the outer and middle rings represent the three basal and middle segments, respectively (anterior/anterolateral, inferior/inferolateral and septal). The central segment represents the apex. The left panel shows the percentage of segments with both inFAT and scar; the middle and right panels show the mass of scar and inFAT across regions. d, Schematic of definitions for overlapping and non-overlapping regions between inFAT and scar. Three regions were defined: (1) inFAT and scar overlap (inFATinScar); (2) scar not overlapping with inFAT (ScarnoFat); and (3) inFAT not overlapping with scar (inFATnoScar).
Fig. 3
Fig. 3. Distributions of clinically measured electrophysiological abnormalities in the ventricular geometries.
a, Voltage amplitudes in the different types of regions. The left panel shows a schematic of how comparisons were made between EAM data and tissue content. An EAM catheter is used to record real-time, electrical signals along the myocardial surface. The circle of 1-cm radius represents the amount of myocardium around each EAM point that was considered. The middle panel shows the BiV and UniV in the regions of inFATinScar ScarnoFat and inFATnoScar. The right panel shows the scar and inFAT composition of decreased voltage areas (LVZs and MVZs) defined by both BiV and UniV cutoffs. b, Isochronal crowding within regions of inFAT and scar. The left panel shows violin plots that describe the distribution of isochronal crowding within regions of inFATinScar, ScarnoFat, inFATnoScar and no remodeling. The right panel shows the structural composition of DZs defined as ≥5 crowded isochrones.
Fig. 4
Fig. 4. Arrhythmogenicity of inFAT versus scar.
Number and distribution of VTs across the three different heart models. NS, not significant.
Fig. 5
Fig. 5. Most VT critical isthmuses comprise both inFAT and scar.
a, Example of two VT circuits from hybrid CT-MRI models with isthmuses consisting of both inFAT and scar. Arrows trace the VT circuit from the exit site to the common pathway. Dashed circles denote the location of the critical isthmus. b, Example of a VT circuit from an LGE-based heart model. The inFAT distribution, superimposed from CE-CT, is displayed in the right panel.
Fig. 6
Fig. 6. inFAT promotes conduction abnormalities in critical sites of the VT circuitry.
Three examples of VT circuits in hybrid CT-MRI heart models with the overlapping clinical ablations and DZs are displayed. For these three VT circuits, there was inFAT but little to no fibrosis present. Arrows trace the re-entrant pathway from the exit site to the end of the common pathway. The pink regions denote the DZs, and the dark red denotes the estimated volume of the ablation lesion. Non-activated tissues were omitted for the bottom VT circuit to better visualize the intramural activation sequence.
Extended Data Fig. 1
Extended Data Fig. 1. Examples of electrograms in different tissue regions.
Top and bottom rows show unipolar and bipolar electrograms, respectively, recorded from tissue without remodeling, inFATnoScar, ScarnoFat, and inFATinScar. Note that the y-axis for both unipolar and bipolar electrogram recordings for tissue without remodeling is considerably different than the other y-axes. Electrogram recordings from inFATnoScar, ScarnoFat, and inFATinScar generally showed diminished voltage amplitude as compared to tissues without remodeling. Note that the bipolar electrogram recorded in inFATinScar exhibits a complex pattern of activity, consistent with the presence of conduction abnormalities.
Extended Data Fig. 2
Extended Data Fig. 2. Example showing how deceleration zones localize to regions of inFAT.
Left panel shows a voltage map, catheter ablations (dark red), and inFAT co-registered. Middle panel shows the left panel with the overlayed scar distribution. Right panel shows the sinus rhythm activation sequence with overlayed deceleration zones (pink). Deceleration zones localize to regions where inFAT is present.
Extended Data Fig. 3
Extended Data Fig. 3. Distribution of ventricular tachycardias across the different heart models.
The x-axis shows the number of VTs and the y-axis shows the number of models with that number of VTs. (n = 95 CT-based models, n = 97 LGE-based models, n = 140 hybrid CT-MRI models). CT: computed tomography, LGE: late gadolinium-enhanced, VT: ventricular tachycardia.
Extended Data Fig. 4
Extended Data Fig. 4. Representative examples showing the distinction between inFAT and mEAT.
Epicardial and endocardial segmentation contours are shown. Epicardial contours were specifically drawn to exclude any overlying mEAT. Adipose tissue appears as hypoattenuation on CT (darker areas) and can be distinguished from blood pool and myocardium readily. Across all CE-CT images (n = 24), inFAT was always found within the segmented myocardium whereas mEAT is found overlying the epicardium. CE-CT: contrast-enhanced computed tomography, inFAT: infiltrating adipose tissue, mEAT: myocardial epicardial adipose tissue.
Extended Data Fig. 5
Extended Data Fig. 5. Definitions of the UVC system.
a: Illustration of the UVC system for both LGE-based and CT-based models. For both CT-based and LGE-based heart ventricular geometries, the UVC system was defined. The three different axes defined were rotational (Ф: blue, cyan, green, yellow, red), transmural (ρ: black, red, yellow, white), and apicobasal (ξ: blue, white, red). b: Definitions for anatomical regions and intramural distribution using the UVC system. Seven anatomical regions were defined: basal septum (dark green), basal anterior/anterolateral (green), basal inferior/inferolateral (light green), mid septum (dark blue), mid anterior/anterolateral (blue), mid inferior/inferolateral (light blue) and apex (white). The corresponding UVC ranges are displayed in the legend (left side). The epicardium, midmyocardium, and endocardium were also defined using the UVC system (right). UVC symbols: rotational (Ф), transmural (ρ), and apicobasal (ξ). CT: computed tomography, LGE: late gadolinium-enhanced, UVC: universal ventricular coordinates
Extended Data Fig. 6
Extended Data Fig. 6. Intramural distribution of inFAT and scar.
The percentage of inFAT and scar in the endocardium, mid-myocardium, and epicardium was quantified. inFAT: infiltrating adipose tissue
Extended Data Fig. 7
Extended Data Fig. 7. Assignment of mesh elements in hybrid CT-MRI heart models.
Seven distinct regions were identified in hybrid CT-MRI heart models based on the corresponding tags in CT- and LGE-based heart models. Colors represents the different possible element tags. CE-CT: contrast-enhanced computed tomography, LGE-MRI: late gadolinium-enhanced magnetic resonance imaging
Extended Data Fig. 8
Extended Data Fig. 8. Definition of heart model VT circuits.
VT circuits were defined using the UVC system. Letting the grey dot (left panel) denote the UVC corresponding to the manually annotated VT exit site, the VT circuit was defined as all tissues falling within 0.2 units (ξ) in terms of the apicobasal axis, 36° or π/5 radians (Ф) for the rotational axis, and the full transmural myocardium (ρ) for these areas. The activation sequence for a given VT circuit (right panel) from one re-entrant cycle to the next was systematically divided into 8 isochrones: exit site (purple), outer loop (grey and red), entrance (orange), the common pathway (yellow, green, cyan, blue), and the critical isthmus (cyan, blue). UVC: universal ventricular coordinates, VT: ventricular tachycardia.
Extended Data Fig. 9
Extended Data Fig. 9. Conduction velocities across model VT circuits.
Conduction velocities were measured across VT circuits. a: Example of volumetric conduction velocities in two VT circuits in hybrid CT-MRI models. b: Conduction velocities in each circuit component in LGE (n = 95 unique VT circuits), CT (n = 97 unique VT circuits), and hybrid CT-MRI models (n = 140 unique VT circuits). Data are presented as mean values ± SD. CT: computed tomography, LGE: late gadolinium-enhanced, MRI: magnetic resonance imaging, VT: ventricular tachycardia.
Extended Data Fig. 10
Extended Data Fig. 10. Intramural distribution of VT circuits.
The percentage of activation for each VT circuit component was quantified in the endocardium, midmyocardium, and epicardium across all VT circuits. VT: ventricular tachycardia.

References

    1. Guandalini, G. S., Liang, J. J. & Marchlinski, F. E. Ventricular tachycardia ablation: past, present, and future perspectives. JACC Clin. Electrophysiol.5, 1363–1383 (2019). - PubMed
    1. Cronin, E. M. et al. 2019 HRS/EHRA/APHRS/LAHRS expert consensus statement on catheter ablation of ventricular arrhythmias. Heart Rhythm17, e2–e154 (2020). - PMC - PubMed
    1. Tung, R. et al. Freedom from recurrent ventricular tachycardia after catheter ablation is associated with improved survival in patients with structural heart disease: an International VT Ablation Center Collaborative Group study. Heart Rhythm12, 1997–2007 (2015). - PMC - PubMed
    1. Marchlinski, F. E. et al. Long-term success of irrigated radiofrequency catheter ablation of sustained ventricular tachycardia: post-approval THERMOCOOL VT trial. J. Am. Coll. Cardiol.67, 674–683 (2016). - PubMed
    1. Yokokawa, M. et al. Reasons for recurrent ventricular tachycardia after catheter ablation of post-infarction ventricular tachycardia. J. Am. Coll. Cardiol.61, 66–73 (2013). - PubMed