

Transition patterns of metabolism-weight phenotypes over time: A longitudinal study using the multistate Markov model in China
- PMID: 36589938
- PMCID: PMC9799718
- DOI: 10.3389/fpubh.2022.1026751
Transition patterns of metabolism-weight phenotypes over time: A longitudinal study using the multistate Markov model in China
Abstract
Background: A change in weight or metabolic status is a dynamic process, yet most studies have focused on metabolically healthy obesity (MHO) and the transition between MHO and metabolically unhealthy obesity (MUO); therefore, they have not fully revealed the nature of all possible transitions among metabolism-weight phenotypes over the years.
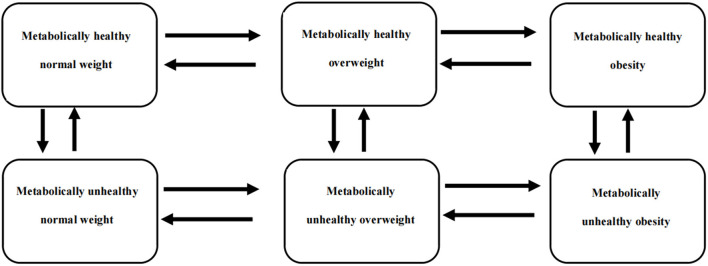
Methods: This was a longitudinal study based on a retrospective health check-up cohort. A total of 9,742 apparently healthy individuals aged 20-60 years at study entry were included and underwent at least two health check-ups. Six metabolism-weight phenotypes were cross-defined by body mass index (BMI) categories and metabolic status as follows: metabolically healthy normal weight (MHNW), metabolically healthy overweight (MHOW), MHO, metabolically unhealthy normal weight (MUNW), metabolically unhealthy overweight (MUOW), and MUO. A multistate Markov model was used to analyse all possible transitions among these phenotypes and assess the effects of demographic and blood indicators on the transitions.
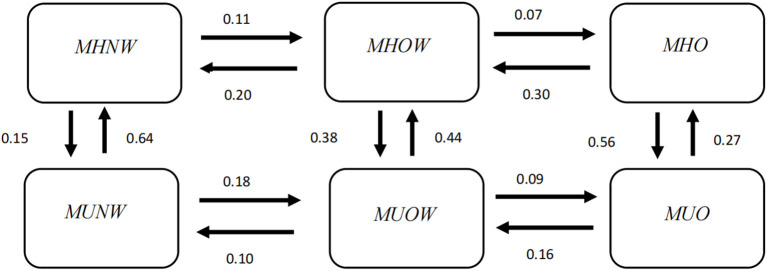
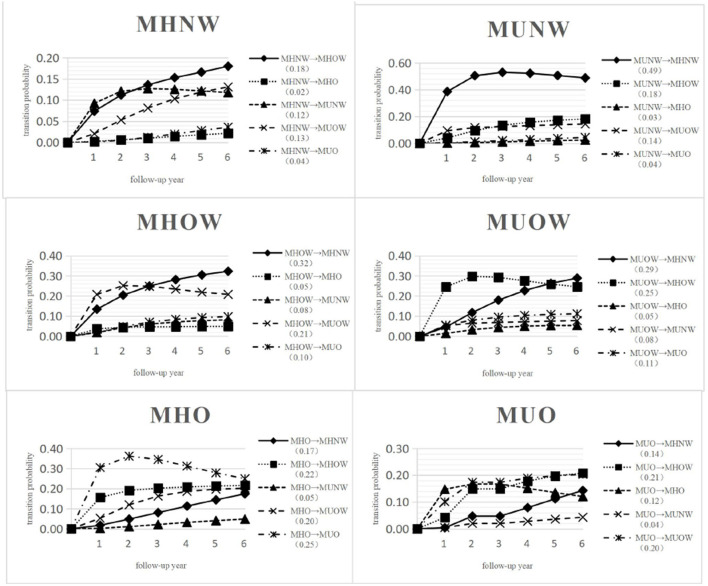
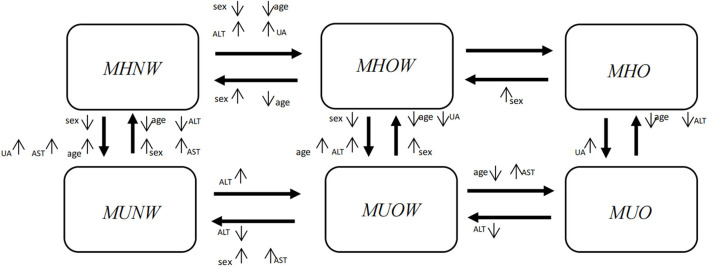
Results: The transition intensity from MUNW to MHNW was the highest (0.64), followed by the transition from MHO to MUO (0.56). The greatest sojourn time appeared in the MHNW state (3.84 years), followed by the MUO state (2.34 years), and the shortest sojourn time appeared in the MHO state (1.16 years). Transition intensities for metabolic improvement gradually decreased with BMI level as follows: 0.64 for MUNW to MHNW, 0.44 for MUOW to MHNW, and 0.27 for MUO to MHO; however, transition intensities for metabolic deterioration, including MHNW to MUNW, MHOW to MUOW, and MHO to MUO, were 0.15, 0.38, and 0.56, respectively. In the middle-aged male group, elevated alanine aminotransferase (ALT), aspartate aminotransferase (AST), and uric acid (UA) increased the risk of deterioration in weight and metabolic status and decreased the possibility of improvement.
Conclusion: Maintaining a normal and stable BMI is important for metabolic health. More attention should be given to males and elderly people to prevent their progression to an unhealthy metabolic and/or weight status. MHO is the most unstable phenotype and is prone to convert to the MUO state, and individuals with abnormal ALT, AST and UA are at an increased risk of transitioning to an unhealthy weight and/or metabolic status; therefore, we should be alert to abnormal indicators and MHO. Intervention measures should be taken early to maintain healthy weight and metabolic status.
Keywords: China; longitudinal study; metabolic status; multistate Markov model; obesity.
Copyright © 2022 Zhang, Tang, Hu, Li and Song.
Conflict of interest statement
The authors declare that the research was conducted in the absence of any commercial or financial relationships that could be construed as a potential conflict of interest.
Figures
Similar articles
-
Association between metabolic overweight/obesity phenotypes and readmission risk in patients with lung cancer: A retrospective cohort study.EClinicalMedicine. 2022 Jul 22;51:101577. doi: 10.1016/j.eclinm.2022.101577. eCollection 2022 Sep. EClinicalMedicine. 2022. PMID: 35898319 Free PMC article.
-
Association between different metabolic phenotypes of obesity and thyroid disorders among Chinese adults: a nationwide cross-sectional study.Front Endocrinol (Lausanne). 2023 Apr 21;14:1158013. doi: 10.3389/fendo.2023.1158013. eCollection 2023. Front Endocrinol (Lausanne). 2023. PMID: 37152970 Free PMC article.
-
Metabolic abnormalities, but not obesity per se, associated with chronic kidney disease in a Taiwanese population.Nutr Metab Cardiovasc Dis. 2020 Mar 9;30(3):418-425. doi: 10.1016/j.numecd.2019.09.029. Epub 2019 Oct 8. Nutr Metab Cardiovasc Dis. 2020. PMID: 31744713
-
Risk of incident chronic kidney disease in metabolically healthy obesity and metabolically unhealthy normal weight: A systematic review and meta-analysis.Obes Rev. 2024 Feb;25(2):e13656. doi: 10.1111/obr.13656. Epub 2023 Oct 30. Obes Rev. 2024. PMID: 37904643
-
Epidemiology and pathophysiology of the association between NAFLD and metabolically healthy or metabolically unhealthy obesity.Ann Hepatol. 2020 Jul-Aug;19(4):359-366. doi: 10.1016/j.aohep.2020.03.001. Epub 2020 Mar 21. Ann Hepatol. 2020. PMID: 32349939 Review.
Cited by
-
Associations of ALT, AST and ALT/AST ratio with metabolically unhealthy obesity in the elderly.Front Nutr. 2025 Mar 24;12:1513029. doi: 10.3389/fnut.2025.1513029. eCollection 2025. Front Nutr. 2025. PMID: 40196018 Free PMC article.
-
Association between metabolic obesity phenotypes and multiple myeloma hospitalization burden: A national retrospective study.Front Oncol. 2023 Feb 23;13:1116307. doi: 10.3389/fonc.2023.1116307. eCollection 2023. Front Oncol. 2023. PMID: 36910611 Free PMC article.
-
Conversions between metabolically unhealthy and healthy obesity from midlife to late-life.Int J Obes (Lond). 2024 Mar;48(3):433-436. doi: 10.1038/s41366-023-01425-y. Epub 2023 Dec 2. Int J Obes (Lond). 2024. PMID: 38042933 Free PMC article.
-
Bridging the gap in obesity research: A consensus statement from the European Society for Clinical Investigation.Eur J Clin Invest. 2025 Aug;55(8):e70059. doi: 10.1111/eci.70059. Epub 2025 May 15. Eur J Clin Invest. 2025. PMID: 40371883 Free PMC article. Review.
-
Genetic influences, lifestyle and psychosocial aspects in relation to metabolically healthy obesity and conversion to a metabolically unhealthy state.Diabetes Obes Metab. 2025 Jan;27(1):207-214. doi: 10.1111/dom.16004. Epub 2024 Oct 9. Diabetes Obes Metab. 2025. PMID: 39382007 Free PMC article.
References
MeSH terms
LinkOut - more resources
Full Text Sources