. 2023 Feb;7(1):51-57.
doi: 10.1016/j.mayocpiqo.2022.12.004. Epub 2022 Dec 26.

A Multisite Assessment of Inpatient Safety Event Rates During the Coronavirus Disease 2019 Pandemic

Affiliations

A Multisite Assessment of Inpatient Safety Event Rates During the Coronavirus Disease 2019 Pandemic

Benjamin D Pollock et al. Mayo Clin Proc Innov Qual Outcomes. 2023 Feb.

Abstract

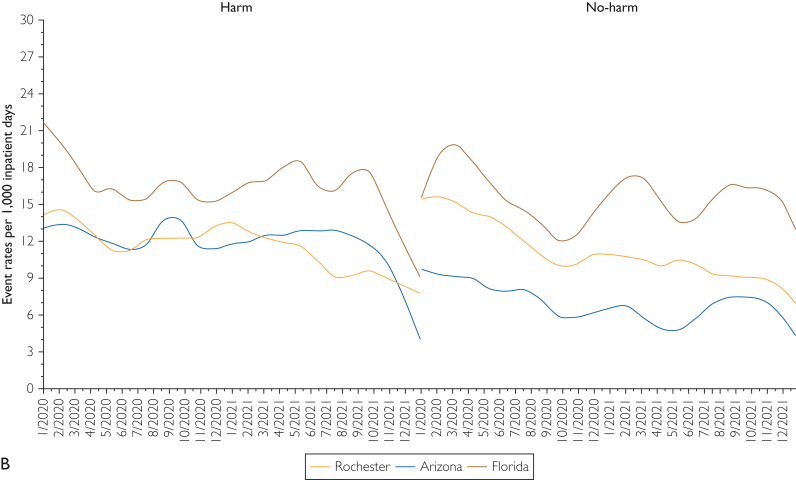
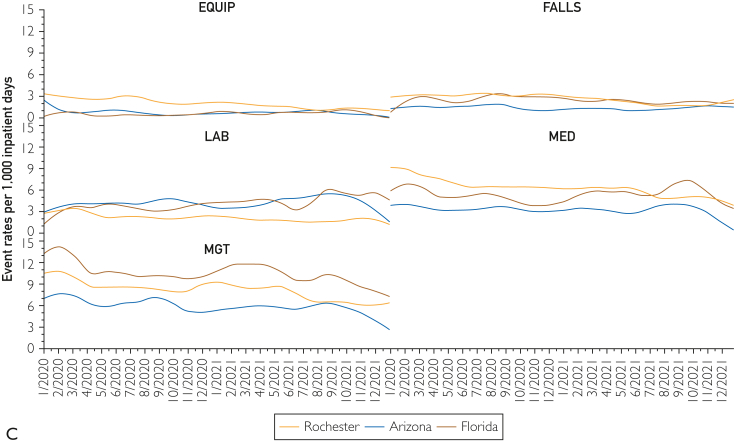
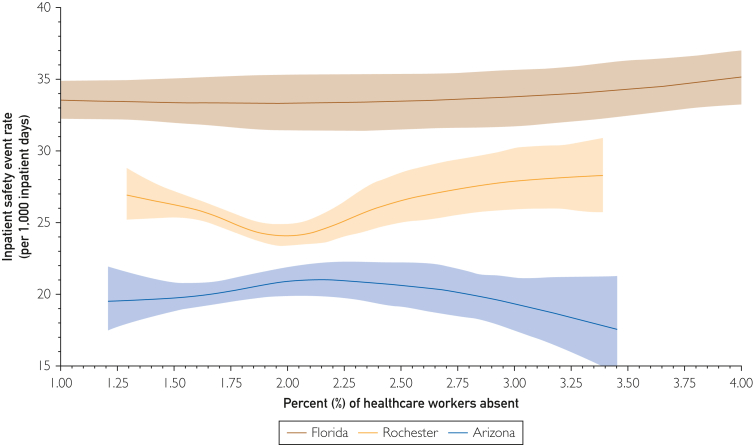
To date, there has been a notable lack of peer-reviewed or publicly available data documenting rates of hospital quality outcomes and patient safety events during the coronavirus disease 2019 pandemic era. The dearth of evidence is perhaps related to the US health care system triaging resources toward patient care and away from reporting and research and also reflects that data used in publicly reported hospital quality rankings and ratings typically lag 2-5 years. At our institution, a learning health system assessment is underway to evaluate how patient safety was affected by the pandemic. Here we share and discuss early findings, noting the limitations of self-reported safety event reporting, and suggest the need for further widespread investigations at other US hospitals. During the 2-year study period from January 1, 2020, through December 31, 2021 across 3 large US academic medical centers at our institution, we documented an overall rate of 25.8 safety events per 1000 inpatient days. The rate of events meeting "harm" criteria was 12.4 per 1000 inpatient days, the rate of nonharm events was 11.1 per 1000 inpatient days, and the fall rate was 2.3 per 1000 inpatient days. This descriptive exploratory analysis suggests that patient safety event rates at our institution did not increase over the course of the pandemic. However, increasing health care worker absences were nonlinearly and strongly associated with patient safety event rates, which raises questions regarding the mechanisms by which patient safety event rates may be affected by staff absences during pandemic peaks.

Keywords: AHRQ, Agency for Healthcare Research and Quality; COVID-19, coronavirus disease 2019; PSI, Patient Safety Indicator.


Figures

Figure 1
Figure 1
Smoothed inpatient safety event rate (per 1000 inpatient days and coronavirus disease 2019 [COVID-19] inpatient census) during the COVID-19 pandemic at 3 destination medical centers. A, Dotted lines indicate COVID-19 inpatient census, and solid lines indicate inpatient safety event rates (per 1000 inpatients). B, Event rates stratified by harm (left panel) and nonharm (right panel). C, Event rates stratified by management of care events (MGT, bottom left panel), medication and intravenous events (MED, bottom right panel), laboratory (LAB, center left panel), falls (FALLS, top right panel), and equipment and medical or surgical device and supply related (EQUIP, top left panel). These categories were the most common event types. In this exploratory analysis, we sought to use these graphs to visually assess trends in reported event rates for further, more rigorous statistical evaluations if any clear visual signals emerged.
Figure 1
Figure 1
Smoothed inpatient safety event rate (per 1000 inpatient days and coronavirus disease 2019 [COVID-19] inpatient census) during the COVID-19 pandemic at 3 destination medical centers. A, Dotted lines indicate COVID-19 inpatient census, and solid lines indicate inpatient safety event rates (per 1000 inpatients). B, Event rates stratified by harm (left panel) and nonharm (right panel). C, Event rates stratified by management of care events (MGT, bottom left panel), medication and intravenous events (MED, bottom right panel), laboratory (LAB, center left panel), falls (FALLS, top right panel), and equipment and medical or surgical device and supply related (EQUIP, top left panel). These categories were the most common event types. In this exploratory analysis, we sought to use these graphs to visually assess trends in reported event rates for further, more rigorous statistical evaluations if any clear visual signals emerged.
Figure 2
Figure 2
Unadjusted relationship between 7-day rolling new health care staff absences and inpatient safety event rates including harm and no-harm events of all types (per 1,000 inpatient days) during the coronavirus disease 2019 pandemic at 3 destination medical centers. Shaded region indicates 95% CIs, P<.0001 for the relationship between percentage of health care workers absent and inpatient safety event rates (per 1000 inpatients), and Pinteraction<.0001 indicating differences in this relationship by site.

References

    1. AHRQ national scorecard on hospital-acquired conditions updated baseline rates and preliminary results 2014–2017 Agency for Healthcare Research and Quality. https://www.ahrq.gov/sites/default/files/wysiwyg/professionals/quality-p... Published January 2019.
    1. Medicare program; hospital inpatient prospective payment systems for acute care hospitals and the long-term care hospital prospective payment system and policy changes and fiscal year 2022 rates; quality programs and Medicare promoting interoperability program requirements for eligible hospitals and critical access hospitals; changes to Medicaid provider enrollment; and changes to the Medicare shared savings program. 86 FR 44774. Centers for Medicare and Medicaid Services. Published August 13, 2021. Accessed June 14 2022. https://www.federalregister.gov/documents/2021/08/13/2021-16519/medicare...
    1. Patel P.R., Weiner-Lastinger L.M., Dudeck M.A., et al. Impact of COVID-19 pandemic on central-line-associated bloodstream infections during the early months of 2020, National Healthcare Safety Network. Infect Control Hosp Epidemiol. 2022;43(6):790–793. - PMC - PubMed
    1. Weiner-Lastinger L.M., Pattabiraman V., Konnor R.Y., et al. The impact of coronavirus disease 2019 (COVID-19) on healthcare-associated infections in 2020: a summary of data reported to the National Healthcare Safety Network. Infect Control Hosp Epidemiol. 2022;43(1):12–25. - PubMed
    1. Baker M.A., Sands K.E., Huang S.S., et al. The Impact of coronavirus disease 2019 (COVID-19) on healthcare-associated infections. Clin Infect Dis. 2022;74(10):1748–1754. - PMC - PubMed