

An improved model and performance analysis for grid-connected photovoltaic system in Oman
- PMID: 36590488
- PMCID: PMC9800327
- DOI: 10.1016/j.heliyon.2022.e12237
An improved model and performance analysis for grid-connected photovoltaic system in Oman
Abstract
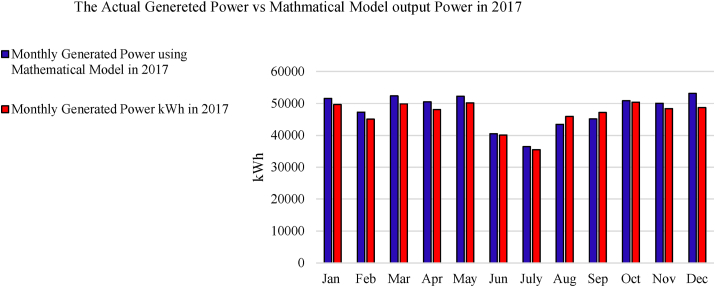
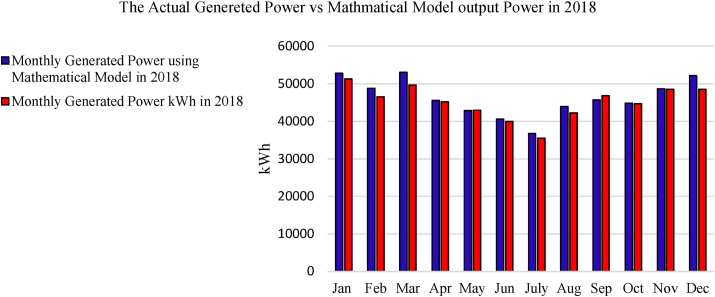
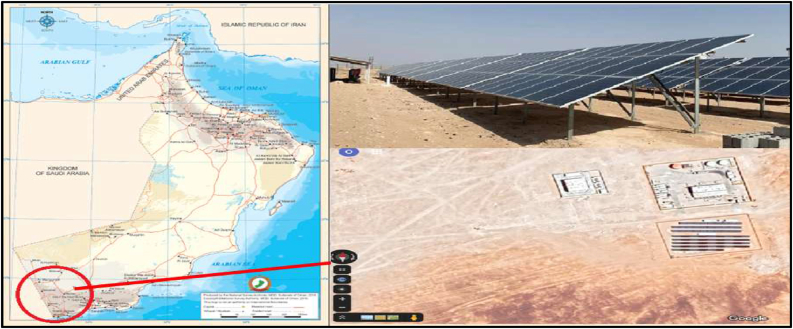
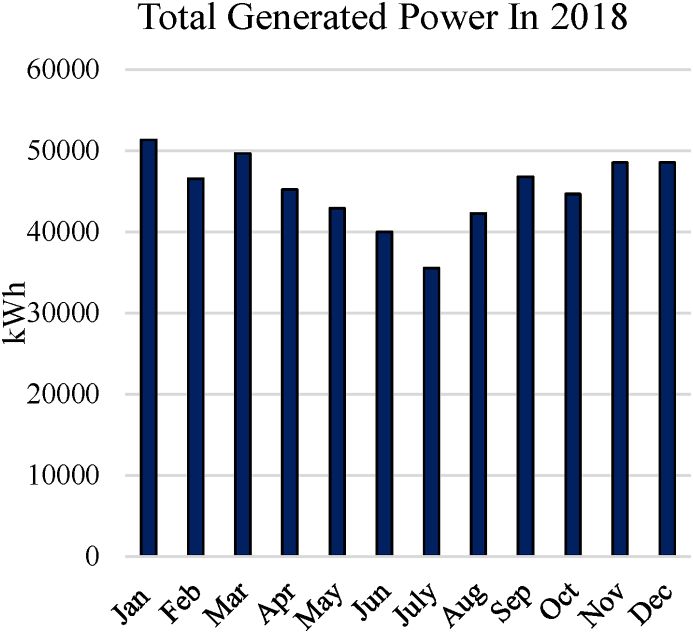
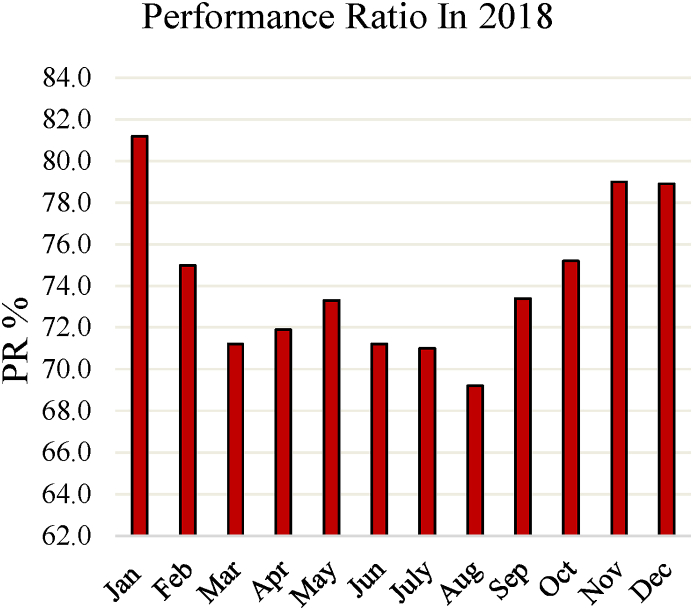
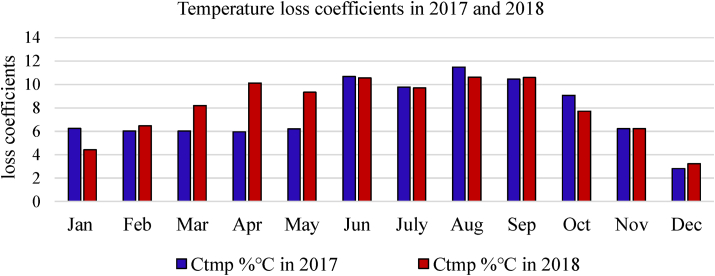
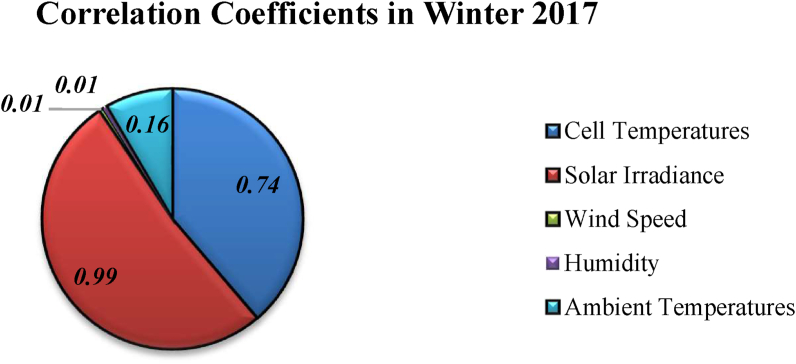
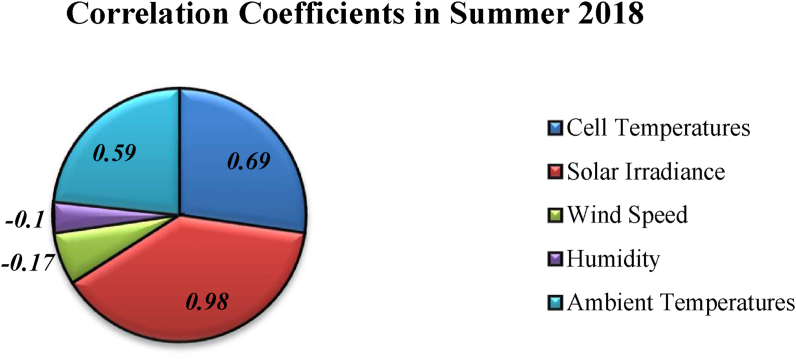
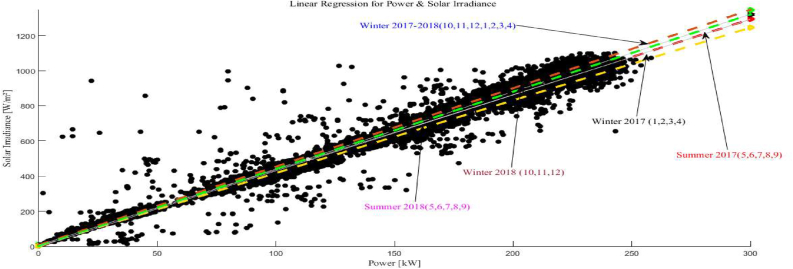
The PV systems' sources are environmentally friendly, but at the same time, they are constantly changing with time. When evaluating solar energy resources, it is necessary to consider the variability and effects of different environmental operation parameters like solar irradiances, ambient temperature, and module temperature. The study introduces a method to simulate an existing photovoltaic system using a mathematical model that permits intelligent strategies to optimise the efficiency and adjust the most effective operational parameters for the solar energy systems. A mathematical analysis for the data framework, including correlation and regression coefficients, was calculated to identify and chart the relationships between the system's most influential parameters and the generated power from the PV system. An improved mathematical model was built with the most influential parameters. The improved model was simple, accurate, and based on the loss ratio by eliminating the unknown parameters. The system's efficiency was analysed using an existing data framework-recorded hourly from 1st January 2017 to December 2018 for a grid-connected photovoltaic system installed in the south of Oman. The results showed that the most influential parameters on the efficiency were the module's solar irradiance and surface temperature. The operating parameters such as ambient temperature, wind speed, and air humidity had a negligible effect on the generated power compared to the cell temperatures and solar radiation. The dissipation factor was used in the new output current and voltage equations to stimulate the output power of the PV model. The improved model was validated in a MATLAB Simulink and showed a more promising output with a lower RMSE of 5 %.
Keywords: Data analysis; Energy; Mathematical model; Solar energy systems; System efficiency analysis; Validation of the established model.
© 2022 The Author(s).
Conflict of interest statement
The authors declare no conflict of interest.
Figures


References
-
- Owusu P.A., Asumadu-Sarkodie S. A review of renewable energy sources, sustainability issues and climate change mitigation. Cogent Eng. 2016;3(1):1–14.
-
- Siegel M.D., Klein S.A., Beckman W.A. Vol. 26. 1981. The Monthly-Average Performance of; pp. 413–418.
-
- Evans D.L. Vol. 27. 1981. Simplified Method for Predicting Photovoltaic Array Output T; pp. 555–560. 6.
-
- Skoplaki E., Palyvos J.A. On the temperature dependence of photovoltaic module electrical performance: a review of efficiency/power correlations. Sol. Energy. 2009;83(5):614–624.
-
- Qi X., et al. Optimization and sensitivity analysis of extended surfaces during melting and freezing of phase changing materials in cylindrical Lithium-ion battery cooling. J. Energy Storage. 2022;51
LinkOut - more resources
Full Text Sources
