. 2022 Nov 21;2(12):100350.
doi: 10.1016/j.crmeth.2022.100350. eCollection 2022 Dec 19.

Ex vivo assays show human gamma-delta T cells specific for common allergens are Th1-polarized in allergic donors

Affiliations

Ex vivo assays show human gamma-delta T cells specific for common allergens are Th1-polarized in allergic donors

Esther Dawen Yu et al. Cell Rep Methods. .

Abstract

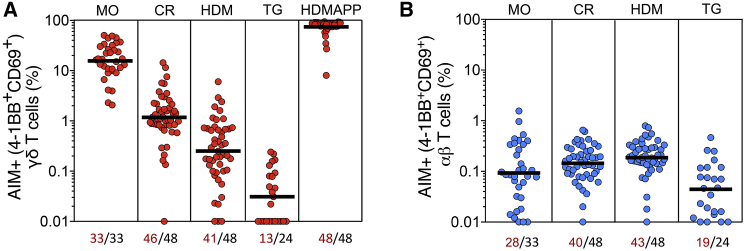
Gamma-delta (γδ) T cells contribute to the pathology of many immune-related diseases; however, no ex vivo assays to study their activities are currently available. Here, we established a methodology to characterize human allergen-reactive γδ T cells in peripheral blood using an activation-induced marker assay targeting upregulated 4-1BB and CD69 expression. Broad and reproducible ex vivo allergen-reactive γδ T cell responses were detected in donors sensitized to mouse, cockroach, house dust mite, and timothy grass, but the response did not differ from that in non-allergic participants. The reactivity to 4 different allergen extracts was readily detected in 54.2%-100% of allergic subjects in a donor- and allergen-specific pattern and was abrogated by T cell receptor (TCR) blocking. Analysis of CD40L upregulation and intracellular cytokine staining revealed a T helper type 1 (Th1)-polarized response against mouse and cockroach extract stimulation. These results support the existence of allergen-reactive γδ T cells and their potential use in rebalancing dysregulated Th2 responses in allergic diseases.

Keywords: T cells; Th1; allergy; cytokine production; functional assay; gamma-delta; γδ.


Conflict of interest statement

The authors have declared no conflict of interest.

Figures

None
Graphical abstract
Figure 1
Figure 1
γδ T cell reactivity to a mouse allergen extract can be detected using an AIM assay Allergen-specific γδ T cell responses were measured as percentage of AIM+ (CD137+CD69+) γδ T cells after stimulation of PBMCs with MO extract, HDMAPP, or media (Neg) as control. (A) Representative fluorescence-activated cell sorting (FACS) plot of each condition. (B) Percentages of allergen-specific γδ T cells responding to the indicated stimulations across all donors. (C) (Left) Representative FACS plots of the two γδ T cell subsets (Vδ1 versus Vδ2) gated on MO or HDMAPP AIM+ γδ T cells. (Right) Bars show percentage of each subset across all donors. All graphs show data represented as geometric mean with SD. Each dot represents a unique individual (MO, n = 33; HDMAPP, n = 48). Pairwise comparisons were performed with the Wilcoxon test, and p values <0.05 were considered statistically significant.
Figure 2
Figure 2
γδ T cell reactivity accounts for the majority of the mouse extract response and is not mediated by peptides Total MO-specific T cell responses were measured as a percentage of AIM+ (CD137+CD69+) CD3+ T cells after stimulation of PBMCs with MO extract, and the individual γδ and αβ T cell reactivity was assessed. (A) Representative FACS plot of total AIM+CD3+ T cells (left) further gated as function of γδ and αβ T cell reactivity (right) (B) Graph shows the relative percentage of γδ and αβ reactivity from the total MO-specific T cell responses across all donors (n = 33). (C) (Left) Representative FACS plots of AIM+ (CD137+CD69+) γδ (top row) or αβ (bottom row) T cells after stimulation of PBMCs with MO peptide pools (MPs), MO extract, or control (Neg; media for γδ T cells, or DMSO for αβ T cells). (D) Graphs show the percentage of AIM+ reactivity in each condition for γδ or αβ T cells across all donors (n = 20). All graphs show data represented as geometric mean with SD. Each dot represents a unique individual. Pairwise comparisons were performed with the Wilcoxon test, and p values <0.05 were considered statistically significant.
Figure 3
Figure 3
γδ and αβ T cell reactivity is detected with MO, CR, HDM, and TG extracts (A and B) Allergen-specific T cell responses were measured as percentage of AIM+ (CD137+CD69+) cells after stimulation of PBMCs with mouse (MO), cockroach (CR), house dust mite (HDM), and timothy grass (TG) extracts or HDMAPP. Graphs show percentages of allergen-specific (A) γδ T cells or (B) αβ T cells responding to the indicated stimulations across all donors (MO, n = 33; CR, n = 48; HDM, n = 48; TG, n = 24). Each dot represents a unique individual, and geometric mean and number of donors associated with a positive response (red) for each stimulus is shown.
Figure 4
Figure 4
γδ T cell reactivity to MO and CR allergen extracts is TCR specific, albeit with different requirements for the presence of APCs (A–C) Allergen-specific γδ T cell responses were measured as percentage of AIM+ (CD137+CD69+) γδ T cells after stimulation of PBMCs with (A) MO extract, (B) CR extract, or (C) HDMAPP in the presence (+) or absence (−) of antigen-presenting cells (APCs). (D and E) PBMCs were stimulated with an MO or CR extract, HDMAPP, or α-CD3 and cultured in the absence (−) or presence (+) of a TCR blocking reagent (dasatinib). Graphs show percentage of AIM+ γδ (D) or αβ (E) T cells in response to the different stimuli and conditions (MO, n = 8; CR, n = 8; HDM, n = 16; TG, n = 16). Each dot represents a unique individual. Data are represented as geometric mean and SD. Kruskal-Wallis or Wilcoxon paired tests were performed, and p values are indicated. p < 0.05 was considered statistically significant.
Figure 5
Figure 5
Magnitude of allergen-reactive γδ T cells is similar between allergic and non-allergic donors Allergen-specific T cell responses were measured as percentage of AIM+ (CD137+CD69+) γδ T cells after stimulation of PBMCs with MO, CR, HDM, or TG extract. Graphs show percentages of allergen-specific γδ T cells in non-allergic (gray) or allergic donors (red) responding to the indicated stimulations across all donors (allergics: MO, n = 33; CR, n = 48; HDM, n = 48; TG, n = 24; non-allergics: n = 39). Each dot represents a unique individual, and geometric mean is shown. Number of donors associated with a positive response (red) for each stimulus is indicated in the bottom. Mann-Whitney test was performed, and p values are indicated. p < 0.05 was considered statistically significant.
Figure 6
Figure 6
MO and CR extracts elicit Th1-polarized cytokines from γδ T cells in allergic donors γδ T cell cytokine responses (IFNγ, TNF-α, IL-4, and IL-10) were measured by intracellular cytokine staining (ICS) of γδ T cells responding to allergen-specific stimulation as measured by CD154 (CD40L) expression. Graphs show percentage of AIM+ (CD154+cytokine+) γδ T cells for non-allergic (gray) or allergic donors (red) responding to (A) HDMAPP, (B) MO, or (C) CR extracts (allergics: n = 10; non-allergics: n = 10). Each dot represents a unique individual, and geometric mean for each stimulus/cytokine is shown. Mann-Whitney test was performed, and p values are indicated. p < 0.05 was considered statistically significant.

References

    1. Cheng M., Hu S. Lung-resident gammadelta T cells and their roles in lung diseases. Immunology. 2017;151:375–384. doi: 10.1111/imm.12764. - DOI - PMC - PubMed
    1. Attaf M., Legut M., Cole D.K., Sewell A.K. The T cell antigen receptor: the Swiss army knife of the immune system. Clin. Exp. Immunol. 2015;181:1–18. doi: 10.1111/cei.12622. - DOI - PMC - PubMed
    1. Chien Y.H., Meyer C., Bonneville M. Gammadelta T cells: first line of defense and beyond. Annu. Rev. Immunol. 2014;32:121–155. doi: 10.1146/annurev-immunol-032713-120216. - DOI - PubMed
    1. Paul S., Singh A.K., Shilpi, Lal G. Phenotypic and functional plasticity of gamma-delta (gammadelta) T cells in inflammation and tolerance. Int. Rev. Immunol. 2014;33:537–558. doi: 10.3109/08830185.2013.863306. - DOI - PubMed
    1. Simpson S.J., Holländer G.A., Mizoguchi E., Allen D., Bhan A.K., Wang B., Terhorst C. Expression of pro-inflammatory cytokines by TCR alpha beta+ and TCR gamma delta+ T cells in an experimental model of colitis. Eur. J. Immunol. 1997;27:17–25. doi: 10.1002/eji.1830270104. - DOI - PubMed

Publication types