. 2022 Dec 16:13:1066176.
doi: 10.3389/fimmu.2022.1066176. eCollection 2022.

Dissecting CD8+ T cell pathology of severe SARS-CoV-2 infection by single-cell immunoprofiling

Affiliations

Dissecting CD8+ T cell pathology of severe SARS-CoV-2 infection by single-cell immunoprofiling

Felix Schreibing et al. Front Immunol. .

Abstract

Introduction: SARS-CoV-2 infection results in varying disease severity, ranging from asymptomatic infection to severe illness. A detailed understanding of the immune response to SARS-CoV-2 is critical to unravel the causative factors underlying differences in disease severity and to develop optimal vaccines against new SARS-CoV-2 variants.

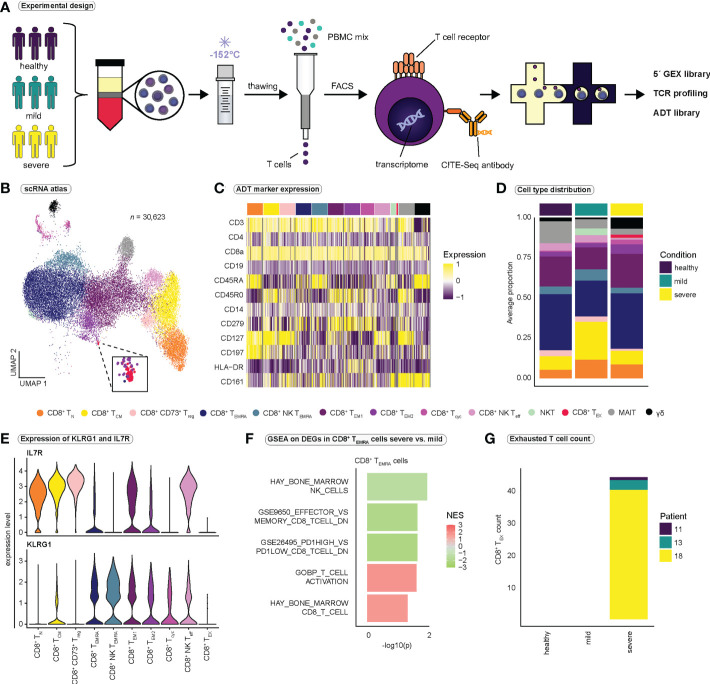
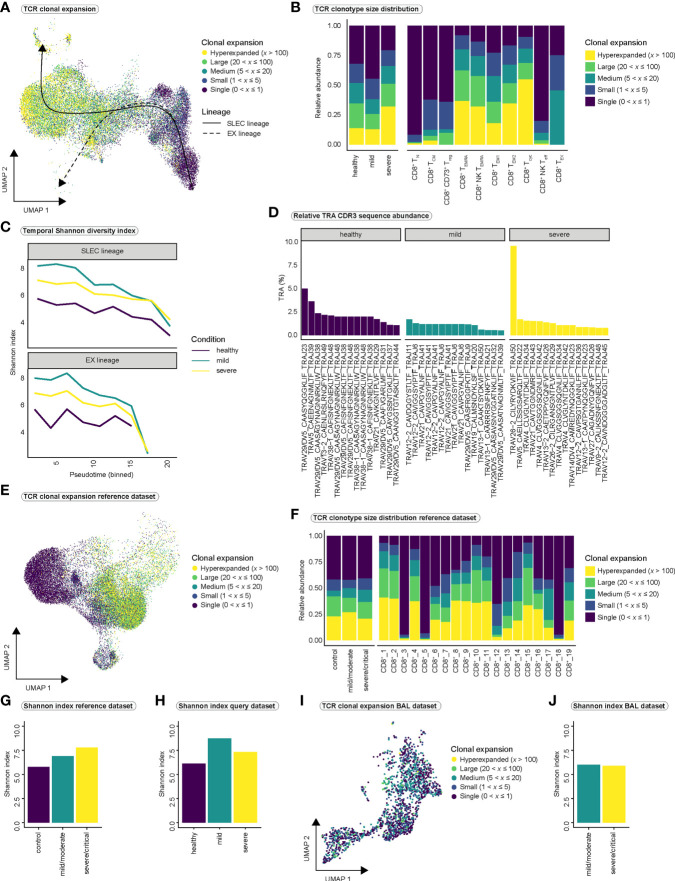
Methods: We combined single-cell RNA and T cell receptor sequencing with CITE-seq antibodies to characterize the CD8+ T cell response to SARS-CoV-2 infection at high resolution and compared responses between mild and severe COVID-19.

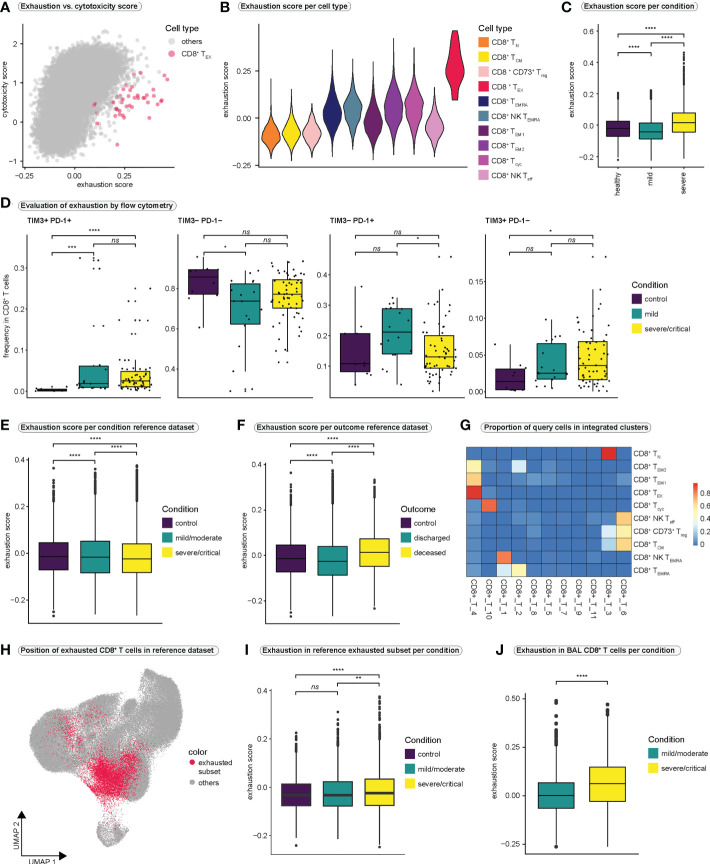
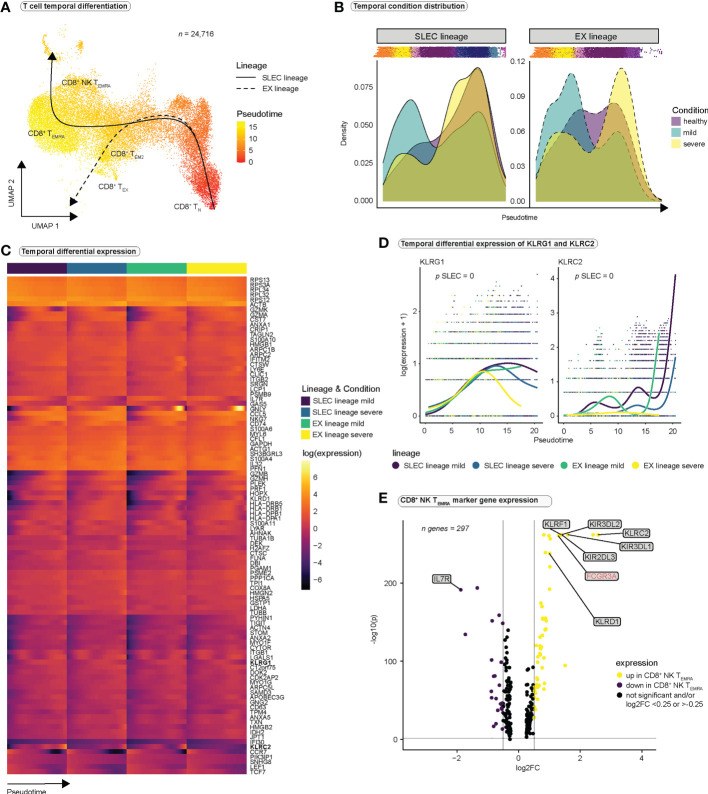
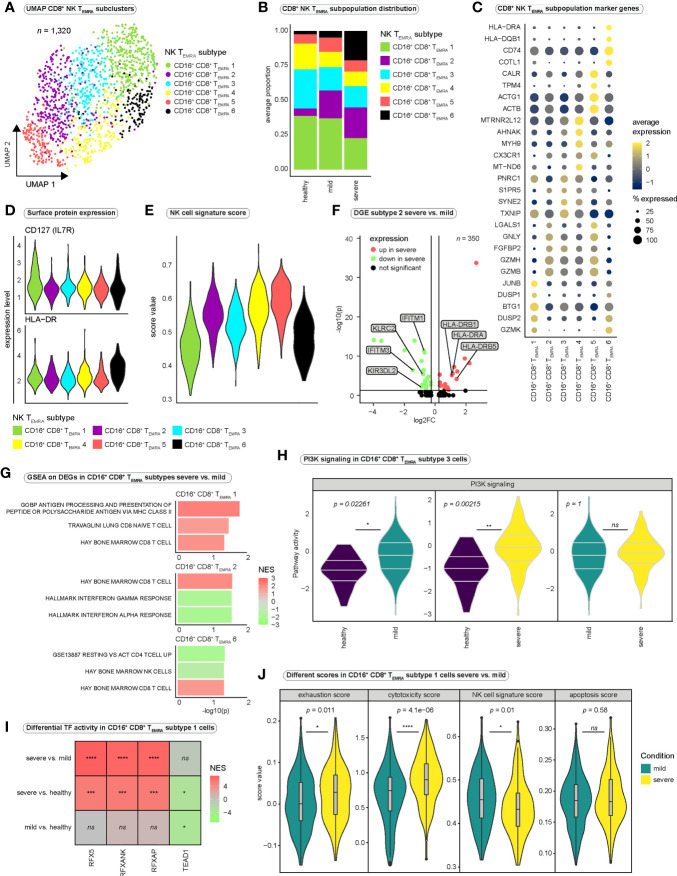
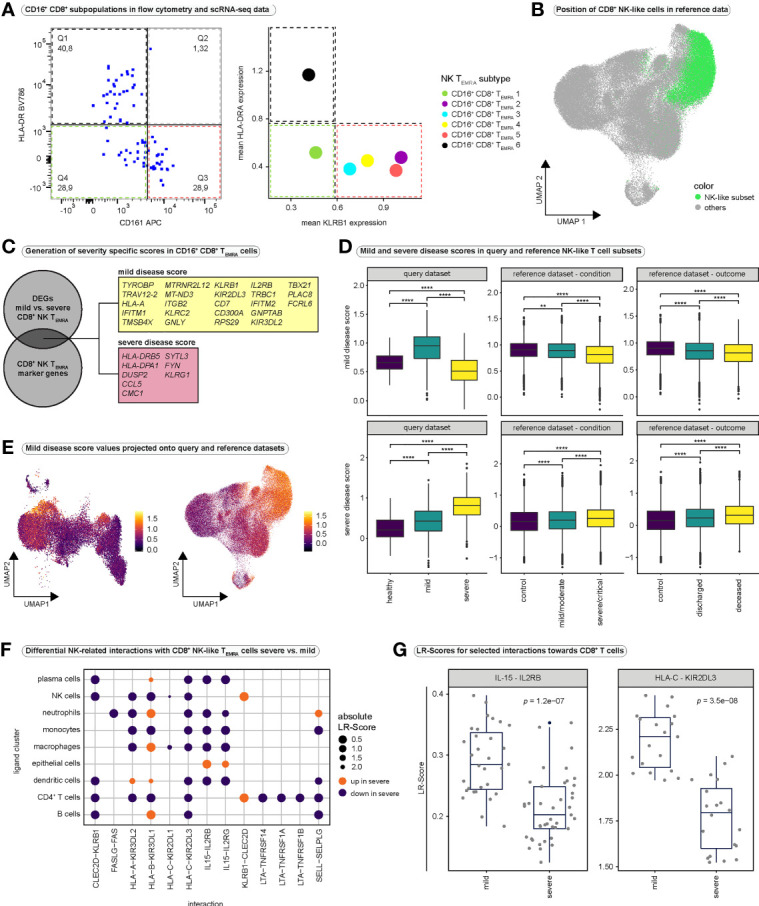
Results: We observed increased CD8+ T cell exhaustion in severe SARS-CoV-2 infection and identified a population of NK-like, terminally differentiated CD8+ effector T cells characterized by expression of FCGR3A (encoding CD16). Further characterization of NK-like CD8+ T cells revealed heterogeneity among CD16+ NK-like CD8+ T cells and profound differences in cytotoxicity, exhaustion, and NK-like differentiation between mild and severe disease conditions.

Discussion: We propose a model in which differences in the surrounding inflammatory milieu lead to crucial differences in NK-like differentiation of CD8+ effector T cells, ultimately resulting in the appearance of NK-like CD8+ T cell populations of different functionality and pathogenicity. Our in-depth characterization of the CD8+ T cell-mediated response to SARS-CoV-2 infection provides a basis for further investigation of the importance of NK-like CD8+ T cells in COVID-19 severity.

Keywords: CD16; CD8+ T cells; FCGR3A; NK-like T cell; SARS-CoV-2; immunoprofiling; scRNA-seq; scTCR-seq.


Conflict of interest statement

Author JS-R declares funding from GSK and Sanofi and consultant fees from Travere Therapeutics, Owkin and Astex Pharmaceuticals unrelated to this study. Author SH has funding from Novo Nordisk. Author RK has grants from Travere Therapeutics, Galapagos, Chugai, and Novo Nordisk and is a consultant or received honoraria from Bayer, Pfizer, Novo Nordisk, Lilly-Pharma and Gruenenthal. The remaining authors declare that the research was conducted in the absence of any commercial or financial relationships that could be construed as a potential conflict of interest.

Figures

Figure 1
Figure 1
Study design and identification of functional subsets of CD8+ T cells. (A) Schematic overview of the study design. PBMCs were isolated from healthy volunteers, patients with mild, and patients with severe COVID-19. PBMCs were gradually frozen and stored at -152°C until further processing. After thawing, T cells were isolated using magnetic activated cell sorting. CD8+ T cells were obtained by FACS, and CD8+ T cells were then subjected to the 10x pipeline. (B) Integrated UMAP projection of all 13 CD8+ T cell subpopulations (n = 30,623) (C) Scaled expression of antibody-derived tag (ADT) markers (CITE-seq) per CD8+ T cell subpopulation. (D) Average proportion of CD8+ T cell subsets for the healthy (n = 2), mild (n = 6), and severe (n = 6) condition. Cell type proportions per patient are reported in Figure S1C . (E) Expression of KLRG1 and IL7R per CD8+ T cell population. (F) Selected gene sets enriched in CD8+ TEMRA cells when comparing severe to mild COVID-19 (for a full list of gene sets see Table S4 ) (G) Number of exhausted CD8+ T cells per condition and patient. FACS, fluorescence activated cell sorting; TCR, T cell receptor; GEX, gene expression; ADT, antibody-derived tag; CD8+ TN, CD8+ naïve T cells; CD8+ TCM, CD8+ central memory cells; CD8+ CD73+ Treg, CD8+ CD73+ regulatory T cells; CD8+ TEMRA, CD8+ terminally differentiated effector memory cells re-expressing CD45RA; CD8+ NK TEMRA, CD8+ NK-like terminally differentiated effector memory cells re-expressing CD45RA; CD8+ TEM1, CD8+ effector memory cells 1; CD8+ TEM2, CD8+ effector memory cells 2; CD8+ Tcyc, CD8+ cycling effector cells; CD8+ NK Teff, CD8+ NK-like early effector T cells; NKT, atypical NKT cells; CD8+ TEX, CD8+ exhausted T cells; MAIT, Mucosal associated invariant T cells; γδ, γδ T cells; GSEA, gene set enrichment analysis.
Figure 2
Figure 2
CD8+ T cell exhaustion in COVID-19 (A) Relationship between T cell exhaustion and cytotoxicity. Each CD8+ T cell is placed in the coordinate system according to its individual exhaustion and cytotoxicity score value. To highlight the position of CD8+ exhausted T cells, all other CD8+ T cell populations are colored in gray. A version of this plot with cell type-specific and condition-specific colors is available in Figure S2A, S2B , respectively. (B) Violin plot of exhaustion scores per cell type. (C) Exhaustion scores in all CD8+ T cells per condition. (Kruskal-Wallis test: H (2) = 2407, p < 0.0001; healthy vs. mild: p < 0.0001; healthy vs. severe: p < 0.0001, mild vs. severe: p < 0.0001) (D) Frequencies of cells expressing different combinations of the exhaustion markers PD-1 and TIM3 in all CD8+ T cells as examined by flow cytometry. (TIM3+PD-1+: Kruskal-Wallis test: H(2) = 21.59, p < 0.0001; control vs. mild: p = 0.0002; control vs. severe/critical: p < 0.0001, mild vs. severe/critical: p = 0.8933; TIM3-PD-1-: Kruskal-Wallis test: H(2) = 6.314, p = 0.0426; control vs. mild: p = 0.036; control vs. severe/critical: p = 0.1046, mild vs. severe/critical: p = 0.1689; TIM3-PD-1+: Kruskal-Wallis test: H(2) = 6.07, p = 0.0481; control vs. mild: p = 0.1303; control vs. severe/critical: p = 0.9359, mild vs. severe/critical: p = 0.0484, TIM3+PD-1-: Kruskal-Wallis test: H(2) = 6.287, p = 0.0431; control vs. mild: p = 0.1369; control vs. severe/critical: p = 0.0377, mild vs. severe/critical: p = 0.4863) (E) Exhaustion score in all CD8+ T cells in the reference dataset per condition. (Kruskal-Wallis test: H(2) = 149.7, p < 0.0001; control vs. mild: p < 0.0001; control vs. severe/critical: p < 0.0001, mild vs. severe/critical: p < 0.0001) (F) Exhaustion score in all CD8+ T cells in the reference dataset per outcome. (Kruskal-Wallis test: H(2) = 1328, p < 0.0001; control vs. discharged: p < 0.0001; control vs. deceased: p < 0.0001, discharged vs. deceased: p < 0.0001) (G) Heatmap displaying the proportions of query cell types that mapped to each cluster in the integrated dataset. High values indicate that most cells of a query cluster were assigned to a distinct cluster in the reference dataset. (H) Projection of cells that mapped to exhausted CD8+ T cells from the query dataset onto the UMAP of the reference dataset. (I) Exhaustion scores per condition in cells from the reference dataset that mapped to exhausted CD8+ T cells in the query dataset. (Kruskal-Wallis test: H(2) = 31.24, p < 0.0001; control vs. mild/moderate: p = 0.1054; control vs. severe/critical: p < 0.0001, mild/moderate vs. severe/critical: p = 0.0011) (J) Exhaustion scores per condition in CD8+ T cells from bronchoalveolar lavage fluid. (Kolmogorov-Smirnov test: D = 0.2422, p < 0.0001) BAL, bronchoalveolar lavage. **** = p-value ± 0.0001, *** = p-value ± 0.001, ** = p-value ± 0.01, * = p-value < 0.05, ns = not significant.
Figure 3
Figure 3
CD8+ T cells differentiate towards an NK-like phenotype during SARS-CoV-2 infection. (A) Pseudotimes and estimated trajectories projected onto the integrated UMAP of cell types likely originating in naïve CD8+ T cells (n = 24,716). For trajectory inference with Slingshot, naïve CD8+ T cells were manually chosen as the origin of differentiation. (B) Temporal distribution of cell densities for all three conditions across pseudotime. Shifts in distribution between the mild and the severe condition for the short-lived effector cells (SLEC) and exhaustion (EX) lineage were tested with the Kolmogorov-Smirnov method (EX: D = 0.40237, p < 2.2e-16, SLEC: D = 0.31004, p < 2.2e-16). (C) Heatmap depicts differentially expressed genes between the progenitor and differentiated cell populations across pseudotime (start vs. end testing). (D) Smoothed expression of KLRG1 and KLRC2 across pseudotime with the y-axis on natural logarithmic scale. p-values report the result of differential expression analysis between progenitor and differentiated cell states across pseudotime (start vs. end testing). An extended panel of genes and their UMAP projections are reported in Figure S4 . (E) Volcano plot of genes differentially expressed in CD8+ NK-like TEMRA cells.
Figure 4
Figure 4
Clonal expansion and TCR diversity in COVID-19. (A) T cell receptor clonal expansion projected onto the integrated UMAP of cell types. (B) Distribution of clonal expansion within the conditions (left) and within the CD8+ T cell populations (right), displayed as relative abundance of clonotype expansion groupings ( Figure S5A is referred to for abundance per cell type within each condition). (C) Shannon diversity index as a measure of clonal diversity across pseudotime for the three conditions among SLEC and EX lineages. Shannon index was calculated on the whole TCR sequences, including TRA and TRB chains. (D) Relative proportion of CDR3 sequences of the 15 most abundant clones to the total number of CDR3 sequences per condition for the TRA chain ( Figure S5C is referred to for the relative proportion of CDR3 sequences for the TRB chain). (E) TCR clonal expansion projected onto the UMAP of the PBMC-derived CD8+ reference dataset. (F) Distribution of clonal expansion within the conditions (left) and within the CD8+ T cell populations (right), displayed as relative abundance of clonotype expansion groupings for the PBMC-derived reference dataset. ( Figure S5D is referred to for abundance per cell type within each condition of the reference dataset). (G) Shannon diversity index per condition for the PBMC-derived reference dataset and (H) for our query dataset. (I) TCR clonal expansion projected onto the UMAP of the BAL-derived CD8+ reference dataset. (J) Shannon diversity index per condition for the BAL-derived reference dataset. TCR, T cell receptor; SLEC, short-lived effector cell; EX, exhaustion; TRA, T cell receptor alpha chain; TRB, T cell receptor beta chain; CDR3, Complementarity determining region 3; BAL, bronchoalveolar lavage.
Figure 5
Figure 5
Heterogeneity among CD8+ NK-like terminally differentiated effector memory T cells re-expressing CD45RA. (A) Integrated UMAP projection of subclustered CD8+ NK-like TEMRA cells (CD16+ CD8+ TEMRA cells) (n = 1,320). (B) Average proportion of CD16+ CD8+ TEMRA subsets for the three conditions. Cell type proportions per patient are reported in Figure S6A . (C) Average expression of marker genes differentially expressed in the six CD16+ CD8+ TEMRA subsets. (D) Surface expression (CITE-seq) of IL7R and HLA-DR per CD16+ CD8+ TEMRA subtype. (E) NK cell signature scores of the six CD16+ CD8+ TEMRA subsets. (F) Differentially expressed genes in CD16+ CD8+ TEMRA-2 cells between the severe and the mild disease condition. (G) Selected significantly enriched gene sets for genes differentially expressed in the indicated CD16+ CD8+ TEMRA subtypes between mild and severe disease groups. Positive normalized enrichment scores (NES) indicate enrichment in the severe disease condition. (H) PI3K pathway activity in CD16+ CD8+ TEMRA-3 cells estimated with PROGENy. Significance was tested using Wilcoxon rank sum test. All PROGENy pathways are reported in Figure S6G . (I) Differential transcription factor activity (DoRothEA) estimated with msviper in CD16+ CD8+ TEMRA-1 cells between the severe and the mild condition. Positive NES values indicate increased activity in severe SARS-CoV-2 infection. (J) Different functional scores applied to CD16+ CD8+ TEMRA-1 cells and compared between severe and mild COVID-19 (Wilcoxon rank sum test). DGE, differential gene expression; log2FC, log2 fold change; GSEA, gene set enrichment analysis; NES, normalized enrichment score; PI3K, Phosphoinositide 3-kinase; TF, transcription factor.
Figure 6
Figure 6
Validation of CD16+ CD8+ TEMRA cells and cell-cell interaction analysis. (A) Validation of the existence of CD16+ CD8+ TEMRA subsets, identified in scRNA-seq data. The expression of HLA-DR (highly expressed in CD16+ CD8+ TEMRA-6 cells) and CD161 (highly expressed by CD16+ CD8+ subsets 2 to 5) was investigated in single, live CD16+ CD8+ T cells in a flow cytometry dataset (left panel). As a comparison, the mean expression of the corresponding genes (HLA-DRA as an example of an HLA-DR gene, as well as KLRB1 encoding CD161) in the CD16+ CD8+ subpopulations is shown (right panel). (B) UMAP embedding of the CD8+ T cell reference dataset (n = 114,209). Cells that mapped together with the CD8+ NK-like TEMRA cells from our query dataset after integration are highlighted in green. (C) Schematic illustrating the generation of mild and severe disease scores. Differential gene expression analysis was performed between mild and severe disease groups for all CD16+ CD8+ TEMRA cells. Differentially expressed genes that overlapped with highly significant marker genes of CD16+ CD8+ TEMRA cells (CD8+ NK-like TEMRA cells) were identified. Genes that were differentially upregulated in cells from mild disease (average log2-fold change > 0.25) were combined into the mild disease score, whereas genes that were differentially downregulated in cells from mild disease (average log2-fold change < 0.25) were combined into the severe disease score. (D) Comparison of mild (top) and severe (bottom) disease scores in NK-like CD8+ T cell subsets between conditions in our query dataset (left), between conditions in the PBMC-derived reference dataset (middle) and between outcome groups in the PBMC-derived reference dataset (right). Kruskal-Wallis test was used for significance testing. (query mild disease score: Kruskal-Wallis test: H(2) = 462.6, p < 0.0001; healthy vs. mild: p < 0.0001; healthy vs. severe: p < 0.0001, mild vs. severe: p < 0.0001; query severe disease score: Kruskal-Wallis test: H(2) = 330.5, p < 0.0001; healthy vs. mild: p < 0.0001; healthy vs. severe: p < 0.0001, mild vs. severe: p < 0.0001; reference mild disease score condition: Kruskal-Wallis test: H(2) = 778.6, p < 0.0001; control vs. mild/moderate: p = 0.0046; control vs. severe/critical: p < 0.0001, mild/moderate vs. severe/critical: p < 0.0001; reference severe disease score condition: Kruskal-Wallis test: H(2) = 246.2, p < 0.0001; control vs. mild/moderate: p < 0.0001; control vs. severe/critical: p < 0.0001, mild/moderate vs. severe/critical: p < 0.0001; reference mild disease score outcome: Kruskal-Wallis test: H(2) = 258.2, p < 0.0001; control vs. deceased: p = < 0.0001; control vs. discharged: p < 0.0001, deceased vs. discharged: p < 0.0001; reference severe disease score outcome: Kruskal-Wallis test: H(2) = 203.9, p < 0.0001; control vs. deceased: p = < 0.0001; control vs. discharged: p < 0.0001, deceased vs. discharged: p < 0.0001) (E) Mild disease score values projected onto the UMAP embeddings of our query CD8+ T cell dataset (left) and the reference CD8+ T cell dataset (right). Projections for severe disease score values are depicted in Figure S7G . (F) Differential ligand-receptor interactions between severe and mild COVID-19. To assess interactions between CD8+ T cells and non-T cells our dataset was integrated with the whole reference dataset and interactions were predicted using LIANA. Differential interactions were then calculated using CrossTalkeR for selected interactions, relevant in NK cell development and function. A group of ligand clusters was selected and NK-like CD8+ TEMRA cells were regarded as receptor cluster. The size of the dots indicates the absolute value of the differential LR-Score. The color indicates the direction of the change in ligand-receptor interactions; orange indicates increased interactions in severe COVID-19, purple indicates decreased interactions in severe COVID-19. (G) Boxplots displaying differences in LR-Scores for selected interactions between severe and mild COVID-19. All CD8+ T cell populations were regarded as receptor population and all other populations (except megakaryocytes) were regarded as ligand population for this purpose. DEGs, differentially expressed genes; LR-Score = ligand-receptor score.

References

    1. WHO . Coronavirus (COVID-19) dashboard. Available at: https://covid19.who.int/ (Accessed August 23, 2022).
    1. Sanyaolu A, Okorie C, Marinkovic A, Prakash S, Williams M, Haider N, et al. . Current advancements and future prospects of COVID-19 vaccines and therapeutics: a narrative review. Ther Adv Vaccines Immunother (2022) 10:25151355221097559. doi: 10.1177/25151355221097559 - DOI - PMC - PubMed
    1. Baden LR, El Sahly HM, Essink B, Kotloff K, Frey S, Novak R, et al. . Efficacy and safety of the mRNA-1273 SARS-CoV-2 vaccine. N Engl J Med (2021) 384:403–16. doi: 10.1056/NEJMoa2035389 - DOI - PMC - PubMed
    1. Polack FP, Thomas SJ, Kitchin N, Absalon J, Gurtman A, Lockhart S, et al. . Safety and efficacy of the BNT162b2 mRNA covid-19 vaccine. N Engl J Med (2020) 383:2603–15. doi: 10.1056/NEJMoa2034577 - DOI - PMC - PubMed
    1. Kuhlmann C, Mayer CK, Claassen M, Maponga T, Burgers WA, Keeton R, et al. . Breakthrough infections with SARS-CoV-2 omicron despite mRNA vaccine booster dose. Lancet (2022) 399:625–6. doi: 10.1016/S0140-6736(22)00090-3 - DOI - PMC - PubMed

Publication types

Supplementary concepts