. 2022 Dec 14:13:897193.
doi: 10.3389/fimmu.2022.897193. eCollection 2022.

Tuberculosis alters immune-metabolic pathways resulting in perturbed IL-1 responses

Affiliations

Tuberculosis alters immune-metabolic pathways resulting in perturbed IL-1 responses

Alba Llibre et al. Front Immunol. .

Abstract

Tuberculosis (TB) remains a major public health problem and we lack a comprehensive understanding of how Mycobacterium tuberculosis (M. tb) infection impacts host immune responses. We compared the induced immune response to TB antigen, BCG and IL-1β stimulation between latently M. tb infected individuals (LTBI) and active TB patients. This revealed distinct responses between TB/LTBI at transcriptomic, proteomic and metabolomic levels. At baseline, we identified a novel immune-metabolic association between pregnane steroids, the PPARγ pathway and elevated plasma IL-1ra in TB. We observed dysregulated IL-1 responses after BCG stimulation in TB patients, with elevated IL-1ra responses being explained by upstream TNF differences. Additionally, distinct secretion of IL-1α/IL-1β in LTBI/TB after BCG stimulation was associated with downstream differences in granzyme mediated cleavage. Finally, IL-1β driven signalling was dramatically perturbed in TB disease but was completely restored after successful treatment. This study improves our knowledge of how immune responses are altered during TB disease, and may support the design of improved preventive and therapeutic tools, including host-directed strategies.

Keywords: IL-1; IL-1ra; immunometabolism; systems immunology; tuberculosis.


Conflict of interest statement

MLA is a current employee of HIBIO. VR was employed by DATACTIX. The remaining authors declare that the research was conducted in the absence of any commercial or financial relationships that could be construed as a potential conflict of interest.

Figures
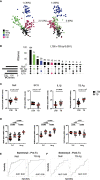
Figure 1
Figure 1
Immune stimulation identifies specific gene expression differences between latent M.tb infection and active TB disease. (A) Principal component analysis (PCA) on expression of 622 genes from 24 individuals with latent M.tb infection (LTBI) and 24 with active TB disease (TB) after whole blood stimulation with TB Ag, BCG, IL-1β, and a non-stimulated control (Null). Each coloured circle represents one individual (LTBI or TB) for each condition. (B) Upset plot showing the intersection of differentially expressed genes (q value <0.001, Mann-Whitney corrected for multiple comparisons) between TB and LTBI, across the four stimulations. Coloured bars depict the number of differentially expressed genes between LTBI and TB for each specific stimulation (TB Ag – green; BCG – blue; IL-1β - pink). (C) Examples of significantly different stimuli-specific transcripts (q<0.001) between TB and LTBI. (D) Expression of the 3 genes from the Sweeney TB score (Sweeney3) in the Null and TB Ag conditions on visit 1 pre-treatment. Area under the receiver operating characteristic curve (AUC) for discrimination of LTBI/TB groups using Sweeney3 for the Null and TB Ag conditions on visit 1 pre-treatment (Pre-Tx) (E) and on visit 2 after successful antibiotic treatment (Post-Tx) (F). Comparisons of LTBI/TB groups within the same stimulation were performed using unpaired non-parametric t-tests; comparisons between Null and stimulated conditions within the LTBI/TB groups were performed using a paired non-parametric t-test. Correction for multiple comparisons was then applied. Red line: median values. Closed square: LTBI, Open triangle: TB. For panels (C, D), q values (false discovery rate-adjusted p values) are reported.
Figure 2
Figure 2
The IL-1 pathway is dysregulated in active TB disease. (A) Spearman correlation plot of the induced (Fold-change>1.3 in the BCG condition respect to the Null) proteins measured by Luminex in TruCulture supernatants after BCG stimulation for LTBI and TB. Red rectangles highlight IL-1ra correlations. (B) Levels of IL-1ra protein measured by Luminex in the Null and BCG conditions for LTBI and TB. (C) Spearman correlation between IL-8 and IL-1ra protein levels measured by Luminex in the Null condition. (D) IL-8 concentration measured by Luminex in the Null condition, for LTBI and TB. (E) Gene expression levels of the IL-8 receptor subunits CXCR1 and CXCR2 measured by Nanostring at baseline. (F) IL-1ra protein concentration measured by ELISA in supernatants of whole blood from healthy individuals stimulated with IL-8 (n=10, 4 independent experiments). (G) Venn diagram of the genes correlated with IL-1ra and IL-8 in the Null condition in TB, measured by Nanostring and Luminex, respectively. Genes associated with the PPARγ pathway are in bold. (H) Reanalysis of RNAseq data by Spearman correlation between PPARG and IL1RN gene expression levels of human monocyte-derived macrophages infected with mycobacterial (M.tb H37Rv, heat-inactivated M.tb H37Rv, M.tb GC1237 and BCG) and non-mycobacterial (Yersinia pseudotuberculosis, Salmonella typhimurium and Staphylococcus epidermidis) species for 18 and 48h (19). Comparisons between groups were performed using unpaired or paired (F) non-parametric t-tests and correction for multiple comparisons was applied. Red line: median values. Closed square: LTBI, Open triangle: TB, Closed circle: Healthy Control (HC). For panels (B, E), q values (false discovery rate-adjusted p values) are reported.
Figure 3
Figure 3
Pregnane steroids activate the PPARγ pathway resulting in increased IL-1ra secretion in active TB. (A) Heatmap of Pearson correlation coefficients between metabolites and IL-1ra protein in the Null condition, measured by mass spectrometry and Luminex, respectively, for TB (left) and LTBI (right). Metabolites are ordered in decreasing values of TB cases Pearson correlation coefficients. (B) Pearson correlation between IL-1ra levels measured by Luminex and 5α-pregnane-3β,20α-diol disulfate measured by mass spectrometry for LTBI and TB. (C) IL-1ra protein concentration measured by ELISA after stimulation of CD14+ monocytes from healthy individuals with BCG in the presence or absence of the PPARγ agonist rosiglitazone (Rosi) and/or the PPARγ antagonist GW9662 (n=14, 4 independent experiments). (D) IL-1ra protein concentration measured by ELISA after stimulation with BCG of PPARG silenced or control CD14+ monocytes from healthy individuals (n=8, 3 independent experiments). (E) Ratio of IL-1ra induced upon BCG stimulation versus the Null Control in PPARG silenced or control CD14+ monocytes (n=8, 3 independent experiments). Comparisons between groups were performed using paired non-parametric t-tests and correction for multiple comparisons was applied. Red line: median values. Closed square: LTBI, Open triangle: TB, Circle: Healthy Control (HC). For panels (B–D), q values (false discovery rate-adjusted p values) are reported.
Figure 4
Figure 4
Increased TNF signaling promotes IL-1ra secretion. (A) Concentrations of IL-1ra measured by Luminex after stimulation of whole blood from healthy individuals with TNF (10 ng/ml), IL-1β (25 ng/ml), IFNγ (1000 IU/ml), IFNα (1000 IU/ml), IFNβ (1000 IU/ml), and IL-8 (25 ng/ml) (n=17, 4 independent experiments). (B) IL-1ra protein concentration measured by ELISA after whole blood stimulation with TNF, IFNα, IFNβ, TNF + IFNα and TNF + IFNβ (n=10, 3 independent experiments). (C) IL-1ra protein concentration measured by ELISA after whole blood stimulation with BCG in the presence of anti-TNFR or anti-IFNAR, or their respective isotype controls (Minimum n=12, 3 independent experiments). (D) Kinetics of IL-1ra, IFNα, IFNβ and TNF secretion measured by Luminex (IL-1ra and TNF) and Simoa (IFNα and IFNβ) upon BCG stimulation during the course of 30h. 1 representative donor of five healthy individuals is shown. (E) TNF protein concentration measured by Luminex in the BCG stimulated condition, for LTBI and TB. (F) TNFRSF1B mRNA expression levels measured by Nanostring in the BCG stimulated condition, for LTBI and TB. (G) TNF gene score in the BCG stimulated condition for the LTBI and TB groups. (H) Spearman correlation between IL-1ra levels and TNF gene score in the BCG stimulated condition. For calculation of TNF score see Materials and methods and Supplementary Table S6 . Paired (A–C) and unpaired (E–G) non-parametric t-test corrected for multiple comparisons. Red line: median values. Closed circle: Healthy Controls, Closed square: LTBI, Open triangle: TB. For panels A-G, q values (false discovery rate-adjusted p values) are reported.
Figure 5
Figure 5
TB patients present lower granzyme concentrations which impact levels of functional IL-1α and IL-1β. (A) Levels of IL-1α and IL-1β protein measured by Luminex in the Null and BCG stimulated conditions. (B) Levels of IL1A and IL1B mRNA measured by Nanostring in the Null and BCG conditions. (C) BCG stimulation of healthy donor blood with the NLRP3 inhibitor MCC950 (1 μM), the Syk inhibitor R406 (5 μM) or the serine-protease inhibitor 3,4-Dichloroisocoumarin (10 μM) (n=7, 2 independent experiments). Levels of mRNA expression for inflammasome components NLRP3, SYK, CRAD9 and CASP1 (D), cathepsins (E) and granzymes (F) measured by Nanostring in the Null and BCG conditions for TB and LTBI. (G) Granzyme A and granzyme B protein concentrations in TruCulture BCG supernatants for TB and LTBI measured by Luminex. (H) Spearman correlation between protein concentrations of granzyme B and IL-1α, and granzyme A and IL-1β in BCG supernatants. Paired (C) and unpaired non-parametric t-test corrected for multiple comparisons. Red line: median values. Closed square: LTBI, Open triangle: TB, Closed circle: Healthy Controls. For panels (A–G), q values (false discovery rate-adjusted p values) are reported.
Figure 6
Figure 6
IL-1β signalling is perturbed in active TB disease and is reset after successful antibiotic treatment. (A) Heatmap showing expression levels of IL-1β-induced genes (Null vs IL-1β q=0.001) measured by Nanostring in LTBI and TB, in visit 1 pre-treatment (Pre-Tx V1) and visit 2 post-treatment (Post-Tx V2). (B) Levels of NFKB1, NFKB2, IRAK2 and IRAK3 mRNA measured by Nanostring after IL-1β stimulation for LTBI and TB. Unpaired non-parametric t-test corrected for multiple comparisons. Red line: median values. Closed square: LTBI, Open triangle: TB. For panel (B), q values (false discovery rate-adjusted p values) are reported.

References

    1. World Health Organization . Global tuberculosis report 2019. Geneva: World Health Organization. (2019). Licence: CC BY-NC-SA 3.0 IGO.
    1. Pai M, Behr MA, Dowdy D, Dheda K, Divangahi M, Boehme CC, et al. . Tuberculosis. Nat Rev Dis Prim. (2016) 27(2):16076. doi: 10.1038/nrdp.2016.76 - DOI - PubMed
    1. Drain PK, Bajema KL, Dowdy D, Dheda K, Naidoo K, Schumacher SG. Incipient and subclinical tuberculosis: A clinical review of early stages and progression of infection. Clin Microbiol Rev (2018) 31(4):pii:e00021–18. doi: 10.1128/CMR.00021-18 - DOI - PMC - PubMed
    1. Teixeira LM, Barber KM, Sher A, Garra AO. Type I interferons in tuberculosis: Foe and occasionally friend. J Exp Med (2018) 215(5):1273–85. doi: 10.1084/jem.20180325 - DOI - PMC - PubMed
    1. Cooper BAM, Dalton DK, Stewart TA, Griffin JP, Russell DG, Orme IM. Disseminated tuberculosis in interferon gamma gene-disrupted mice. J Exp Med (1993) 178(6):2243–7. doi: 10.1084/jem.178.6.2243 - DOI - PMC - PubMed

Publication types

MeSH terms