. 2022 Dec 14:13:1082154.
doi: 10.3389/fimmu.2022.1082154. eCollection 2022.

Oxygen level is a critical regulator of human B cell differentiation and IgG class switch recombination

Affiliations

Oxygen level is a critical regulator of human B cell differentiation and IgG class switch recombination

Jana Koers et al. Front Immunol. .

Abstract

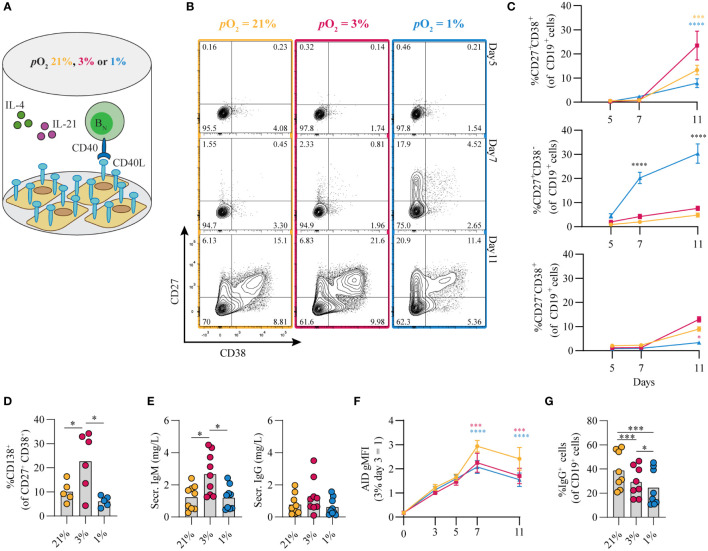
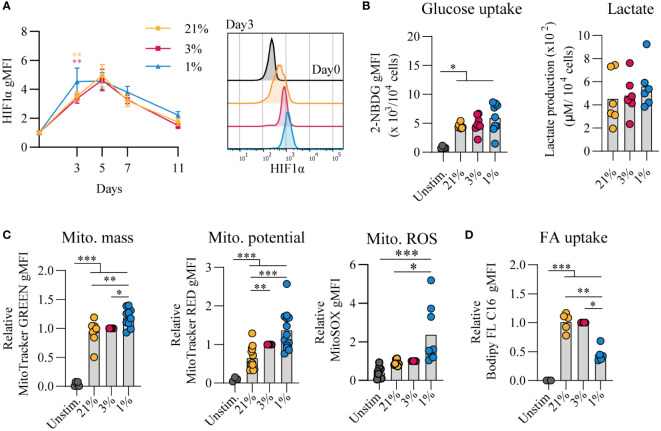
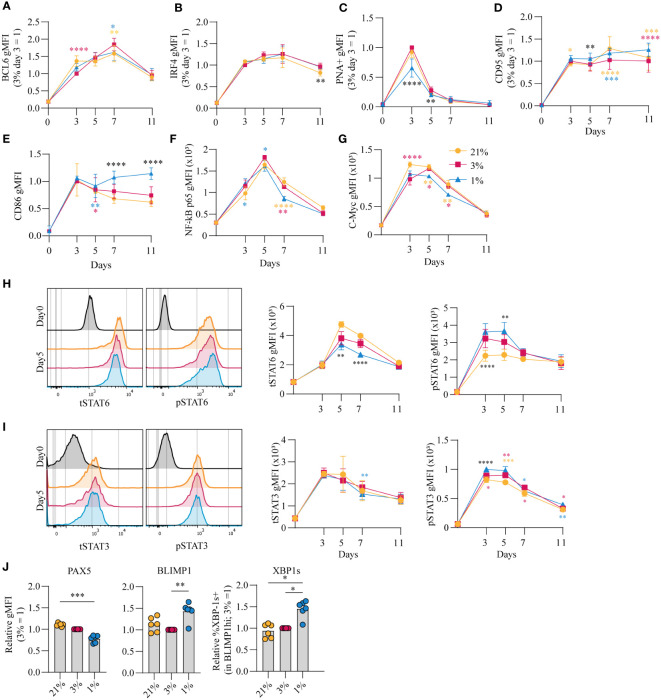
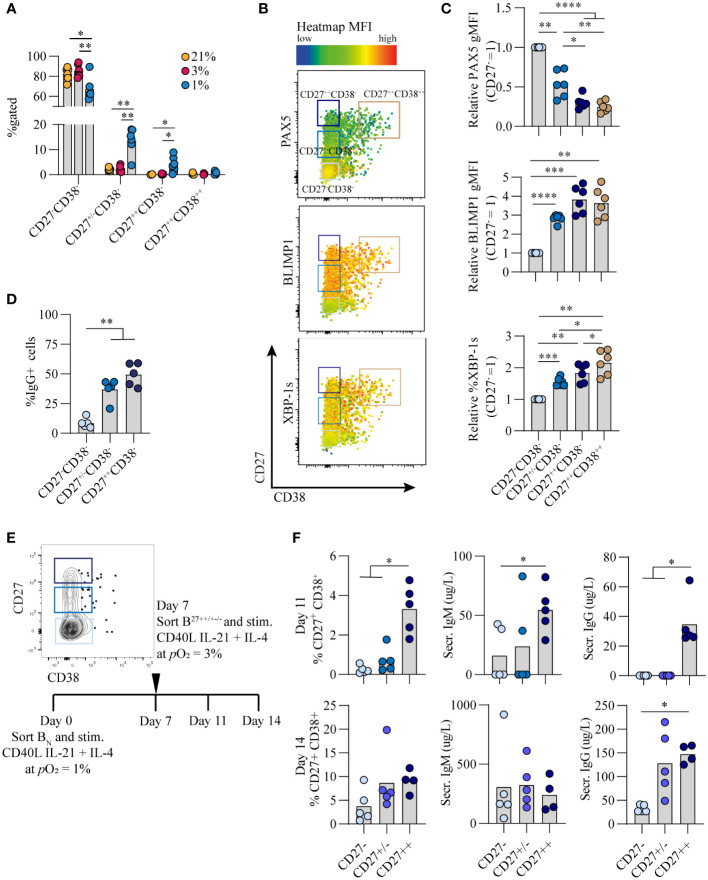
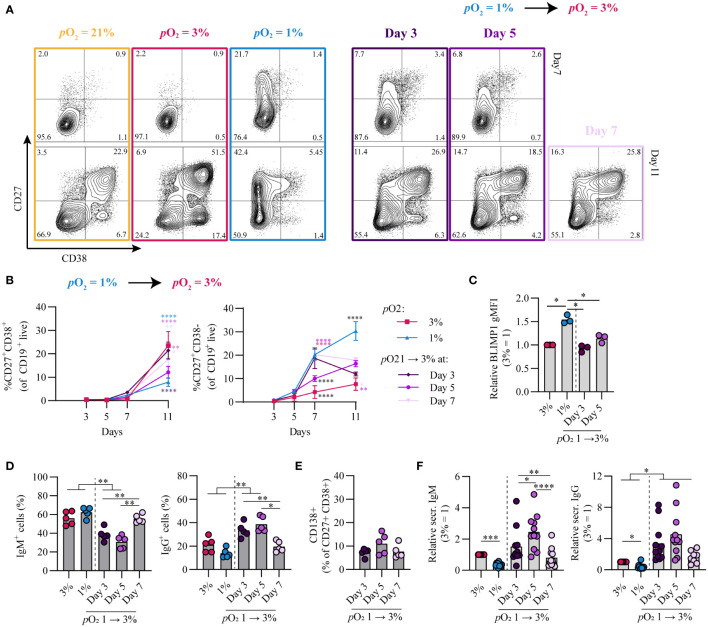
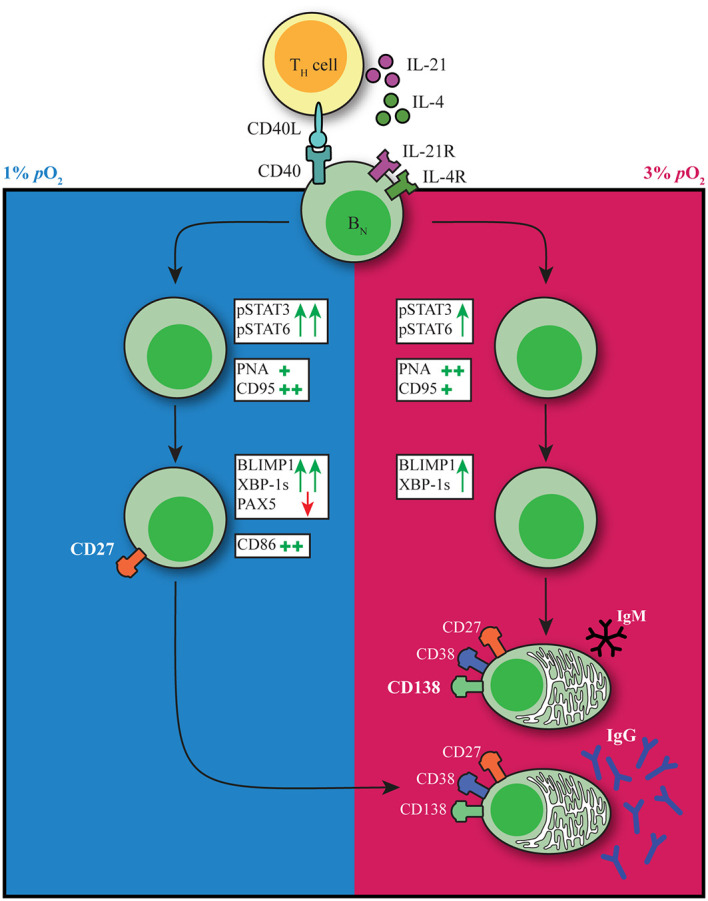
The generation of high-affinity antibodies requires an efficient germinal center (GC) response. As differentiating B cells cycle between GC dark and light zones they encounter different oxygen pressures (pO2). However, it is essentially unknown if and how variations in pO2 affect B cell differentiation, in particular for humans. Using optimized in vitro cultures together with in-depth assessment of B cell phenotype and signaling pathways, we show that oxygen is a critical regulator of human naive B cell differentiation and class switch recombination. Normoxia promotes differentiation into functional antibody secreting cells, while a population of CD27++ B cells was uniquely generated under hypoxia. Moreover, time-dependent transitions between hypoxic and normoxic pO2 during culture - reminiscent of in vivo GC cyclic re-entry - steer different human B cell differentiation trajectories and IgG class switch recombination. Taken together, we identified multiple mechanisms trough which oxygen pressure governs human B cell differentiation.

Keywords: B cells; antibody-secreting cell; class switch recombination; differentiation; germinal center; hypoxia.


Conflict of interest statement

The authors declare that the research was conducted in the absence of any commercial or financial relationships that could be construed as a potential conflict of interest.

Figures

Figure 1
Figure 1
Differential pO2 controls human B cell differentiation into CD27+ and antibody secreting cell compartments. (A) Schematic overview of B cell in vitro culture system. 250 resting human naive B cells (CD19+CD27-IgD+) were stimulated using a human CD40L-expressing feeder cell layer (subtype ‘High’ (12),); recombinant human IL-4 (25ng/ml) and IL-21 (50ng/ml); and cultured at 5% pCO2 and 21, 3, or 1% pO2 for a maximum of 11 days. (B) Representative biaxial CD27/CD38 FACS plots after 5, 7, and 11 days of culture at 21, 3, or 1% pO2. (C) Quantification of the percentages of CD27 and CD38 subpopulations within total CD19+ B cells over time (n = 9). (D) CD138 expression within the CD27+CD38+ antibody secreting cell population (n = 6). (E) Cumulative secretion of IgM and IgG measured in culture supernatants after 11 days (n = 9). (F) gMFI of AID expression over time (n = 3). (G) Percentage of IgG+ cells within CD19+ B cells, combined surface and intracellular staining (n = 8). Bars represent means of biological replicates each composed of 2 technical replicates in (D, F) 2, (E, G) 3 or (C) 4 independent experiments. Statistical differences were determined using (C, F) mixed-effects analysis using Tukey’s test for multiple comparisons (D, E, G) repeated measures one-way ANOVA using Tukey’s test for multiple comparisons. *p < 0.05, ***p < 0.001, ****p < 0.0001.
Figure 2
Figure 2
Proliferative human B cells adopt glycolysis and mitochondrial-associated ROS levels are increased in hypoxic cultures (A) gMFI of HIF1α expression over time (n = 6) and histogram overlay at day 3. (B) Glucose uptake (2-NBG; (2-(N-(7-nitrobenz-2-oxa-1,3-diazol-4-yl)amino)-2-deoxyglucose) by B cells cultured for 7 days (n = 9). Lactate production measured in supernatants at day 11 in µM per 104 cultured B cells (n = 6). (C) gMFI of MitoTracker GREEN, MitoTracker RED, and MitoSOX after 7 days of culture (n = 8) indicative for mitochondrial mass, potential and ROS production, respectively. (D) Fatty acid (FA) uptake by B cells cultured for 7 days (n = 5). Bars represent means of biological replicates each composed of two technical replicates of (E) 1, (A, C) 2 or (B, D) 3 independent experiments. Statistical differences were determined using a repeated measures one-way ANOVA using Tukey’s test for multiple comparisons. *p < 0.05, **p < 0.01, ***p < 0.001.
Figure 3
Figure 3
pO2 steers canonical signaling pathways that direct naive B cell differentiation pathways (A-D) gMFI of (A) BCL-6 (n = 6) (B) IRF4 (n = 6) (C) PNA+ (n = 6) (D) CD95 (n = 6) (E) CD86 (n = 6) (F) NFκB active subunit p65 (n = 9) (G) c-Myc (n = 9) (H-I) gMFI of (H) tSTAT6 and pSTAT6 and (I) tSTAT3 and pSTAT3 over time in culture (n = 6) and (left panels) representative histogram overlays of pSTAT and tSTAT expression on day 5 of culture (J) gMFI of PAX5, BLIMP1 and %XBP-1s+ in BLIMP1hi cells (n=6) on day 7 (A-J) Bars represent means of biological replicates each composed of two technical replicates of 2 (H-J) or (A-G) 3 independent experiments (A-I) Differences in gMFI were determined using mixed-effects analysis using Tukey’s test for multiple comparisons. (J) Differences in gMFI were determined using repeated measures one-way ANOVA using Tukey’s tests for multiple comparisons. *p < 0.05, **p < 0.01, ***p < 0.001, ****p < 0.0001.
Figure 4
Figure 4
Hypoxic pO2 drives generation of a unique CD27++ B cell population, with enhanced antibody secreting cell differentiation capacity and Ig production upon restimulation (A) Quantification of percentage of CD27-CD38-, CD27+/-CD38-, CD27++CD38- and CD27++CD38++ cells on day 7 of culture (n = 5) (B) Representative biaxial flow cytometry plot of CD27 and CD38 expression, with heatmap depicting MFI expression of PAX5, BLIMP1 and XBP-1s on day 7. (C) gMFI of PAX5, BLIMP1 and XBP-1s in respective populations of CD27-CD38-, CD27+/-CD38-, CD27++CD38- and CD27++CD38++ cells on day 7 (n = 6) (D) Percentage of IgG+ B cells on day 7 of of culture at 1% pO2 within CD27++ CD38-, CD27+/- CD38- or CD27- CD38- populations. (n = 5) (E) Representative example of FACS sort gating strategy on day 7 to isolate CD27++ CD38-, CD27+/- CD38- or CD27- CD38- B cells with schematic experimental time line. (F) Quantification of %CD27+CD38+ cells by flow cytometry and IgG and IgM secretion by ELISA, 4 or 7 days after sort (day 11 or 14 of culture) (n = 5). (A-F) Bars represent means of biological replicates each composed of two technical replicates of (A, C, D) 2 or (F) 1 independent experiment (A) Differences in %gated cells were determined using mixed-effects analysis using Tukey’s test for multiple comparisons. (C, D, F) Differences in gMFI and % gated cells were determined using repeated measures one-way ANOVA using Tukey’s test for multiple comparisons. *p < 0.05, **p < 0.01, ***p < 0.001, ****p < 0.0001.
Figure 5
Figure 5
Time-dependent pO2 transitions alter naive B cell differentiation and IgG class switch recombination. (A) Representative biaxial CD27/CD38 FACS plots of 21, 3, 1% pO2 cultures and 1 – 3% pO2 transition cultures at day 3, 5 or 7 shown for day 7 and 11 of culture. (B) Quantification of CD27+CD38+ and CD27+CD38- B cells over time in culture (n = 11) (C) gMFI of BLIMP1 on day 7 (n = 3) (D) Frequency of IgM+ and IgG+ B cells on day 11 (n = 5). (E) CD138 expression within the CD27+CD38+ population (n = 5). (F) IgM and IgG levels were measured by ELISA in culture supernantant after 11 days (n = 11). Bars represent means of biological replicates each composed of two technical replicates of (B, F) 3, (D) 2 or (C, E) 1 independent experiment. (B) Statistical differences were determined using mixed-effects analysis using Tukey’s test for multiple comparisons (C-F) Differences in gMFI, % gated cells and Ig production were determined using repeated measures one-way ANOVA using Tukey’s test for multiple comparisons. *p < 0.05, **p < 0.01, ***p < 0.001, ****p < 0.0001.
Figure 6
Figure 6
pO2 as a critical driver of B cell differentiation in vitro. Schematic representation of the effect of differential pO2 on B cell differentiation and underlying signaling pathways.

References

    1. Elsner RA, Shlomchik MJ. Germinal center and extrafollicular b cell responses in vaccination, immunity and autoimmunity. Immunity (2020) 53(6):1136–50. : doi: 10.1016/j.immuni.2020.11.006 - DOI - PMC - PubMed
    1. Weisel FJ, Zuccarino-Catania GV, Chikina M, Shlomchik MJ. A temporal switch in the germinal center determines differential output of memory b and plasma cells. Immunity (2016) 44(1):116–30. doi: 10.1016/j.immuni.2015.12.004 - DOI - PMC - PubMed
    1. Laidlaw BJ, Cyster JG. Transcriptional regulation of memory b cell differentiation. Nat Rev Immunol (2021) 21(4):209–20. doi: 10.1038/s41577-020-00446-2 - DOI - PMC - PubMed
    1. Suan D, Kräutler NJ, Maag JLV, Butt D, Bourne K, Hermes JR, et al. . CCR6 defines memory b cell precursors in mouse and human germinal centers, revealing light-zone location and predominant low antigen affinity. Immunity (2017) 47(6):1142–1153.e4. doi: 10.1016/j.immuni.2017.11.022 - DOI - PubMed
    1. Cunningham AF, Gaspal F, Serre K, Mohr E, Henderson IR, Scott-Tucker A, et al. . Salmonella induces a switched antibody response without germinal centers that impedes the extracellular spread of infection. J Immunol (2007) 178(10):6200–7. doi: 10.4049/jimmunol.178.10.6200 - DOI - PubMed

Publication types