. 2023 Feb 21;147(8):669-685.
doi: 10.1161/CIRCULATIONAHA.122.063075. Epub 2023 Jan 2.

Targeting Epsins to Inhibit Fibroblast Growth Factor Signaling While Potentiating Transforming Growth Factor-β Signaling Constrains Endothelial-to-Mesenchymal Transition in Atherosclerosis

Affiliations

Targeting Epsins to Inhibit Fibroblast Growth Factor Signaling While Potentiating Transforming Growth Factor-β Signaling Constrains Endothelial-to-Mesenchymal Transition in Atherosclerosis

Yunzhou Dong et al. Circulation. .

Abstract

Background: Epsin endocytic adaptor proteins are implicated in the progression of atherosclerosis; however, the underlying molecular mechanisms have not yet been fully defined. In this study, we determined how epsins enhance endothelial-to-mesenchymal transition (EndoMT) in atherosclerosis and assessed the efficacy of a therapeutic peptide in a preclinical model of this disease.

Methods: Using single-cell RNA sequencing combined with molecular, cellular, and biochemical analyses, we investigated the role of epsins in stimulating EndoMT using knockout in Apoe-/- and lineage tracing/proprotein convertase subtilisin/kexin type 9 serine protease mutant viral-induced atherosclerotic mouse models. The therapeutic efficacy of a synthetic peptide targeting atherosclerotic plaques was then assessed in Apoe-/- mice.

Results: Single-cell RNA sequencing and lineage tracing revealed that epsins 1 and 2 promote EndoMT and that the loss of endothelial epsins inhibits EndoMT marker expression and transforming growth factor-β signaling in vitro and in atherosclerotic mice, which is associated with smaller lesions in the Apoe-/- mouse model. Mechanistically, the loss of endothelial cell epsins results in increased fibroblast growth factor receptor-1 expression, which inhibits transforming growth factor-β signaling and EndoMT. Epsins directly bind ubiquitinated fibroblast growth factor receptor-1 through their ubiquitin-interacting motif, which results in endocytosis and degradation of this receptor complex. Consequently, administration of a synthetic ubiquitin-interacting motif-containing peptide atheroma ubiquitin-interacting motif peptide inhibitor significantly attenuates EndoMT and progression of atherosclerosis.

Conclusions: We conclude that epsins potentiate EndoMT during atherogenesis by increasing transforming growth factor-β signaling through fibroblast growth factor receptor-1 internalization and degradation. Inhibition of EndoMT by reducing epsin-fibroblast growth factor receptor-1 interaction with a therapeutic peptide may represent a novel treatment strategy for atherosclerosis.

Keywords: EndoMT; adaptor proteins, signal transducing; atherosclerosis; endocytosis; epsin; peptides; receptor, fibroblast growth factor, type 1; single-cell gene expression analysis; transforming growth factor beta; vascular diseases.


Figures

Figure 1.
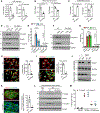
Figure 1.. Single cell RNA sequencing analysis reveals epsins are required for EndoMT.
A, Cell type clusters of Apoe−/− and EC-iDKO/Apoe−/− mice, including EC, EndoMT cells, SMC, fibroblast and immune/inflammatory cell types; B, Proportion of SMC, fibroblast and immune/inflammatory cells; C, Representative markers for the labeling cell distribution in UMAP visualization for EndoMT model. Col1a1 is specific to SMC and Pecam1 to EC. D, EC clusters were further divided to 4 subgroups as indicated. The proportion of EC and endothelial-to-mesenchymal transition (EndoMT) cell types was identified in the Pecam1 positive cluster. Apoe−/− and EC-iDKO/Apoe−/− is obviously different, p=2.2e-16 by χ2 test. E, F, Violin plots of EC and SMC markers differentially expressed in Apoe−/− and EC-iDKO/Apoe−/− mice in the endothelial subgroups of EC marker positive cells (Pecam1, Egfl1, Cdh5, Cldn5, and Cytl1) and SMC maker positive cells (Cnn1, Myocd, Itga9, Dmpk, and Col1a1). P value is calculated via Wilcoxon test. G, H, WT and EC-iDKO mice were fed on WD for 14 weeks, followed by the aortic cell isolation and scRNA seq analysis. Similarly, Pecam1 and Col1a1 were chosen as EC and SMC marker respectively and the UMAP plot was shown in (G). In EC clusters, the proportion of the 4 subgroups in (D) is illustrated in (H). WT and EC-iDKO is significantly different, p=8.08e-13 by χ2 test. I, Heatmap of TGFβ receptor and FGFR1 signaling in Apoe−/− and EC-iDKO/Apoe−/− in EC cluster. J, K, Gene expression of representative markers specific to EC (Pecam1) and SMC (Myl9) through the EC→EndoMT→SMC process is shown as normalized expression vs. UMAP_1 (also refer to the Figure S8 with more maker genes). L, M, Inference of pseudotimes for EndoMT trajectory from EC to SMC by Slingshot. A linear transition was identified from EC to SMC in aortas of mouse models.
Figure 2.
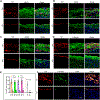
Figure 2.. EndoMT is attenuated in EC-iDKO/Apoe−/− mice.
A, B, Immunostaining of aortic roots with CD31 and EndoMT markers α-SMA (A), MyH11 (B) in Apoe−/− and EC-iDKO/Apoe−/− mice fed WD for 12 weeks. EndoMT is expressed as the percentile of number of cells co-expressing both EC and SMC markers in total EC cells/per microscopic field. n=5 mice in each group, and 5~8 microscopy fields were captured for the mean number of each mouse. P value was indicated in the bar graph. Scale bar: 20 μm, and magnified: 10 μm. C, D, Immunostaining of BCA with CD31 and EndoMT markers α-SMA (C), MyH11 (D) were co-stained with CD31 in Apoe−/− and EC-iDKO/Apoe−/− mice fed WD for 12 weeks. n=5 mice in each group, and 5~8 microscopy fields were captured for the mean number of each mouse. P value was indicated in the bar graph. Scale bar: 20 μm, and magnified: 10 μm. All statistical analysis (A to D) between Apoe−/− and EC-iDKO/Apoe−/− comparison is conducted by Student’s t-test.
Figure 3.
Figure 3.. Loss of endothelial epsins inhibits EndoMT via TGF-ß signaling in vitro and in vivo.
A to C, MAECs of WT and EC-iDKO were treated by 10 ng/mL TGF-ß for 2 days, change fresh medium and TGF-ß every-other-day, followed by qPCR to detect EndoMT markers. SMC markers Acta2, N-cadherin, Mesenchymal markers Collagen 1a, Fibronectin, endothelial markers VE-cadherin and Claudin-5 were measured respectively. n=3, *P<0.01. WT vs. EC-iDKO is conducted by the Student’s t-test. D to G, MAECs of WT and EC-iDKO were treated by 10 ng/mL TGF-ß or 100 μg/mL oxLDL for 5 days, followed by western blot with specific antibodies for the phospho-Smad2 & phospho-Smad1/5 in TGF-ß signaling (D, E) and target gene expression (F, G). For Figure E statistical analysis of P-Smad2 or P-Smad1/5, WT vs. EC-iDKO treated with TGFb or oxLDL were compared by the Student’s t-test, respectively, and summarized together as shown; n=4, P<0.001. Similarly, for Figure G statistical analysis of N-Cadherin or Slug, WT vs. EC-iDKO treated with TGFβ or oxLDL were compared by Student’s t-test, respectively, and summarized together as shown; n=4, P<0.001. H, I, Smad2 translocation was measured by immunofluorescent co-immunostaining Smad2 and Phalloidin-Flu 594. MAECs of WT and EC-iDKO were treated by 10 ng/mL TGF-ß or 100 μg/mL oxLDL for 5 days. n=5, P<0.001. WT vs. EC-iDKO comparison was conducted by the Student’s t-test. J, Cytosol and nuclei fractionation for WT and EC-iDKO cells with or without TGFβ treatment (10 ng/ml for 3 days). Fractionation is subjected to western blot using Samd2 antibody, GAPDH and H2A.X served as cytosol and nuclei control respectively. n=3. K, Co-immunostaining of CD31 and Myh11 for MAECs of WT and EC-iDKO treated by 10 ng/mL TGF-ß for a week. n=7; WT vs. EC-iDKO comparison is conducted by the Student’s t-test; P<0.001. Scale bars: 50 μm for (D, E, F). Magnified in (F): 25 μm L to M, TGF-ß signaling as indicated by phospho-Smad2 and phospho-Smad1/5 was measured in western blot from brachiocephalic artery (BCA) samples of WT and EC-iDKO mice fed western diet for 8 weeks. WT mice fed normal chow diet (ND) services as basal level controls. n=3 in each group. * WT/ND vs WT/WD, P<0.001; # WT/WD vs EC-iDKO/WD, *, ** P<0.001. Statistical analysis of p-Smad2 and p-Smad1/5 for WT/WD vs. EC-iDKO (WD) in Figure M is performed by Student’s t-test separately.
Figure 4.
Figure 4.. Endothelial epsins promote EndoMT by accelerating UIM-dependent FGFR1 endocytosis and degradation.
A, B, MAECs isolated from WT and Epsin1f/f :Epsin2−/−:iCDH5-Cre mice were both treated with 5 μM tamoxifen for 5 days, followed by the treatment of 2 or 10 ng/mL TGF-ß for 3 days (maintain 1 μM tamoxifen during this stage). Cell lysates were subjected to western blot with specific antibody to FGFR1. n=3; in WT, Ctr vs. TGFb2 vs. TGFb10, One-way ANOVA analysis, shown no statistical difference (n.s); in EC-iDKO, Ctr vs. TGFb2 vs. TGFb10, One-way ANOVA analysis, shown no statistical difference (n.s); WT-Ctr vs. EC-iDKO-Ctr, P<0.001 by Student’s t-test, so do the comparison in TGFb2 and TGFb10 in WT vs. EC-iDKO, and summarized as shown *P<0.001. C, D, Epsin 1 and 2 were knockdown in human aortic endothelial cells (HAECs) by different concentration of siRNA, and cell lysates were subjected to western blot for FGFR1. n=3; Similarity, WT vs. EC-iDKO comparison is conducted by the same analysis as Figure (B), * P<0.001. n.s., no statistical difference. E to H, Epsin 1 interacts with FGFR1 in reciprocal IP analysis. WT MAECs were cultured in complete EC medium and cell lysates were co-immunoprecipitated with Epsin1 (E) or FGFR1 (G). IgG as controls in co-IP experiment. Quantification is illustrated in (F) and (H) respectively. n=3; WT vs. EC-iDKO comparison for FGFR1 and Epsin 1 is conducted by Student’s t-test, respectively; *, ** P<0.001. I, J, Biotinylation of PM FGFR1 assay and western blotting for PM FGFR1 after FGF (10 ng/ml) used to treat cells for the indicated time points. I, FGFR1 in PM; J, decay rate of FGFR1 in WT and EC-iDKO MAECs. n=3, WT vs. EC-iDKO comparison, point by point, is conducted by Student’s t-test, respectively; *P<0.001. K to M, HA-tagged Epsin 1 or Epsin 1ΔUIM were co-transfected with FGFR1 plasmid into WT MAECs by electroporation (Lonza), after 36 hours, cell lysis was immunoprecipitated with FGFR1 antibody, followed by western blot with HA antibody. (M) Input for the IP analysis in (K). L, quantification for (K), n=3, WT vs. WT−ΔUIM is performed by Student’s t-test; † P<0.0001.
Figure 5.
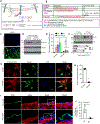
Figure 5.. API peptide administration prevents TGF-ß signaling activation in vitro and in the Apoe−/− model.
A, Strategy for the design of a synthetic peptide API to competitively bind FGFR1 and block endogenous epsin binding. B, Peptide sequences used in this study. C, Co-incubation of 100 μg/mL oxLDL and 25 μM FITC-API or FITC-UIM for 15 h, cells were then fixed and stained with DAPI as reference. Images were captured under Olympus microscopy. Scale bar: 100 μm. D, E, WT MAECs were pre-loaded with 50 μM control or API peptide, followed by the treatment of TGF-ß (10 ng/mL) as indicated time points. Phospho-Smad2 was measured in western blot and quantified (E). n=3, Ctrl vs. API is conducted by Student’s t-test in different time point, respectively; *P<0.001. F, 50 μM Ctrl and API peptides are preloaded to MAECs respectively for 2 days, followed by the biotinylation of PM FGFR1 assay and western blotting for PM FGFR1 after FGF (10 ng/ml) treatment for the indicated time points. Cell lysates are subjected to western blot with FGFR1 antibody. n=3. * P<0.001. A point-to-point comparison is conducted by Student’s t-test, respectively. G, H, WT MAECs were pre-loaded with 50 μM control or API peptide, followed by the treatment of TGF-ß (10 ng/mL) for 3 days, and co-stained Smad2 nuclei translocation with Phalloidin-594 (F) and quantified (G). n=8, Ctrl vs. API is conducted by the Student’s t-test; *P<0.001. I, J, Control or API peptide treated mice for 12 weeks on WD was co-stained with CD31 and SMC markers α-SMA (I) and quantification (J), n=5 mice in each group, and 5 microscopy fields were captured for the mean number of each mouse. Ctrl vs. API is conducted by Student’s t-test; * P<0.01. Scale bar: 200 μm (F), 20 μm (I).
Figure 6.
Figure 6.. API peptide inhibits TGFβ-mediated EndoMT and atherosclerosis in Tdt/PCSK9 mouse model.
A to E, Tdt/PCSK9 mice were fed WD and treated with ctrl or API peptide (50 mg/kg, once a week by I. V. route) for 16 weeks, and mouse aortic hearts and roots were harvested and processed ORO staining, as well as immunofluorescent staining using SMC marker (Myh11, SM22, αSMA and Calponin); the representative images are taken and quantified for 5 mice in each group, containing 5 microscopic fields for each mouse sample. TDT protein labeled EC cells, if migrated to the lesion area, are counted as EndoMT cells and quantified in Figure (E). Ctrl vs. API is performed using the Student’s t-test, n=5, * P<0.001. Scale bar: 20 μm. F, Measurement of P-Smad2 activation. Cells with TDT protein merged P-Smad2 is counted as Smad2 activation (localized in nucleus). Quantification is presented in Figure 6E (the right grey panel). n=5, ** P<0.001, Ctrl vs. API for the P-Smad2 is performed by Student’s t-test. Scale bar: 20 μm.
Figure 7.
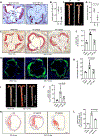
Figure 7.. API peptide therapy reduces atherosclerosis in the Apoe−/− mouse model.
A to D, Administration of API peptide significantly attenuated atherosclerosis in aortic roots (A, B) and aortic arches (C, D) in an Apoe−/− animal model. Peptide dose is 25 mg/kg, IV route, and twice a week. n=8 in each group; Ctrl vs. API by Student’s t-test for Figures (B) and (D); * or ** P<0.05. Scale bars: 500 μm (A); 5 mm (C). E to L, API peptide treatment in lesion-laden Apoe−/− models blocked the progression of atherosclerosis. Age matched male Apoe−/− mice were fed WD for 6 weeks (sacrificed some mice as basal controls), and started to inject API peptide or control peptide (25 mg/kg, I. V. twice a week) for another 6 weeks, aortic roots (E, F), arches (I, J) and BCA (K, L) were stained with ORO and quantified. Macrophage staining is performed using CD68 antibody (immunofluorescent staining) (G, H). Basal control, n=3; peptide injected group, n=5. P values were labelled in the bar graphs. Ctrl pep. vs. API pep. is conducted by Student’s t-test for Figures F, H, J and L. Scale bar: 500 μm (E); 5 mm (G); 200 μm (I).
Figure 8.
Figure 8.. API administration inhibits EndoMT and atherosclerosis in Apoe−/− mouse model.
Under physiological conditions, Epsins bind FGFR1 via their UIM domain to promote endocytosis, resulting in receptor degradation in the lysosome. Under inflammatory conditions, internalization and degradation of FGFR1 facilitates EndoMT to potentiate atherosclerosis. Application of the synthetic API bind to FGFR1 competitively blocks the ability of endogenous epsins to bind FGFR1, which is replicates genetic epsin deficiency. In both of the latter circumstances, FGFR1 remains at the plasma membrane to inhibit EndoMT induced by inflammation.

References

    1. Lusis AJ. Atherosclerosis. Nature. 2000;407:233–241. - PMC - PubMed
    1. Linton MRF, Yancey PG, Davies SS, Jerome WG, Linton EF, Song WL, Doran AC and Vickers KC. The Role of Lipids and Lipoproteins in Atherosclerosis. In: Feingold KR, Anawalt B, Boyce A, Chrousos G, de Herder WW, Dhatariya K, Dungan K, Hershman JM, Hofland J, Kalra S, Kaltsas G, Koch C, Kopp P, Korbonits M, Kovacs CS, Kuohung W, Laferrere B, Levy M, McGee EA, McLachlan R, Morley JE, New M, Purnell J, Sahay R, Singer F, Sperling MA, Stratakis CA, Trence DL, and Wilson DP, eds. Endotext South Dartmouth (MA); 2000.
    1. Dong Y, Fernandes C, Liu Y, Wu Y, Wu H, Brophy ML, Deng L, Song K, Wen A, Wong S, Yan D, Towner R and Chen H. Role of endoplasmic reticulum stress signalling in diabetic endothelial dysfunction and atherosclerosis. Diab Vasc Dis Res. 2017;14:14–23. - PMC - PubMed
    1. Gimbrone MA Jr. and Garcia-Cardena G. Endothelial Cell Dysfunction and the Pathobiology of Atherosclerosis. Circ Res. 2016;118:620–36. - PMC - PubMed
    1. Hansson GK, Robertson AK and Soderberg-Naucler C. Inflammation and atherosclerosis. Ann Rev Pathol. 2006;1:297–329. - PubMed

Publication types