. 2023 Feb;299(2):102857.
doi: 10.1016/j.jbc.2022.102857. Epub 2022 Dec 31.

A liquid-to-solid phase transition of Cu/Zn superoxide dismutase 1 initiated by oxidation and disease mutation

Affiliations

A liquid-to-solid phase transition of Cu/Zn superoxide dismutase 1 initiated by oxidation and disease mutation

Siyu Gu et al. J Biol Chem. 2023 Feb.

Abstract

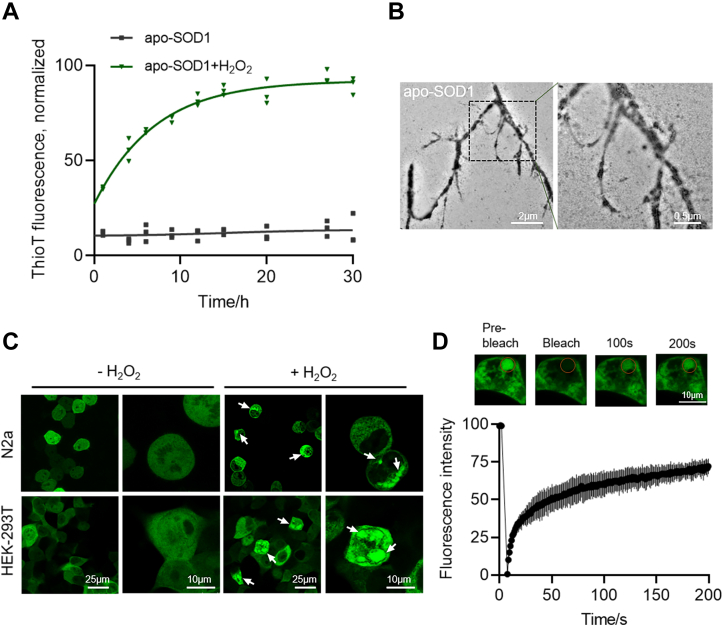
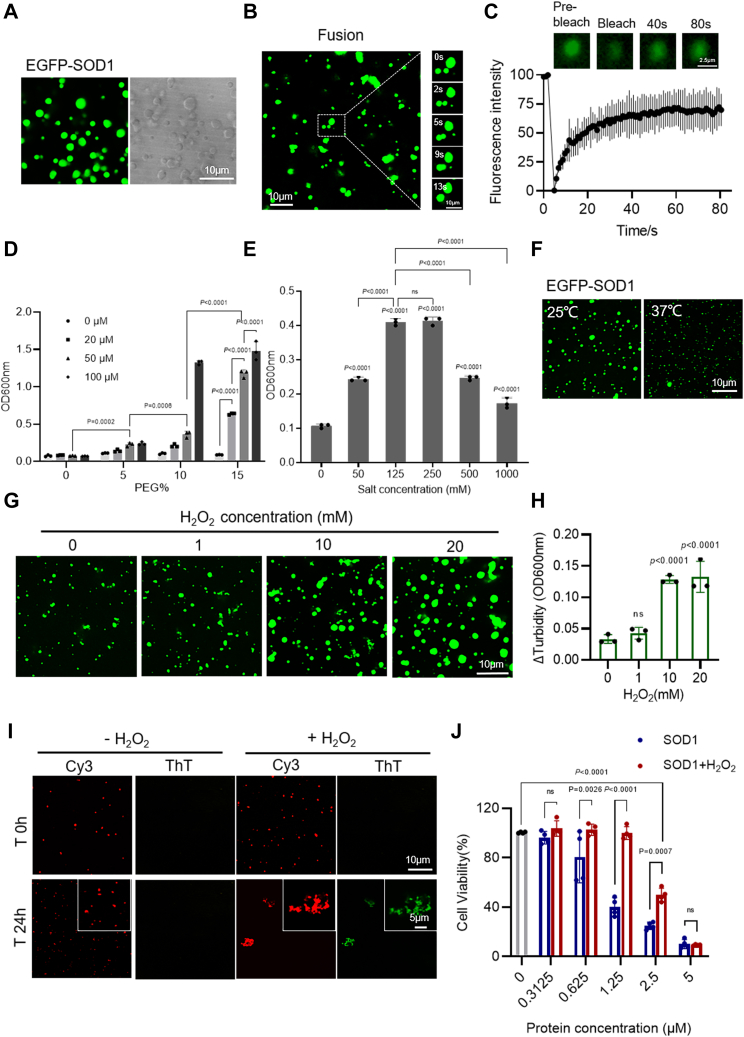
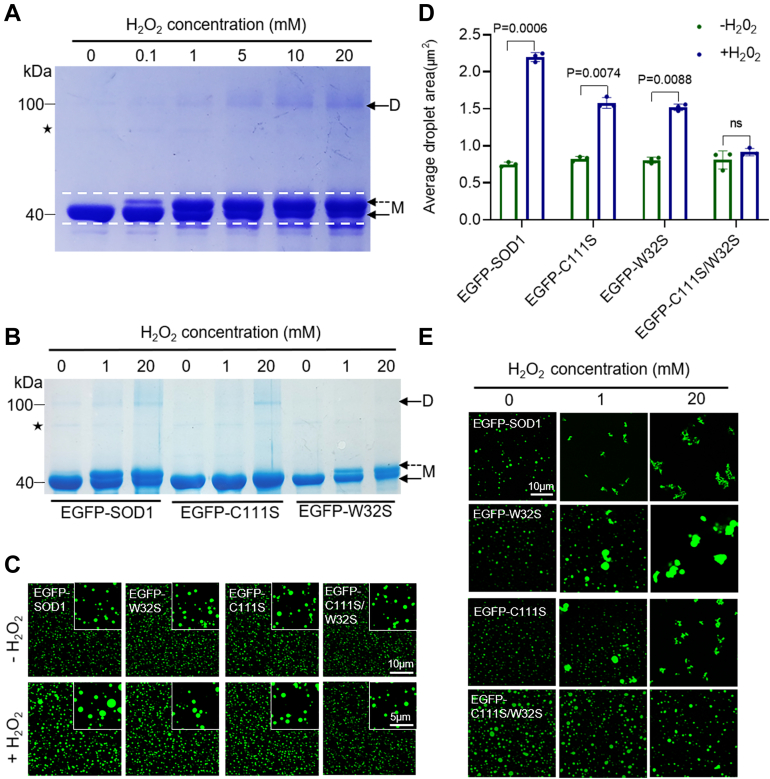
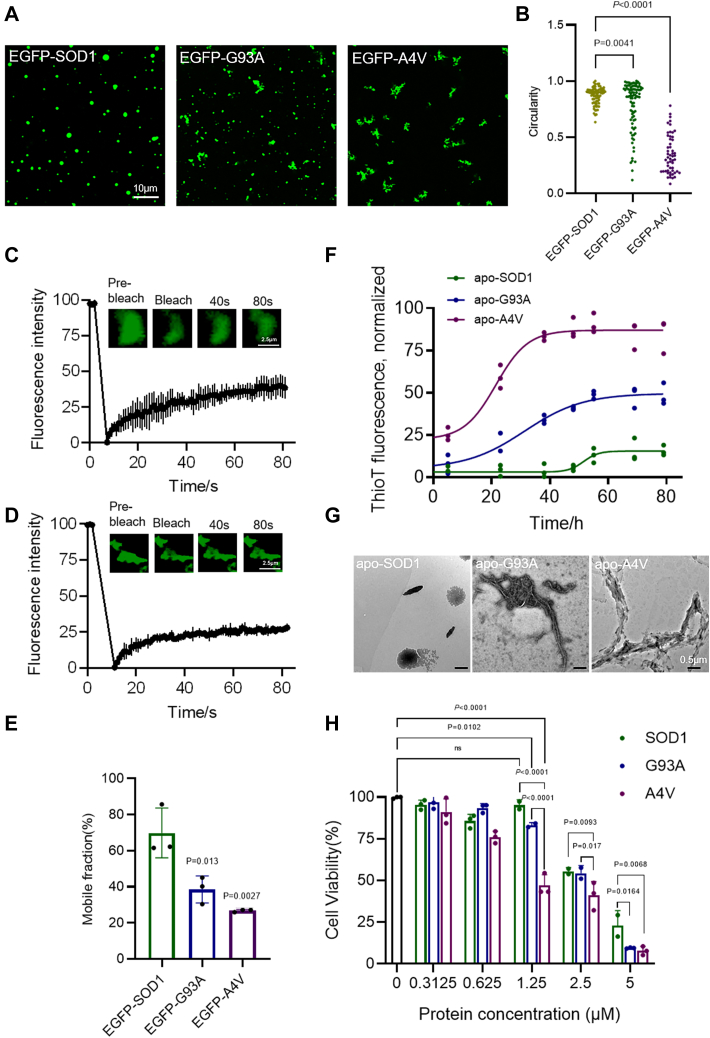
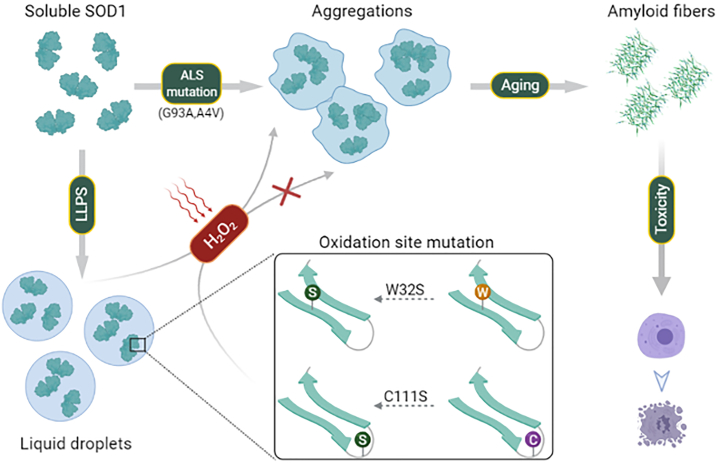
Cu/Zn superoxide dismutase 1 (SOD1) has a high propensity to misfold and form abnormal aggregates when it is subjected to oxidative stress or carries mutations associated with amyotrophic lateral sclerosis. However, the transition from functional soluble SOD1 protein to aggregated SOD1 protein is not completely clear. Here, we propose that liquid-liquid phase separation (LLPS) represents a biophysical process that converts soluble SOD1 into aggregated SOD1. We determined that SOD1 undergoes LLPS in vitro and cells under oxidative stress. Abnormal oxidation of SOD1 induces maturation of droplets formed by LLPS, eventually leading to protein aggregation and fibrosis, and involves residues Cys111 and Trp32. Additionally, we found that pathological mutations in SOD1 associated with ALS alter the morphology and material state of the droplets and promote the transformation of SOD1 to solid-like oligomers which are toxic to nerve cells. Furthermore, the fibrous aggregates formed by both pathways have a concentration-dependent toxicity effect on nerve cells. Thus, these combined results strongly indicate that LLPS may play a major role in pathological SOD1 aggregation, contributing to pathogenesis in ALS.

Keywords: SOD1; aggregation; liquid-liquid phase separation; neurodegenerative diseases; oxidation.


Conflict of interest statement

Conflict of interest The authors declare that they have no conflicts of interest with the contents of this article.

Figures

Figure 1
Figure 1
SOD1 forms misfolding by oxidative stress in cells and in vitro.A, thio T fluorescence assay of 40 μM apo-SOD1 with or without 200 μM H2O2. The intensity was normalized with the highest intensity as 100% and the lowest intensity as 0%. n = 3 biologically independent samples, data are presented as mean values ± S.D. B, TEM image of 40 μM, oxidized apo-SOD1. Scale bars represent 500 nm. C, confocal microscopy images of EGFP-SOD1 aggregates (arrows) in both N2a and HEK-293T cells after H2O2 treatment (100 μM, 3 h). Scale bar represents 25 μm, 10 μm. D, FRAP of the condensates formed by oxidized SOD1 in HEK-293T cells. The intensity was normalized with the pre-bleached as 100% and the first time point after bleaching as 0%. n = 3 biologically independent samples, data are presented as mean values ± S.D. Scale bar represents 10 μm. FRAP, fluorescence recovery after photobleaching; SOD, superoxide dismutase; TEM, transmission electron microscope.
Figure 2
Figure 2
H2O2promotes SOD1 phase separation.A, confocal microscopy images of 100 μM EGFP-SOD1 with 10% PEG. Scale bar represents 10 μm. B, droplet fusion experiment of 100 μM EGFP-SOD1 with 10% PEG. Scale bar represents 10 μm. C, FRAP of the droplets formed by 40 μM EGFP-SOD1 with 10% PEG. The intensity was normalized with the pre-bleached as 100% and the first time point after bleaching as 0%. n = 3 biologically independent samples, data are presented as mean values ± S.D. Scale bar represents 2.5 μm. D, turbidity measurement of 0 to 100 μM EGFP-SOD1 with 0 to 15% PEG. n = 3 biologically independent samples. Data are presented as mean values ± S.D. Data were analyzed by two-way ANOVA with multiple comparisons. E, turbidity measurement of 40 μM EGFP-SOD1 with 0 to 1000 mM NaCl concentrations in the presence of 10% PEG. n = 3 biologically independent samples. Data are presented as mean values ± S.D. Data were analyzed by ordinary one-way ANOVA with multiple comparisons. ns, not significant. F, confocal microscopy images of 20 μM EGFP-SOD1 at 25 °C or 37 °C in the presence of 15% PEG. Scale bar represents 10 μm. G, confocal microscopy images of 40 μM EGFP-SOD1 treated with H2O2 (0–20 mM, incubated for 2 h at room temperature) in the presence of 136 mM NaCl and 10% PEG. Scale bar represents 10 μm. H, difference in turbidity before and after incubation with H2O2 (ranging from 0–20 mM). Δturbidity = (A600 nm at 2 h − A600 nm at 0 h). n = 3 biologically independent samples. Data are presented as mean values ± S.D. Data were analyzed by ordinary one-way ANOVA with multiple comparisons. ns, not significant. I, confocal microscopy images of SOD1(100 μM, 15% PEG) colocalized with 20 μM ThT in the presence or absence of 1 mM H2O2 (at room temperature for 24 h). Scale bar represents 10 μm. J, cytotoxicity of 40 μM SOD1 with or without 200 μM H2O2 measured by CCK-8 method. Cells were incubated with oxidized or unoxidized SOD1 at 37 °C for 3 days, by which time fibrils had formed in the cells. n = 4 biologically independent samples. Data are presented as mean values ± S.D. Data were analyzed by two-way ANOVA with multiple comparisons. ns, not significant. FRAP, fluorescence recovery after photobleaching; SOD, superoxide dismutase; ThT, thioflavin T.
Figure 3
Figure 3
H2O2regulates SOD1 LLPS associated with Cys111 and Trp32.A, SDS-PAGE of 10 μM EGFP-SOD1 was treated with 0 to 20 mM H2O2 after 2 h at 37 °C. M: monomer, D: dimer. Dashed arrows indicated oxidation upshift strips. Asterisks indicated impure protein. B, SDS-PAGE of 10 μM EGFP-SOD1, C111S, and W32S treated with 0, 1, 20 mM H2O2 after 2 h at 37 °C. M: monomer, D: dimer. Dashed arrows indicated oxidation upshift strips. Asterisks indicated impure protein. C, confocal microscopy images of 20 μM EGFP-SOD1, EGFP-C111S, EGFP-W32S, EGFP-C111S/W32S with or without H2O2 (1 mM, 2 h at room temperature) in the presence of 15% PEG. Scale bar represents 10 μm. D, area quantification of the droplets from (B) via intensity thresholding and region of interest (ROI) auto-selection. Histogram of the average area of all droplets. n = 3 biologically independent samples. Data are presented as mean values ± S.D. Data were analyzed by two-way ANOVA with multiple comparisons. ns, not significant. E, confocal microscopy images of 40 μM EGFP-SOD1, EGFP-C111S, EGFP-W32S, EGFP-C111S/W32S treated with H2O2 (0, 1, 20 mM; 10% PEG; 37 °C for 2 h). Scale bar represents 10 μm. LLPS, liquid-liquid phase separation; SOD, superoxide dismutase.
Figure 4
Figure 4
ALS mutations induce SOD1 protein aggregation.A, confocal microscopy images of condensates formed by 50 μM EGFP-SOD1 or mutants with 10% PEG. Scale bar represents 10 μm. B, circularity quantification of the droplets/condensates in (A) via intensity thresholding and region of interest (ROI) auto-selection, circularity = 4π × [Area]/([Perimeter]∧2) ranges from 0 (infinitely elongated polygon) to 1 (positive circle). Dot plot of circularity of all droplets/condensates. n = 3 biologically independent samples, data were analyzed by ordinary one-way ANOVA with multiple comparisons. C, FRAP of the condensates formed by EGFP-G93A. The intensity was normalized with the pre-bleached as 100% and the first time point after bleaching as 0%. n = 3 biologically independent samples, data are presented as mean values ± S.D. Scale bar represents 2.5 μm. D, FRAP of the condensates formed by EGFP-A4V. The intensity was normalized with the pre-bleached as 100% and the first time point after bleaching as 0%. n = 3 biologically independent samples, data are presented as mean values ± S.D. Scale bar represents 2.5 μm. E, quantification of mobile fraction of EGFP-SOD1 or mutants. n = 3 biologically independent samples. Data are presented as mean values ± S.D. Data were analyzed by ordinary one-way ANOVA with multiple comparisons. F, ThT fluorescence assay of 40 μM apo-SOD1 and mutants. n = 3 biologically independent samples. Data are presented as mean values ± S.D. G, TEM images of 40 μM apo-SOD1 and mutants. Scale bars represent 500 nm. H, cytotoxicity of 40 μM SOD1 and mutant aggregates measured by CCK-8 method. Cells were incubated with protein at 37 °C for 3 days. n = 3 biologically independent samples. Data are presented as mean values ± S.D. Data were analyzed by two-way ANOVA with multiple comparisons. ns, not significant. ALS, amyotrophic lateral sclerosis; FRAP, fluorescence recovery after photobleaching; SOD, superoxide dismutase; TEM, transmission electron microscope; ThT, thioflavin T.
Figure 5
Figure 5
A model for SOD1 functional LLPS. Pathological mutations and oxidative damage induce the transition of SOD1 from phase separation to aggregation. LLPS, liquid-liquid phase separation; SOD, superoxide dismutase.

References

    1. Bruijn L.I., Houseweart M.K., Kato S., Anderson K.L., Anderson S.D., Ohama E., et al. Aggregation and motor neuron toxicity of an ALS-linked SOD1 mutant independent from wild-type SOD1. Science. 1998;281:1851–1854. - PubMed
    1. Bruijn L.I., Becher M.W., Lee M.K., Anderson K.L., Jenkins N.A., Copeland N.G., et al. ALS-linked SOD1 mutant G85R mediates damage to astrocytes and promotes rapidly progressive disease with SOD1-containing inclusions. Neuron. 1997;18:327–338. - PubMed
    1. Beers D.R., Henkel J.S., Xiao Q., Zhao W., Wang J., Yen A.A., et al. Wild-type microglia extend survival in PU.1 knockout mice with familial amyotrophic lateral sclerosis. Proc. Natl. Acad. Sci. U. S. A. 2006;103:16021–16026. - PMC - PubMed
    1. Cleveland D.W., Rothstein J.D. From charcot to lou gehrig: deciphering selective motor neuron death in als. Nat. Rev. Neurosci. 2001;2:806–819. - PubMed
    1. Ilieva H., Polymenidou M., Cleveland D.W. Non-cell autonomous toxicity in neurodegenerative disorders: ALS and beyond. J. Cell Biol. 2009;187:761–772. - PMC - PubMed

Publication types

MeSH terms

Substances