. 2023 Oct;72(10):1942-1958.
doi: 10.1136/gutjnl-2022-327924. Epub 2023 Jan 2.

MicroRNA-223 attenuates hepatocarcinogenesis by blocking hypoxia-driven angiogenesis and immunosuppression

Affiliations

MicroRNA-223 attenuates hepatocarcinogenesis by blocking hypoxia-driven angiogenesis and immunosuppression

Yaojie Fu et al. Gut. 2023 Oct.

Abstract

Objective: The current treatment for hepatocellular carcinoma (HCC) to block angiogenesis and immunosuppression provides some benefits only for a subset of patients with HCC, thus optimised therapeutic regimens are unmet needs, which require a thorough understanding of the underlying mechanisms by which tumour cells orchestrate an inflamed tumour microenvironment with significant myeloid cell infiltration. MicroRNA-223 (miR-223) is highly expressed in myeloid cells but its role in regulating tumour microenvironment remains unknown.

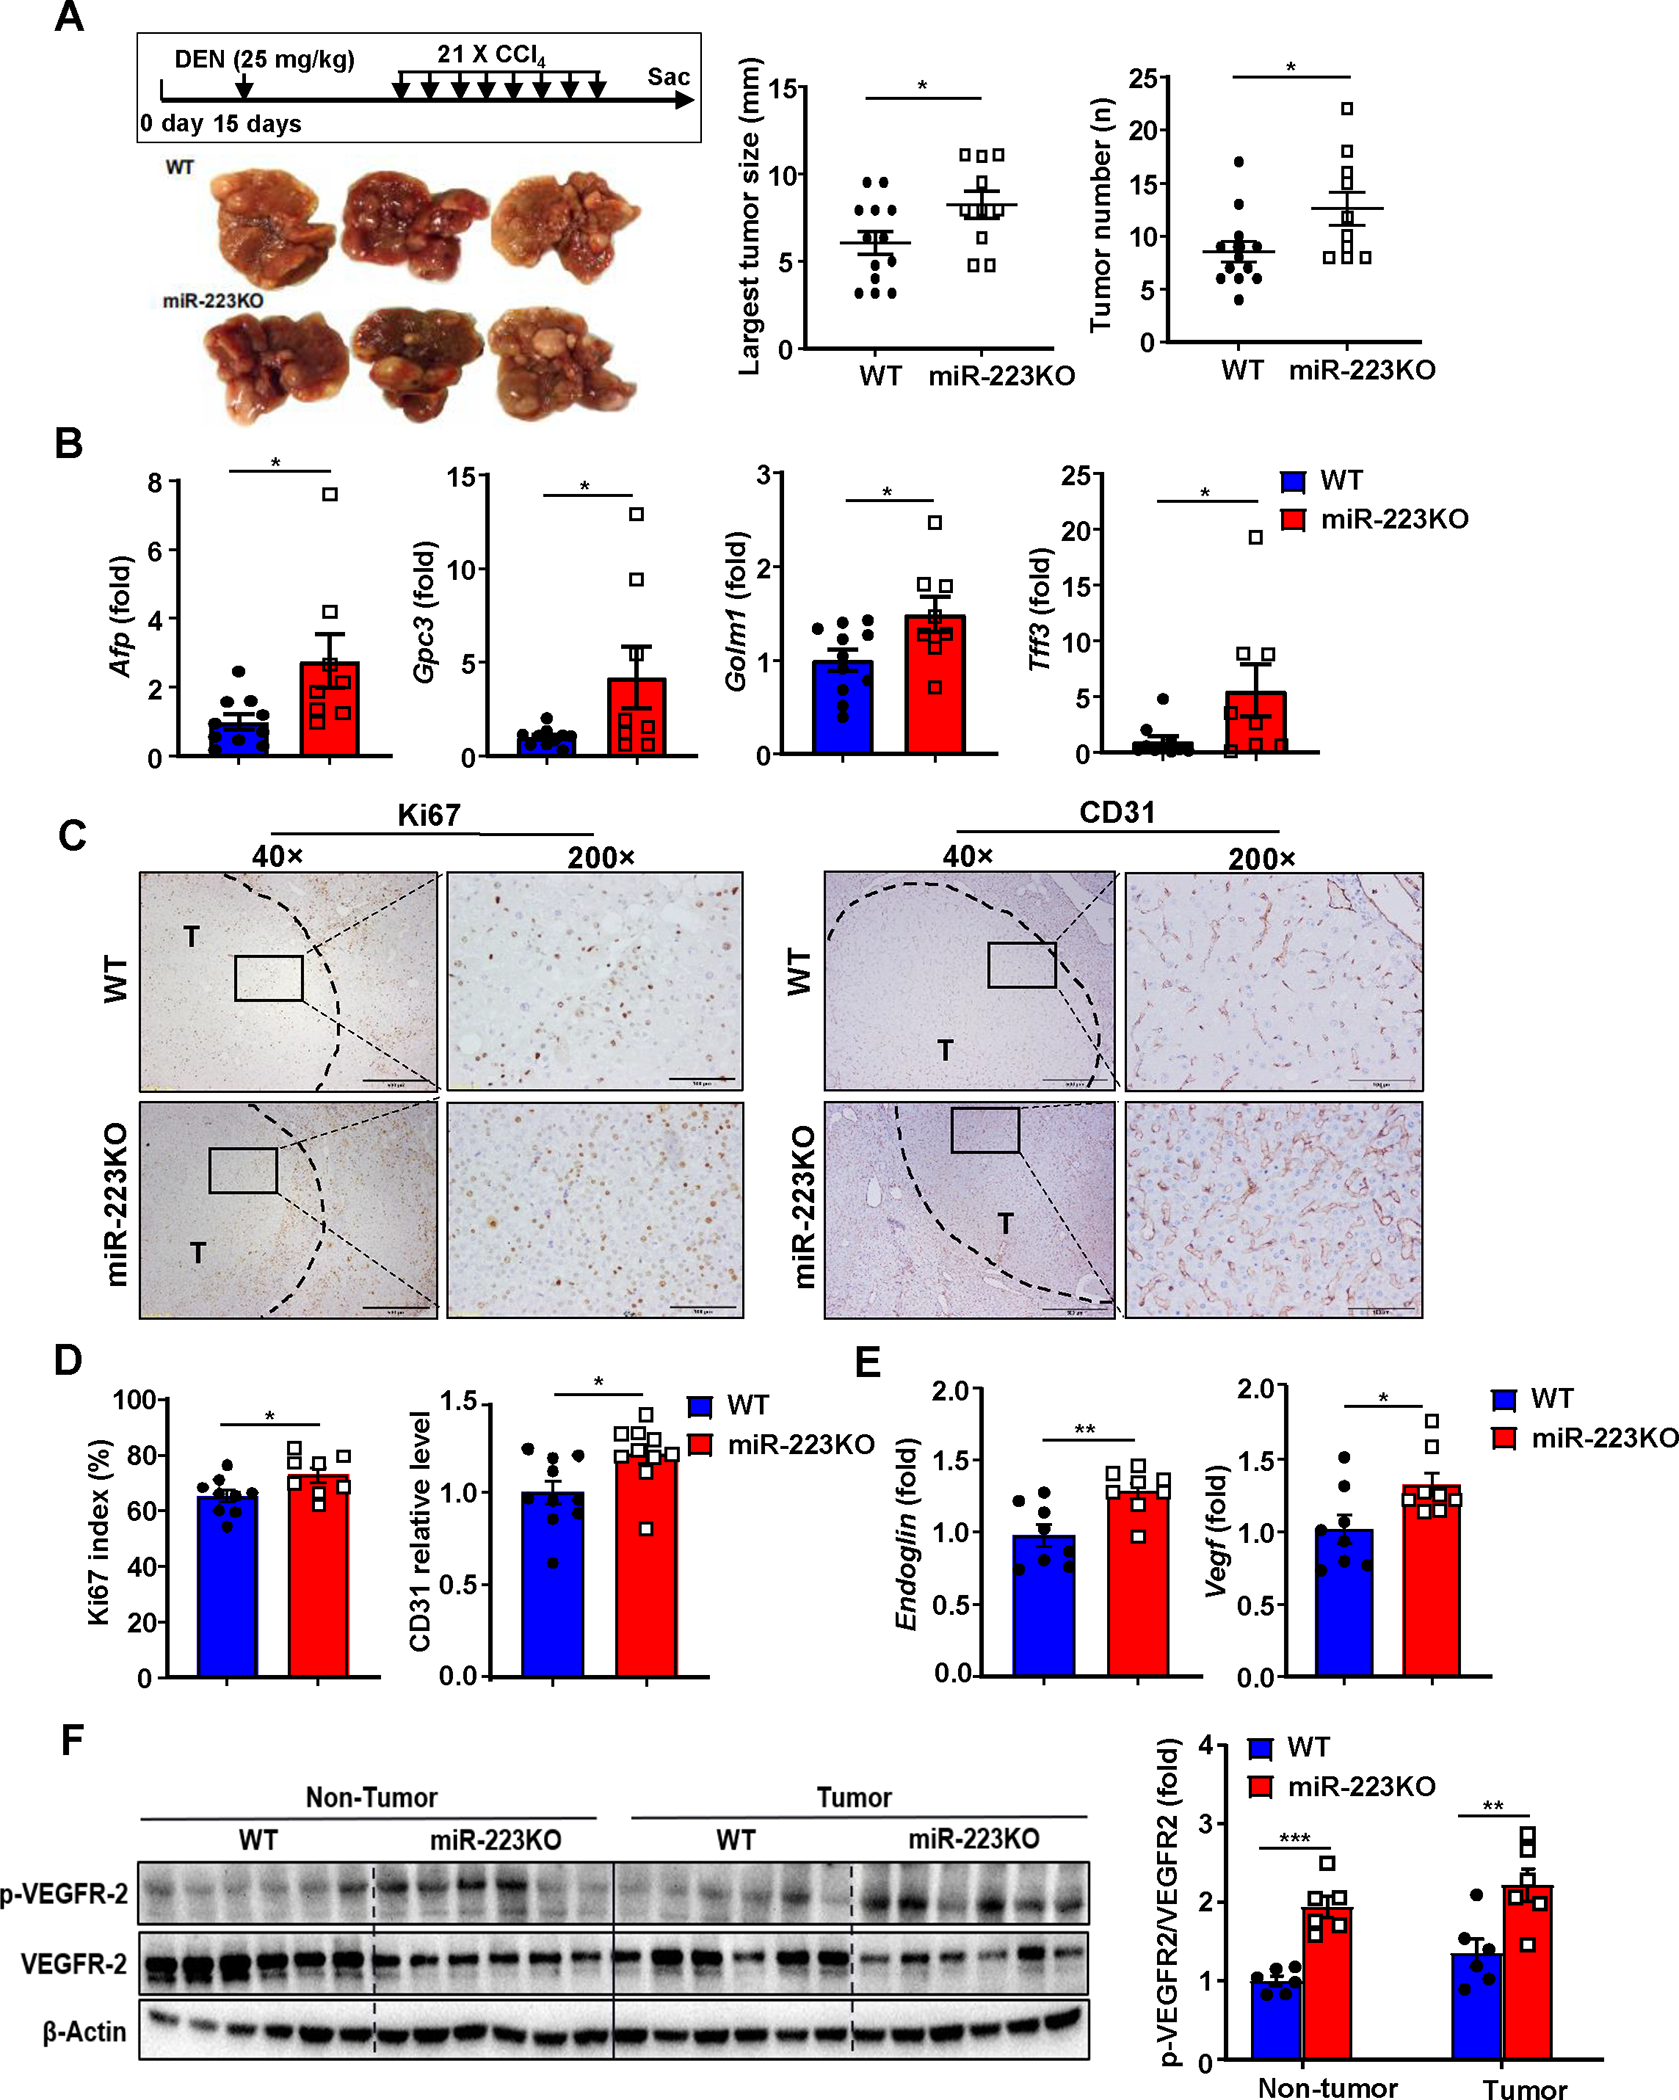
Design: Wild-type and miR-223 knockout mice were subjected to two mouse models of inflammation-associated HCC induced by injection of diethylnitrosamine (DEN) or orthotopic HCC cell implantation in chronic carbon tetrachloride (CCl4)-treated mice.

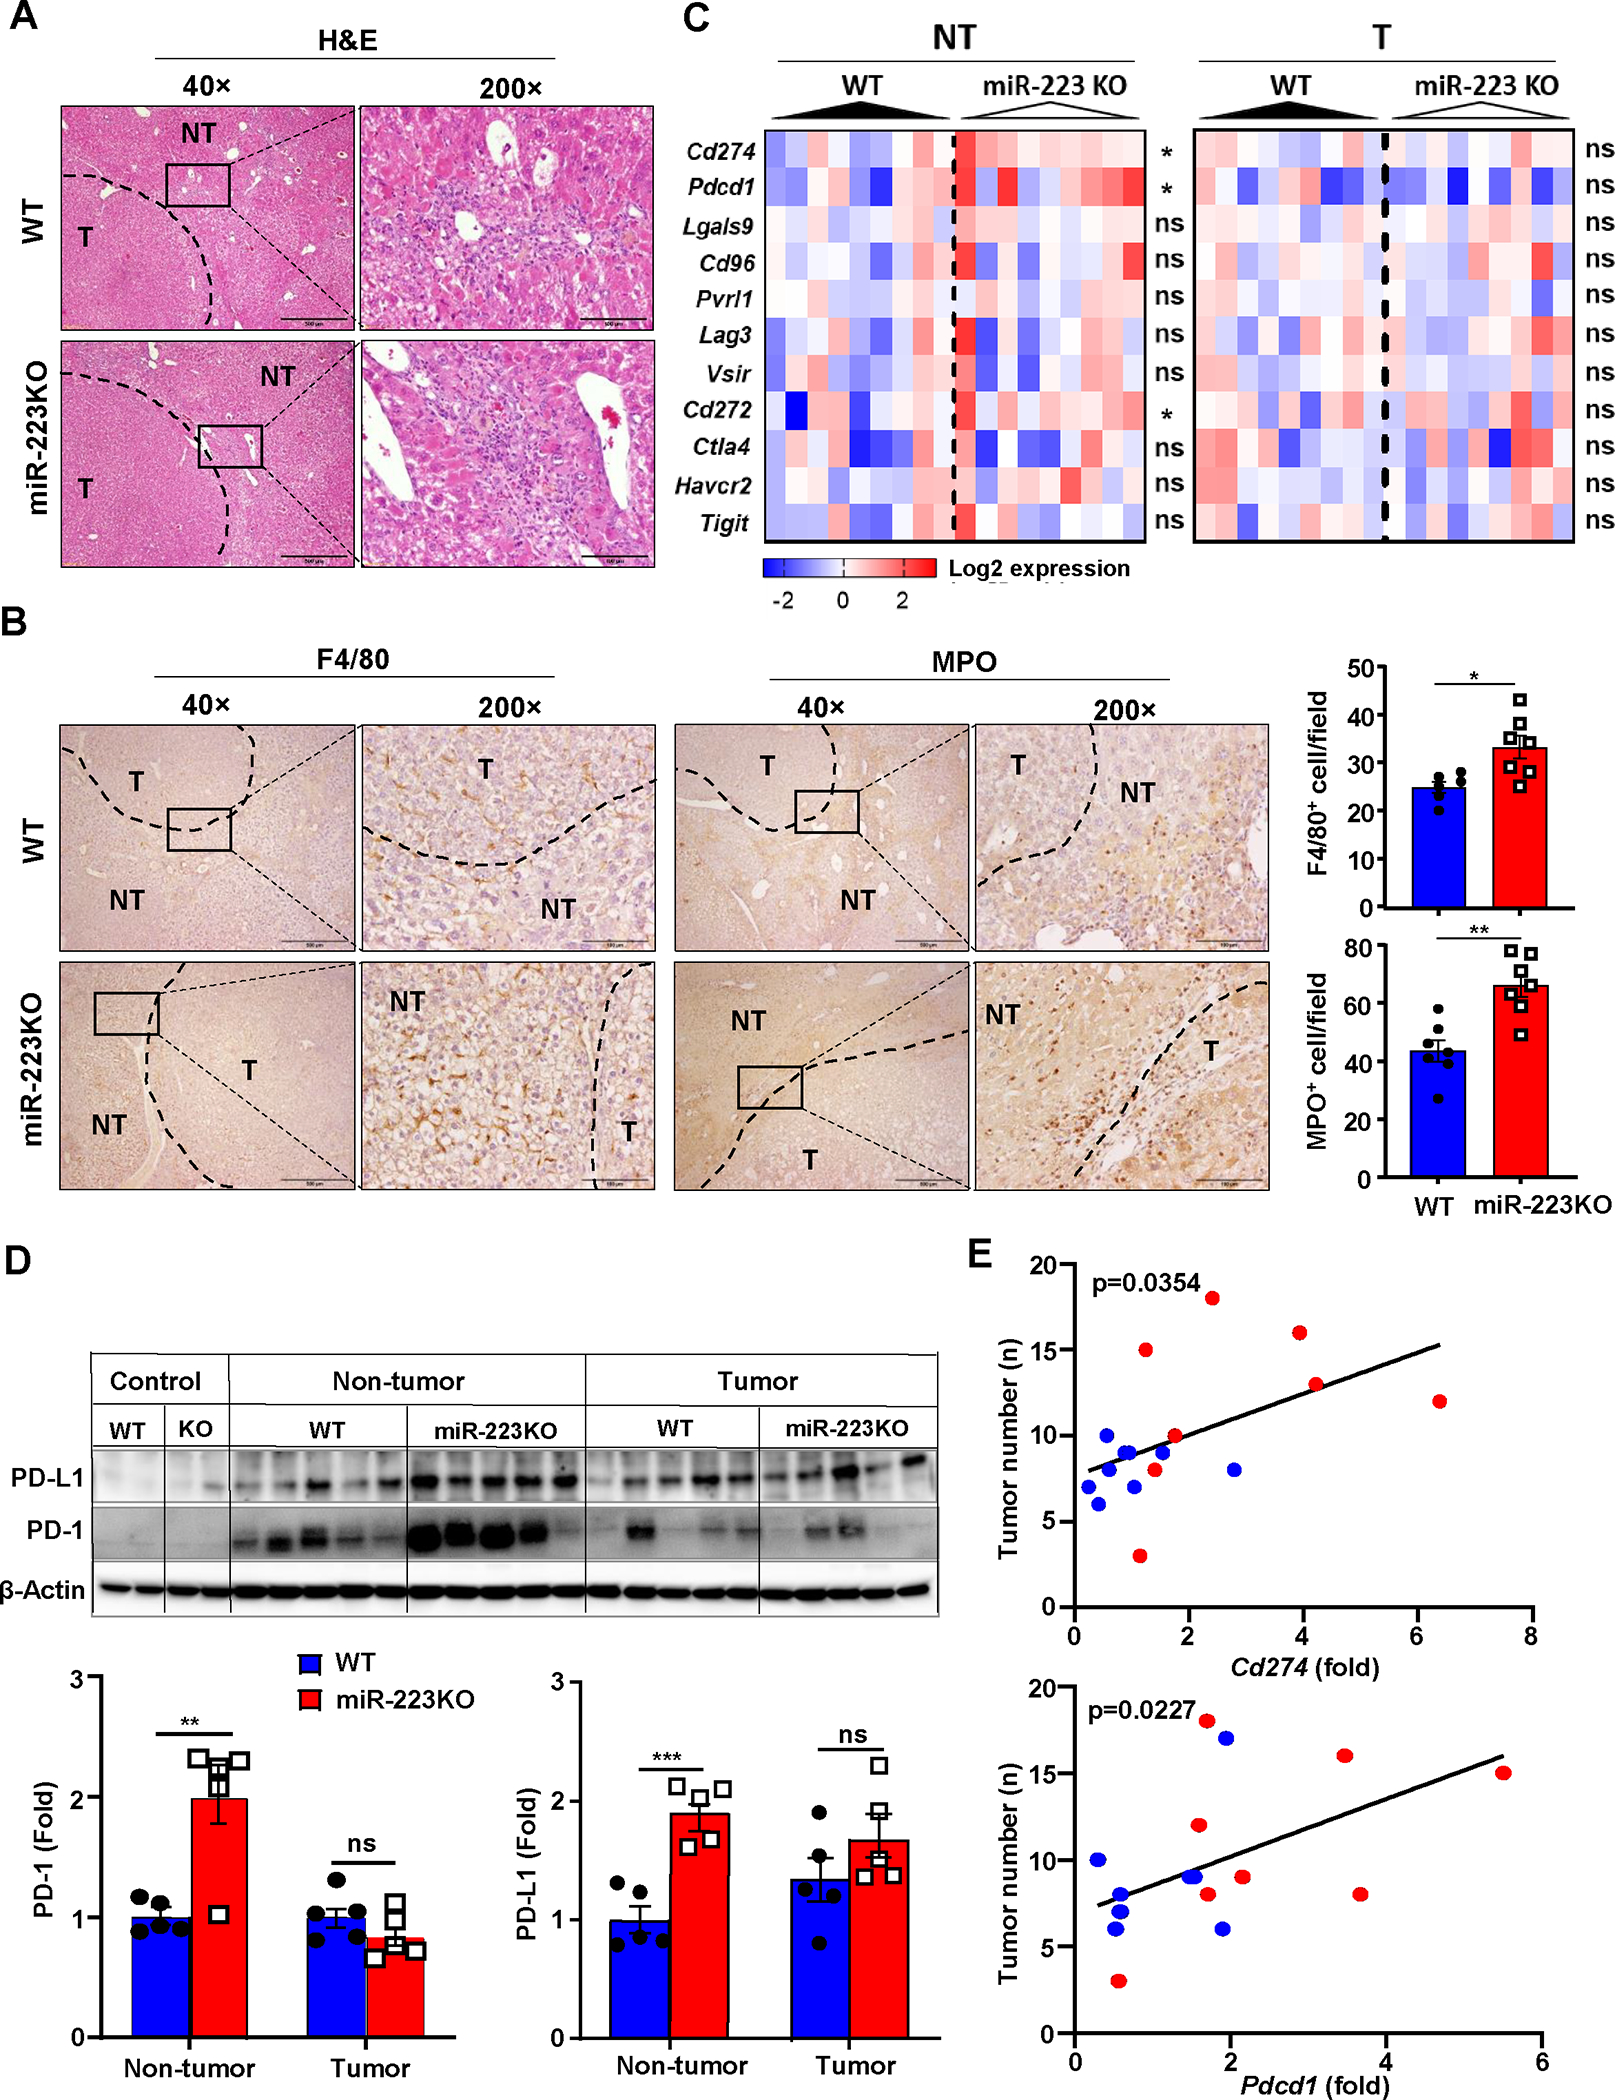
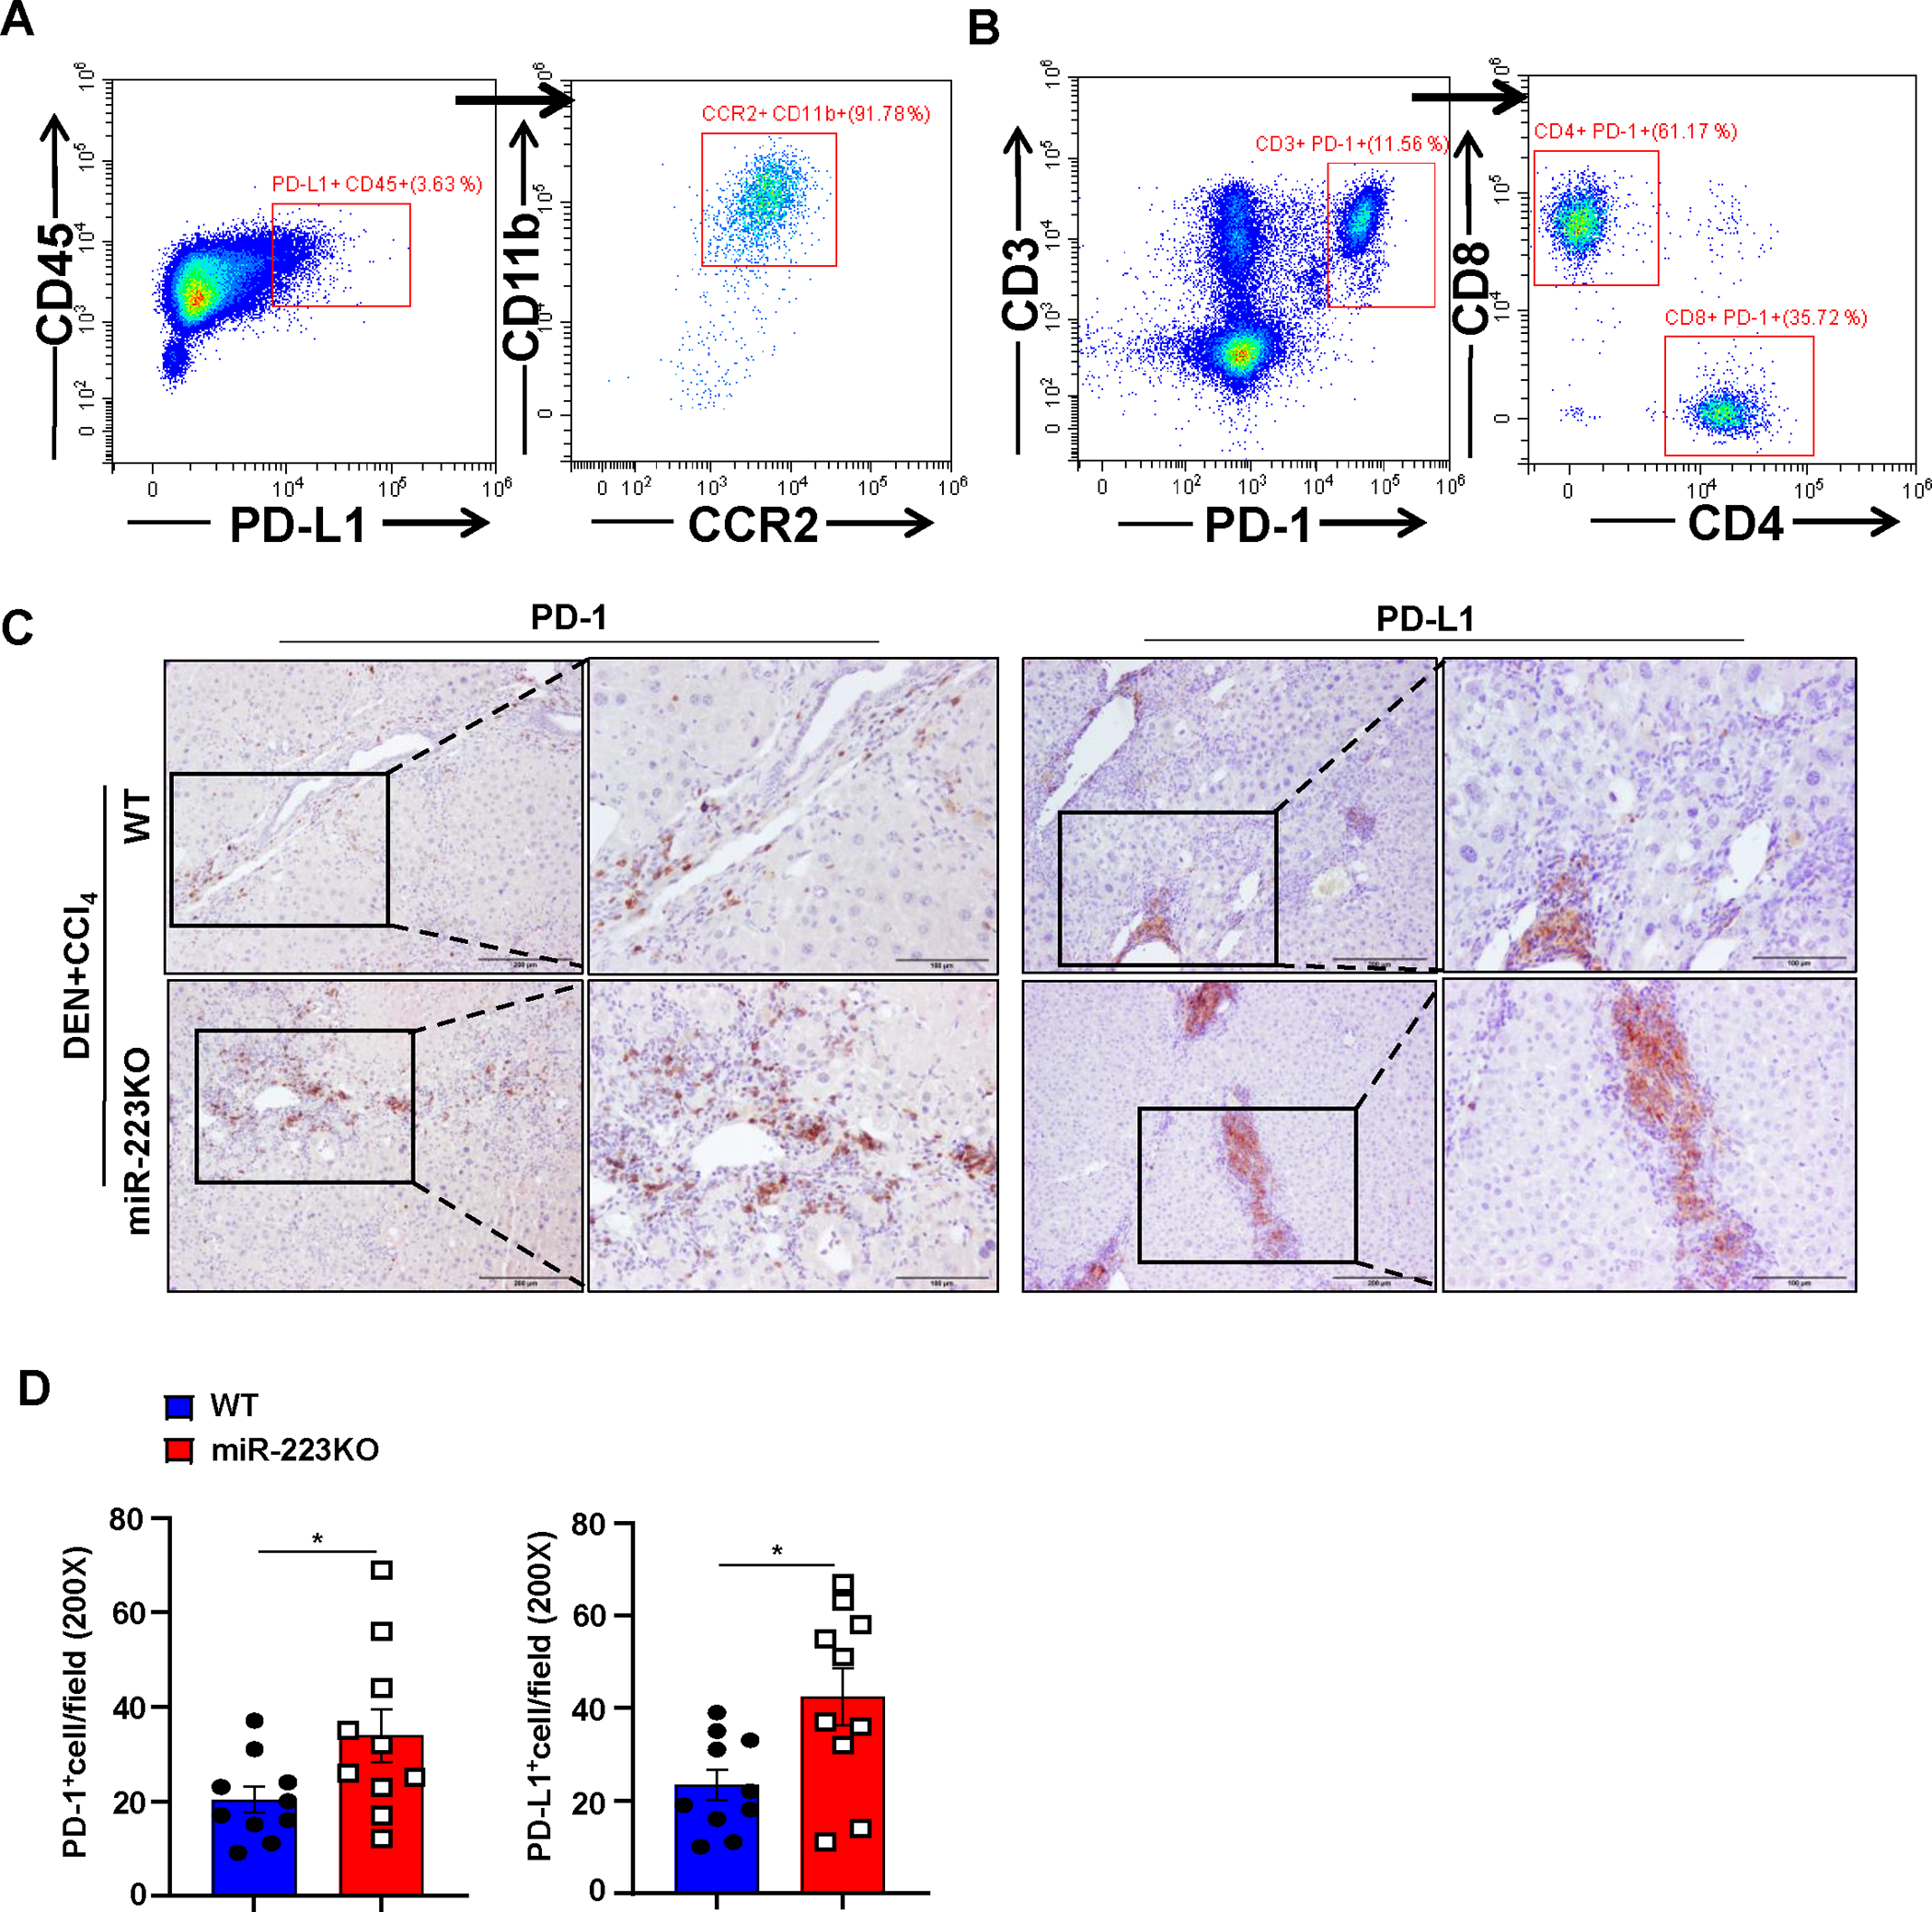
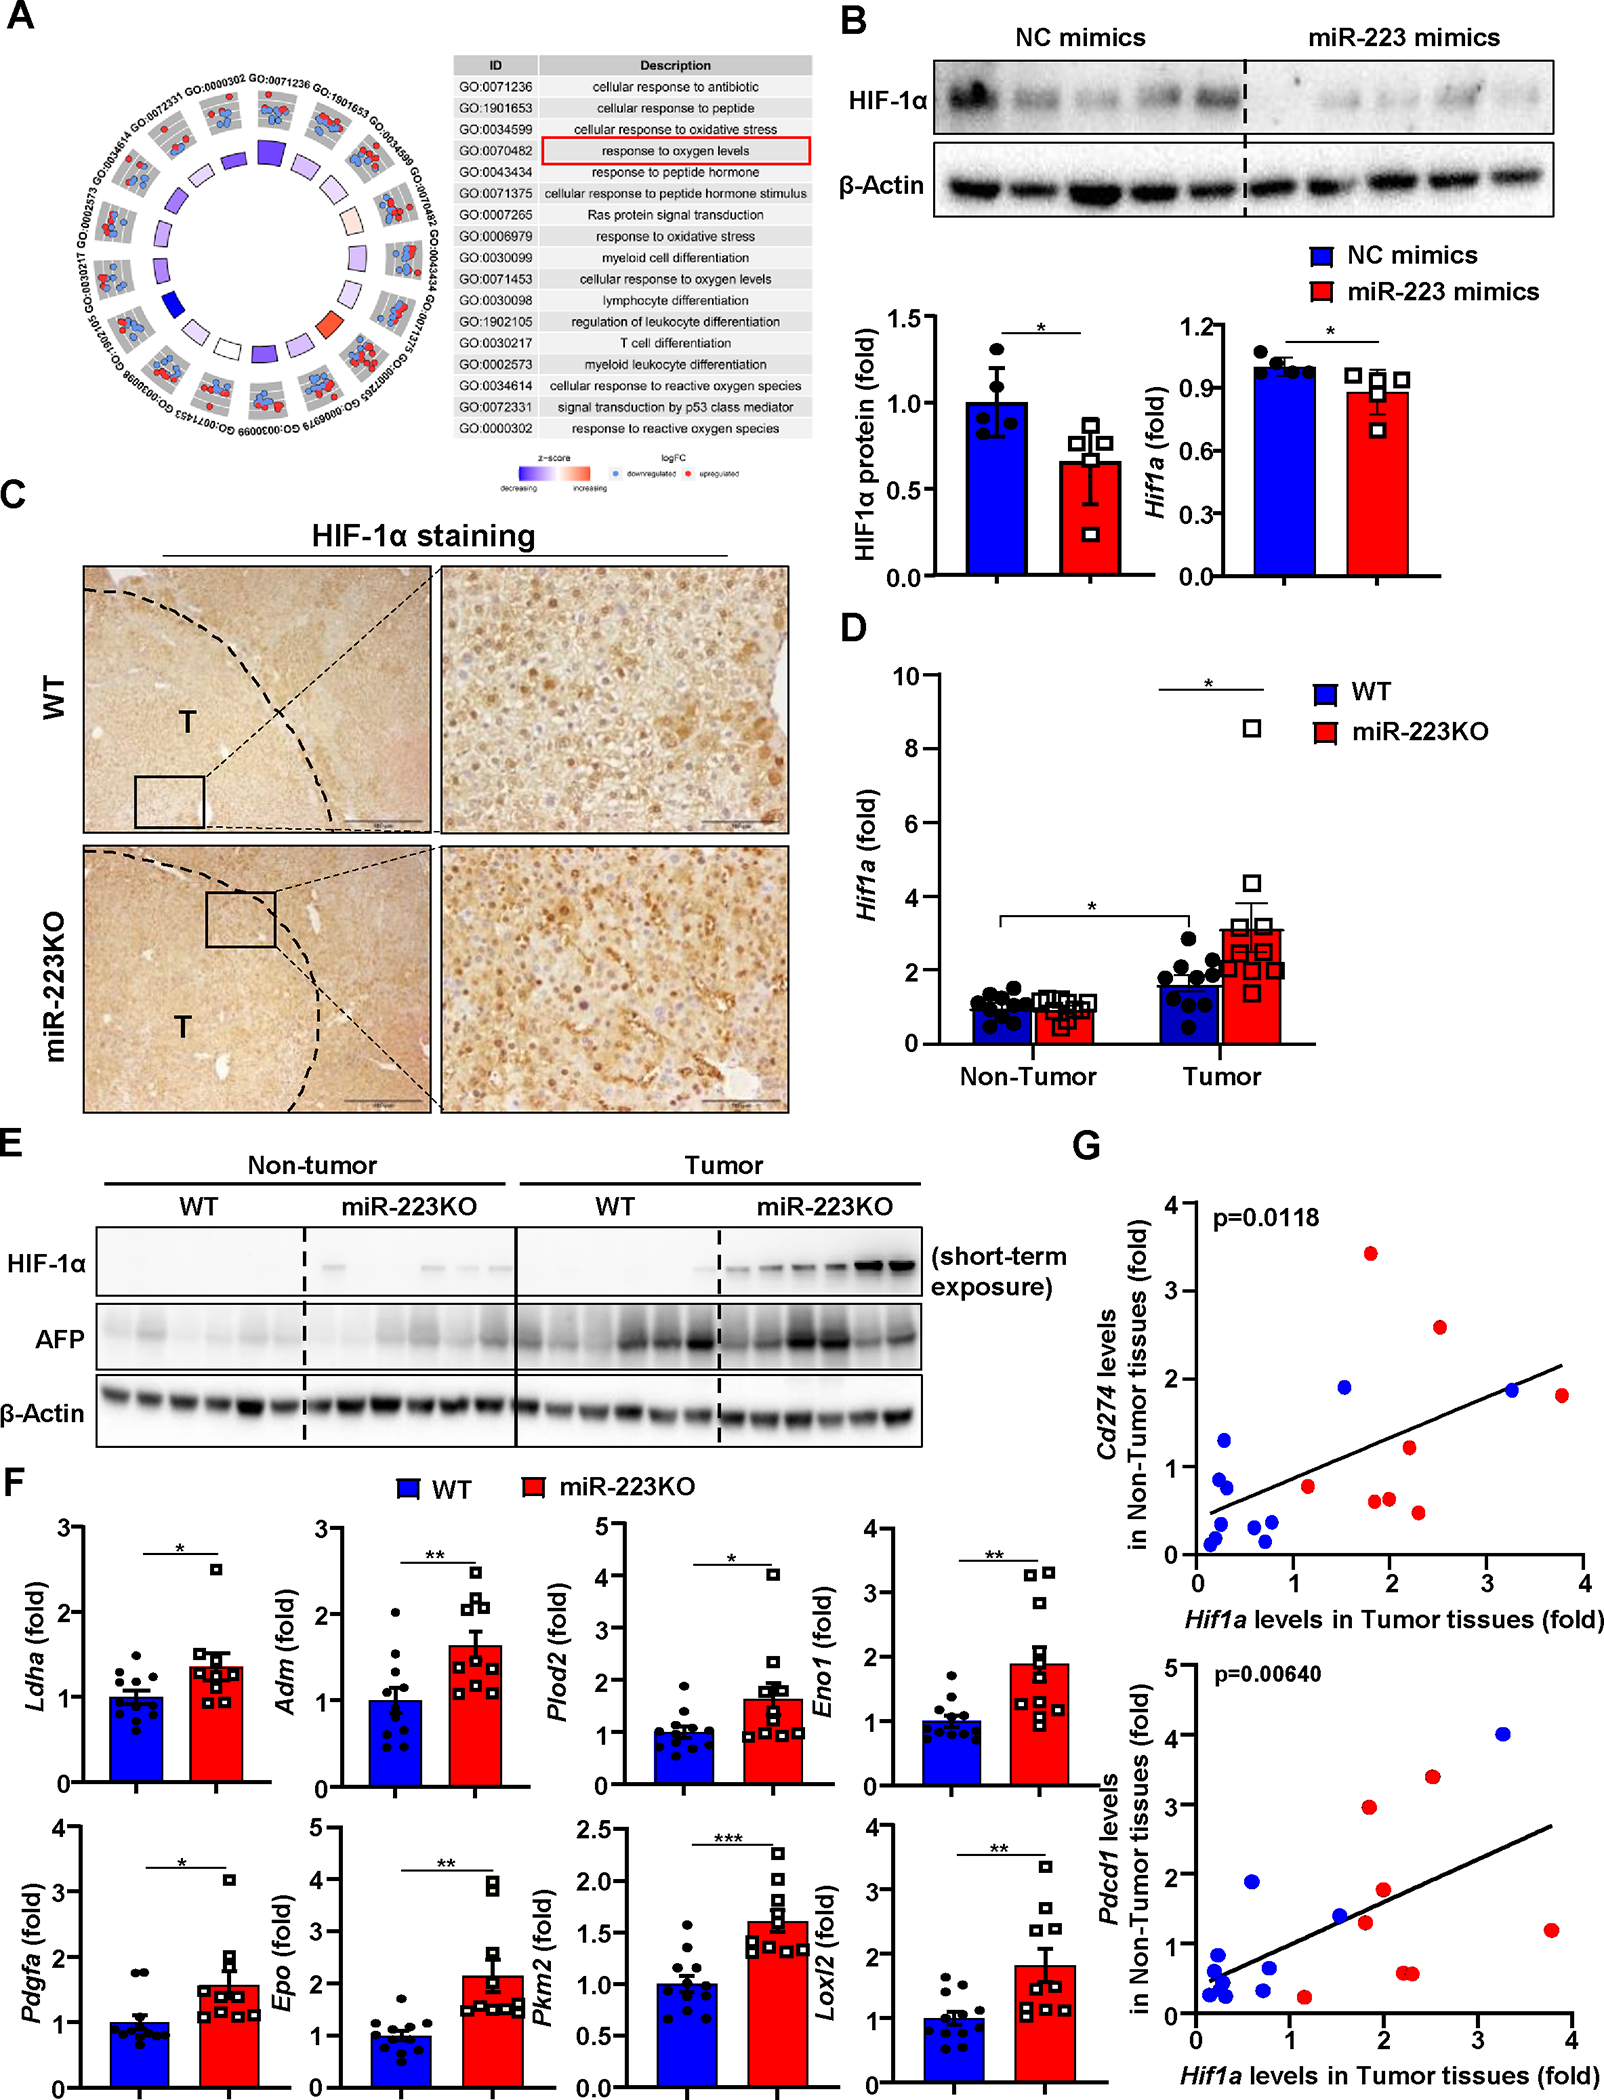
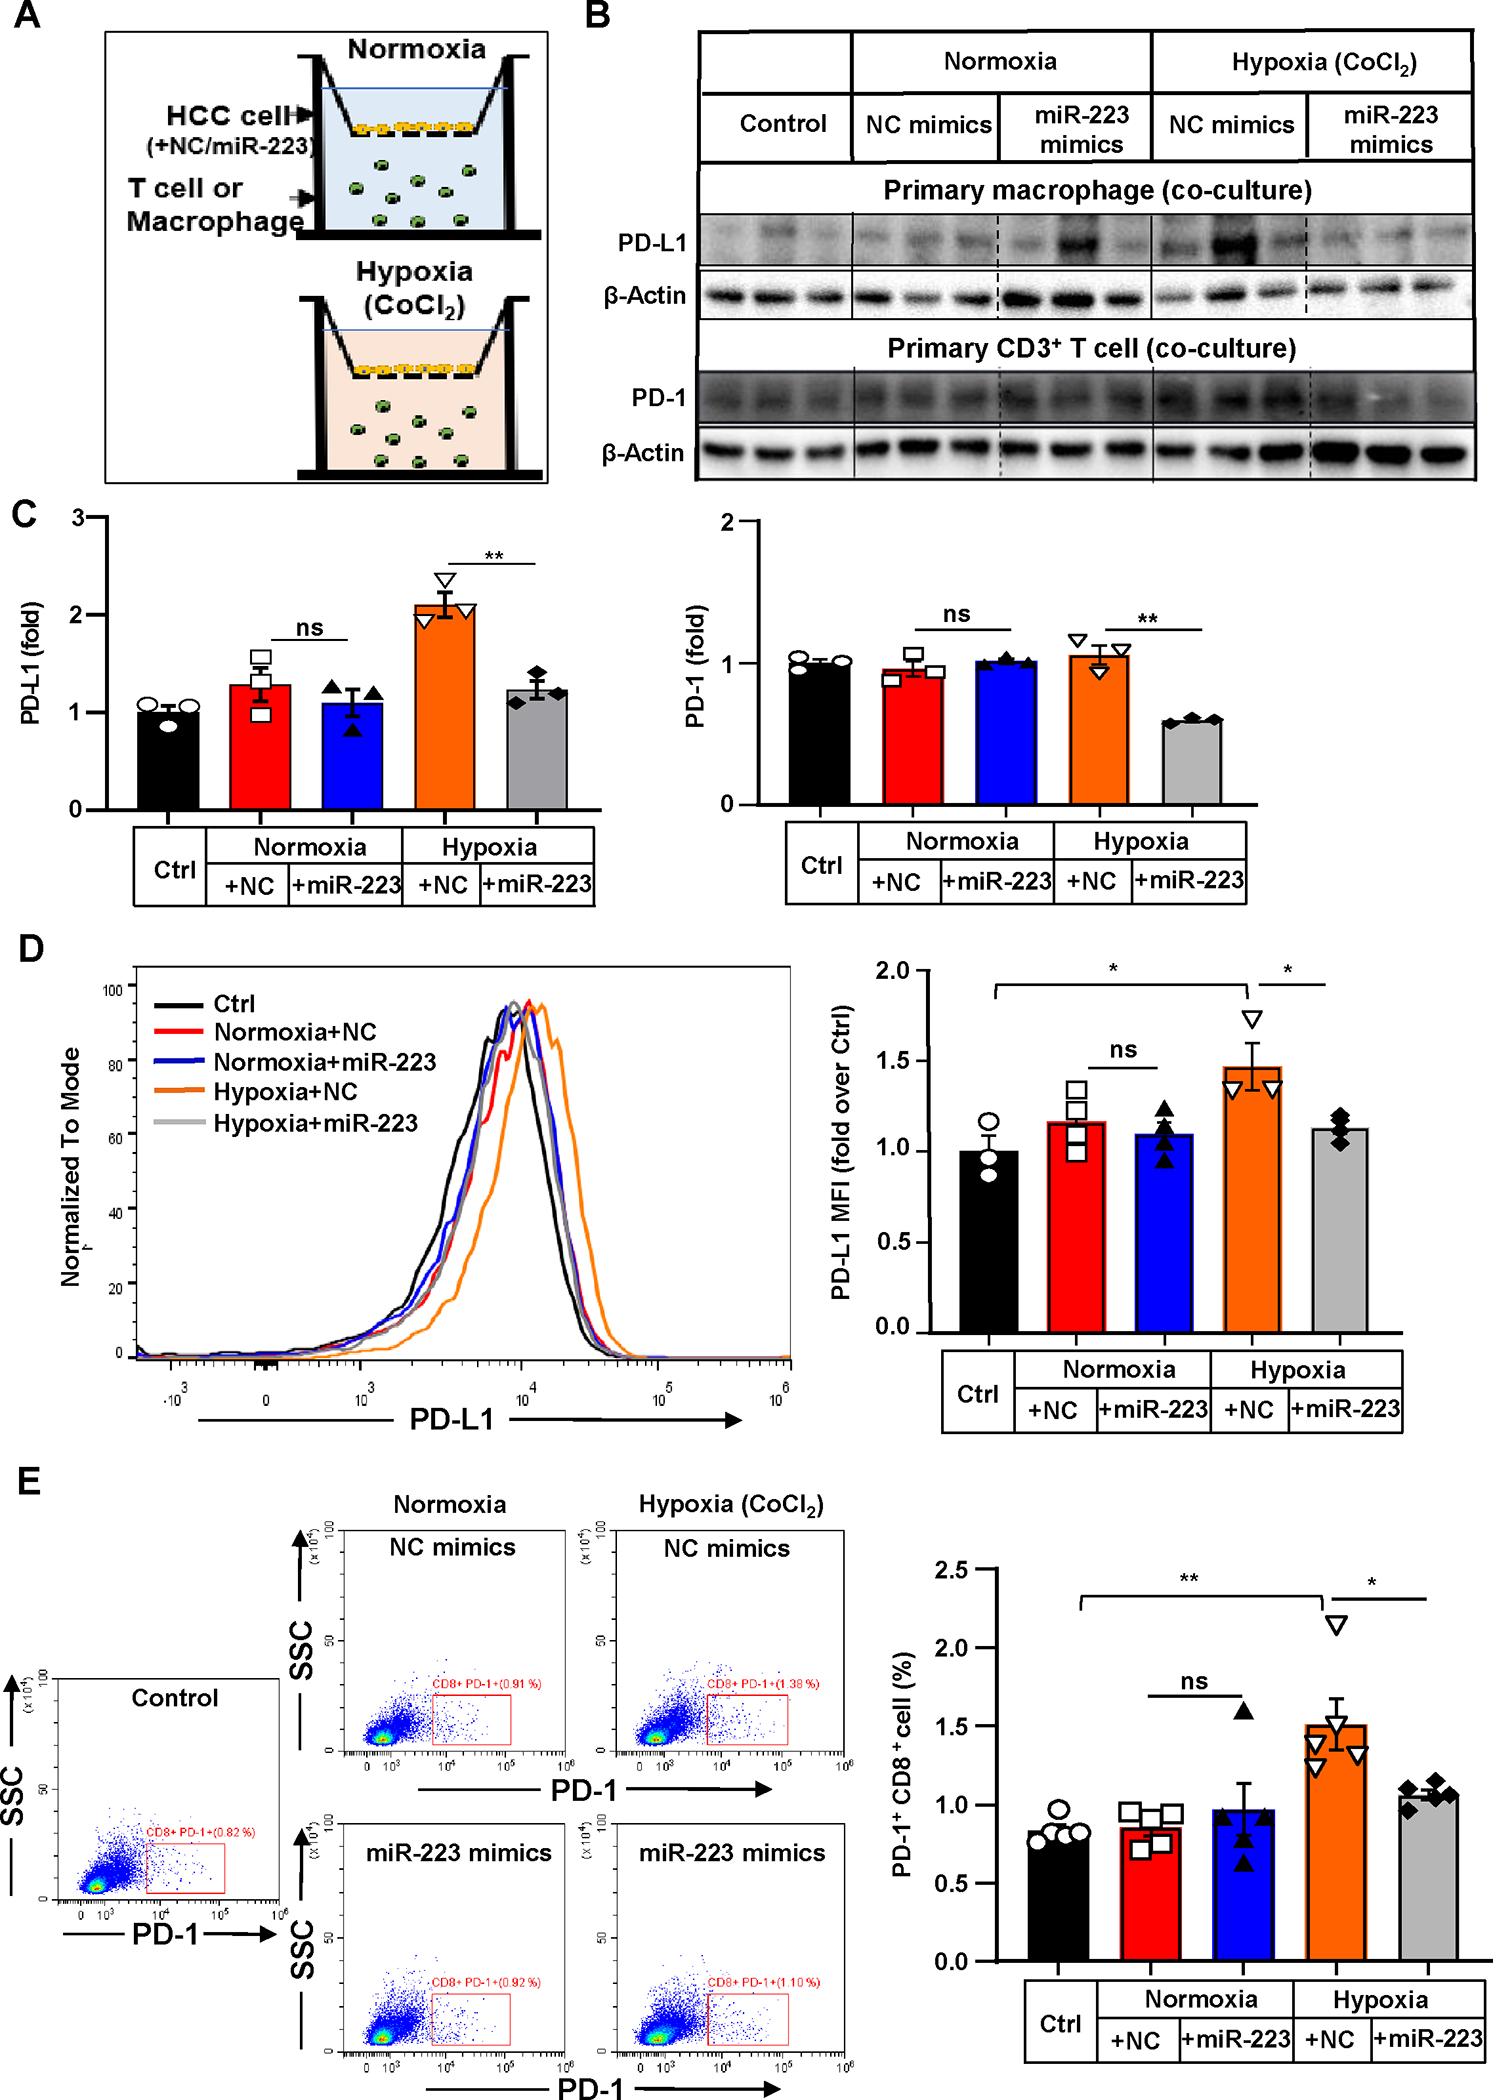
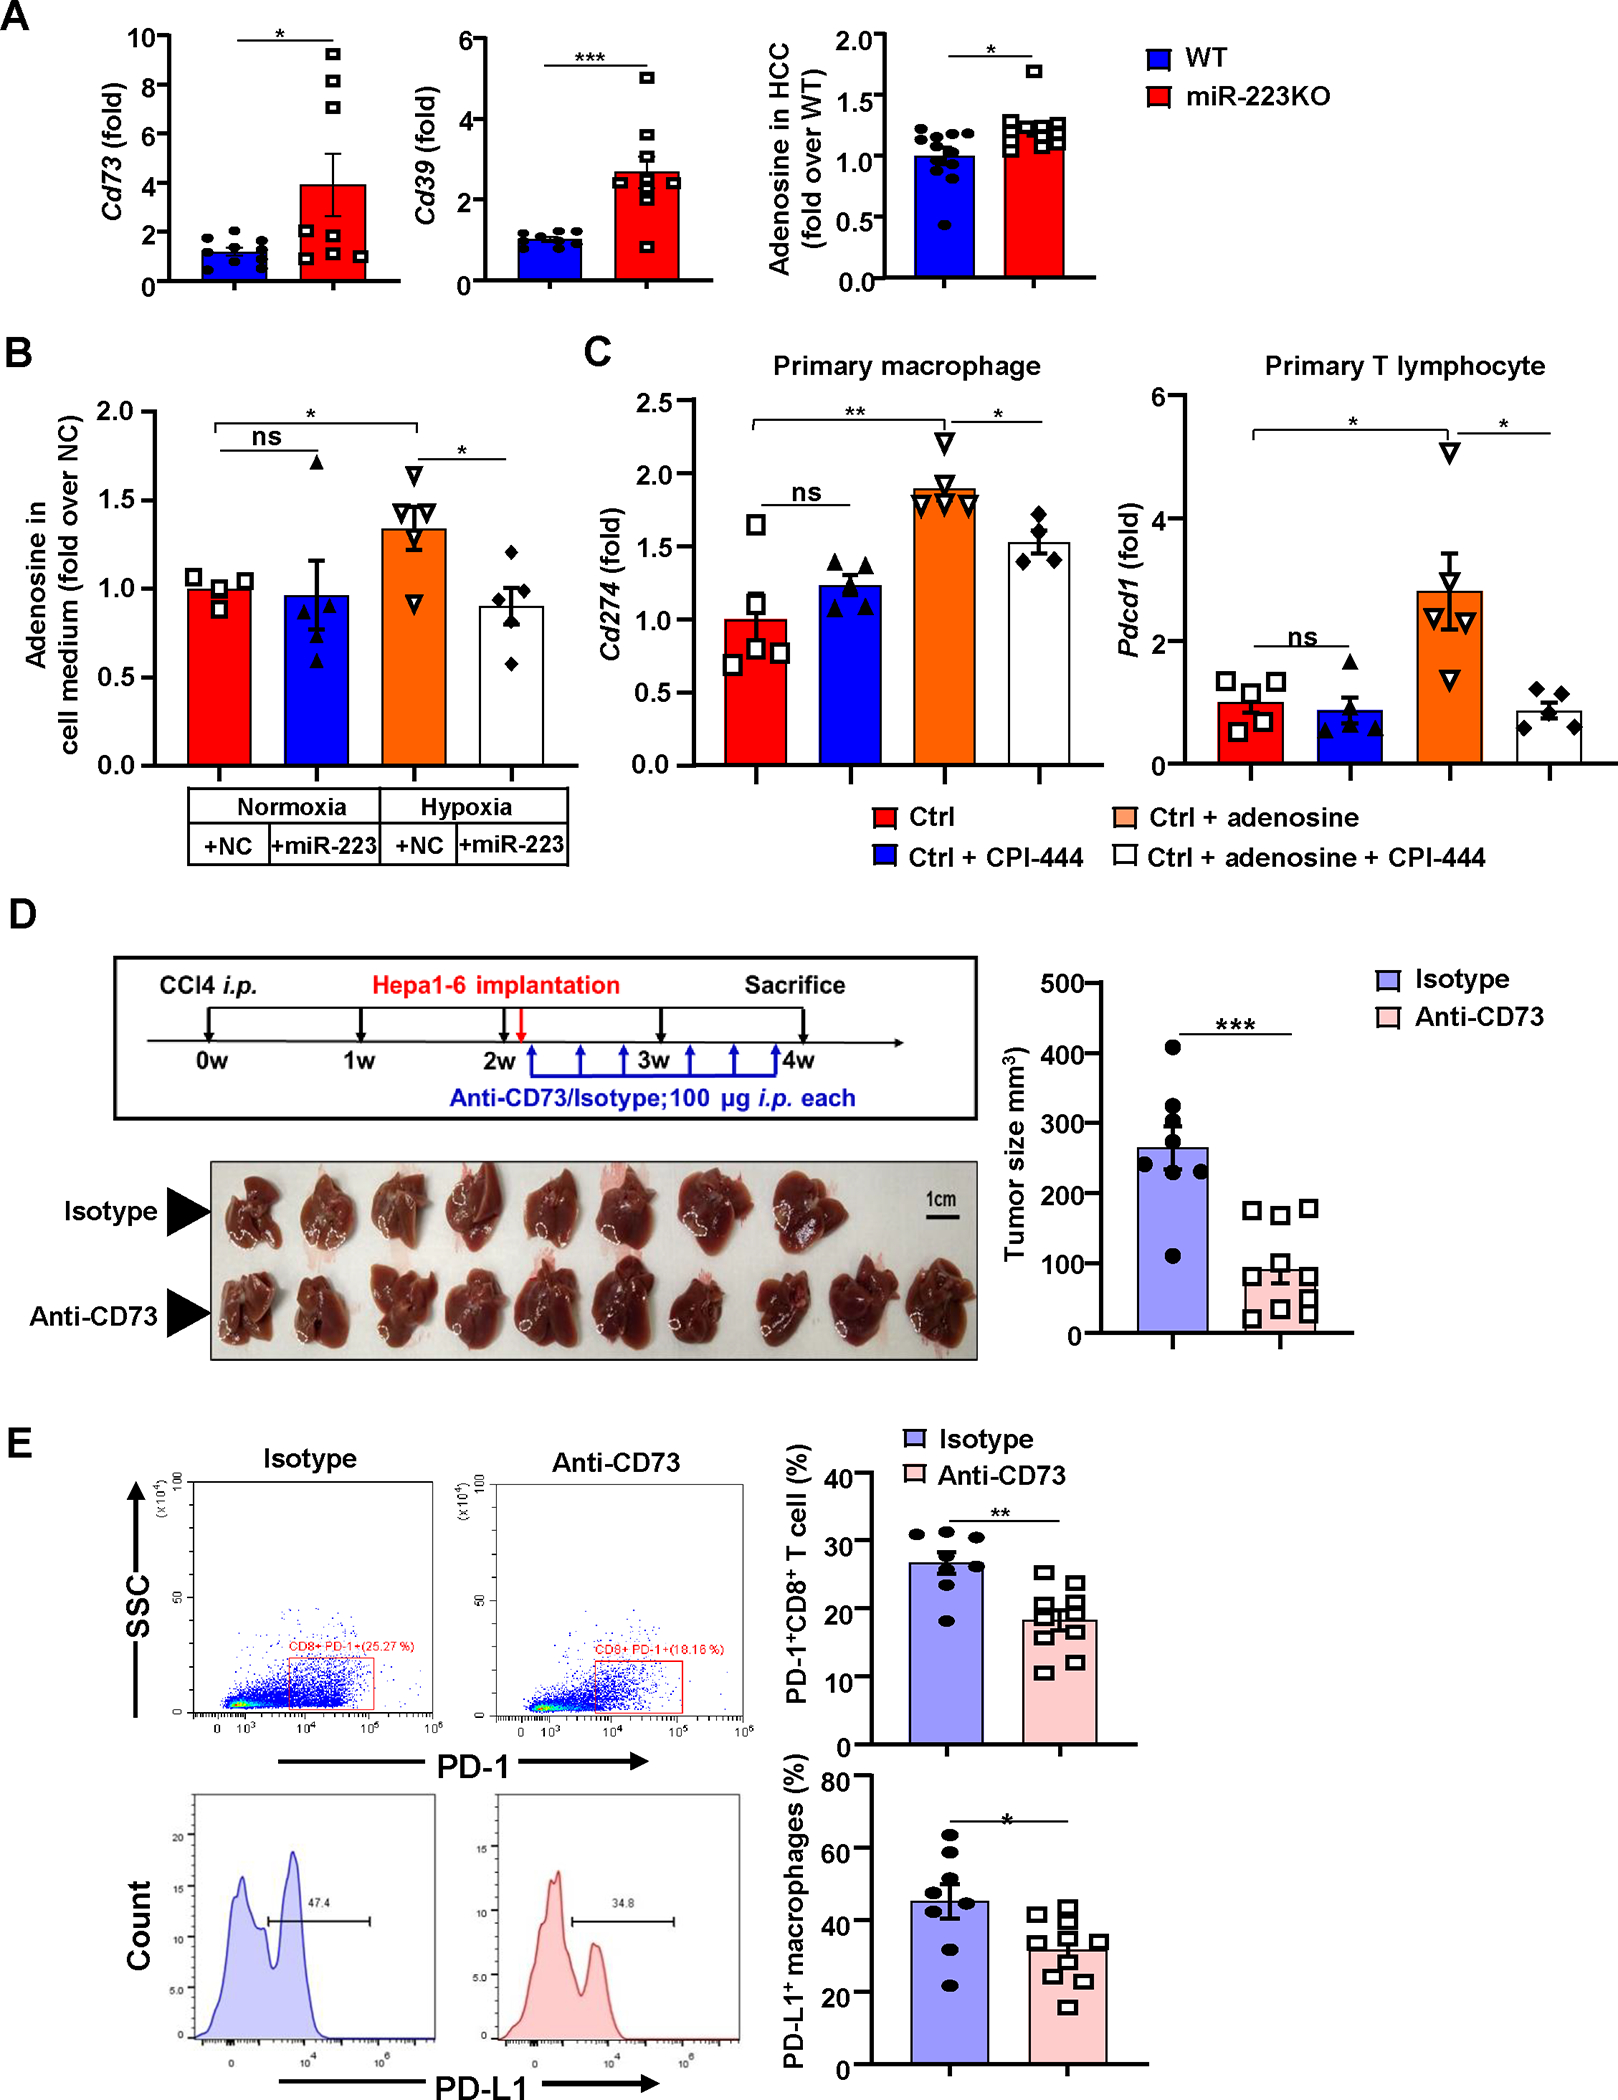
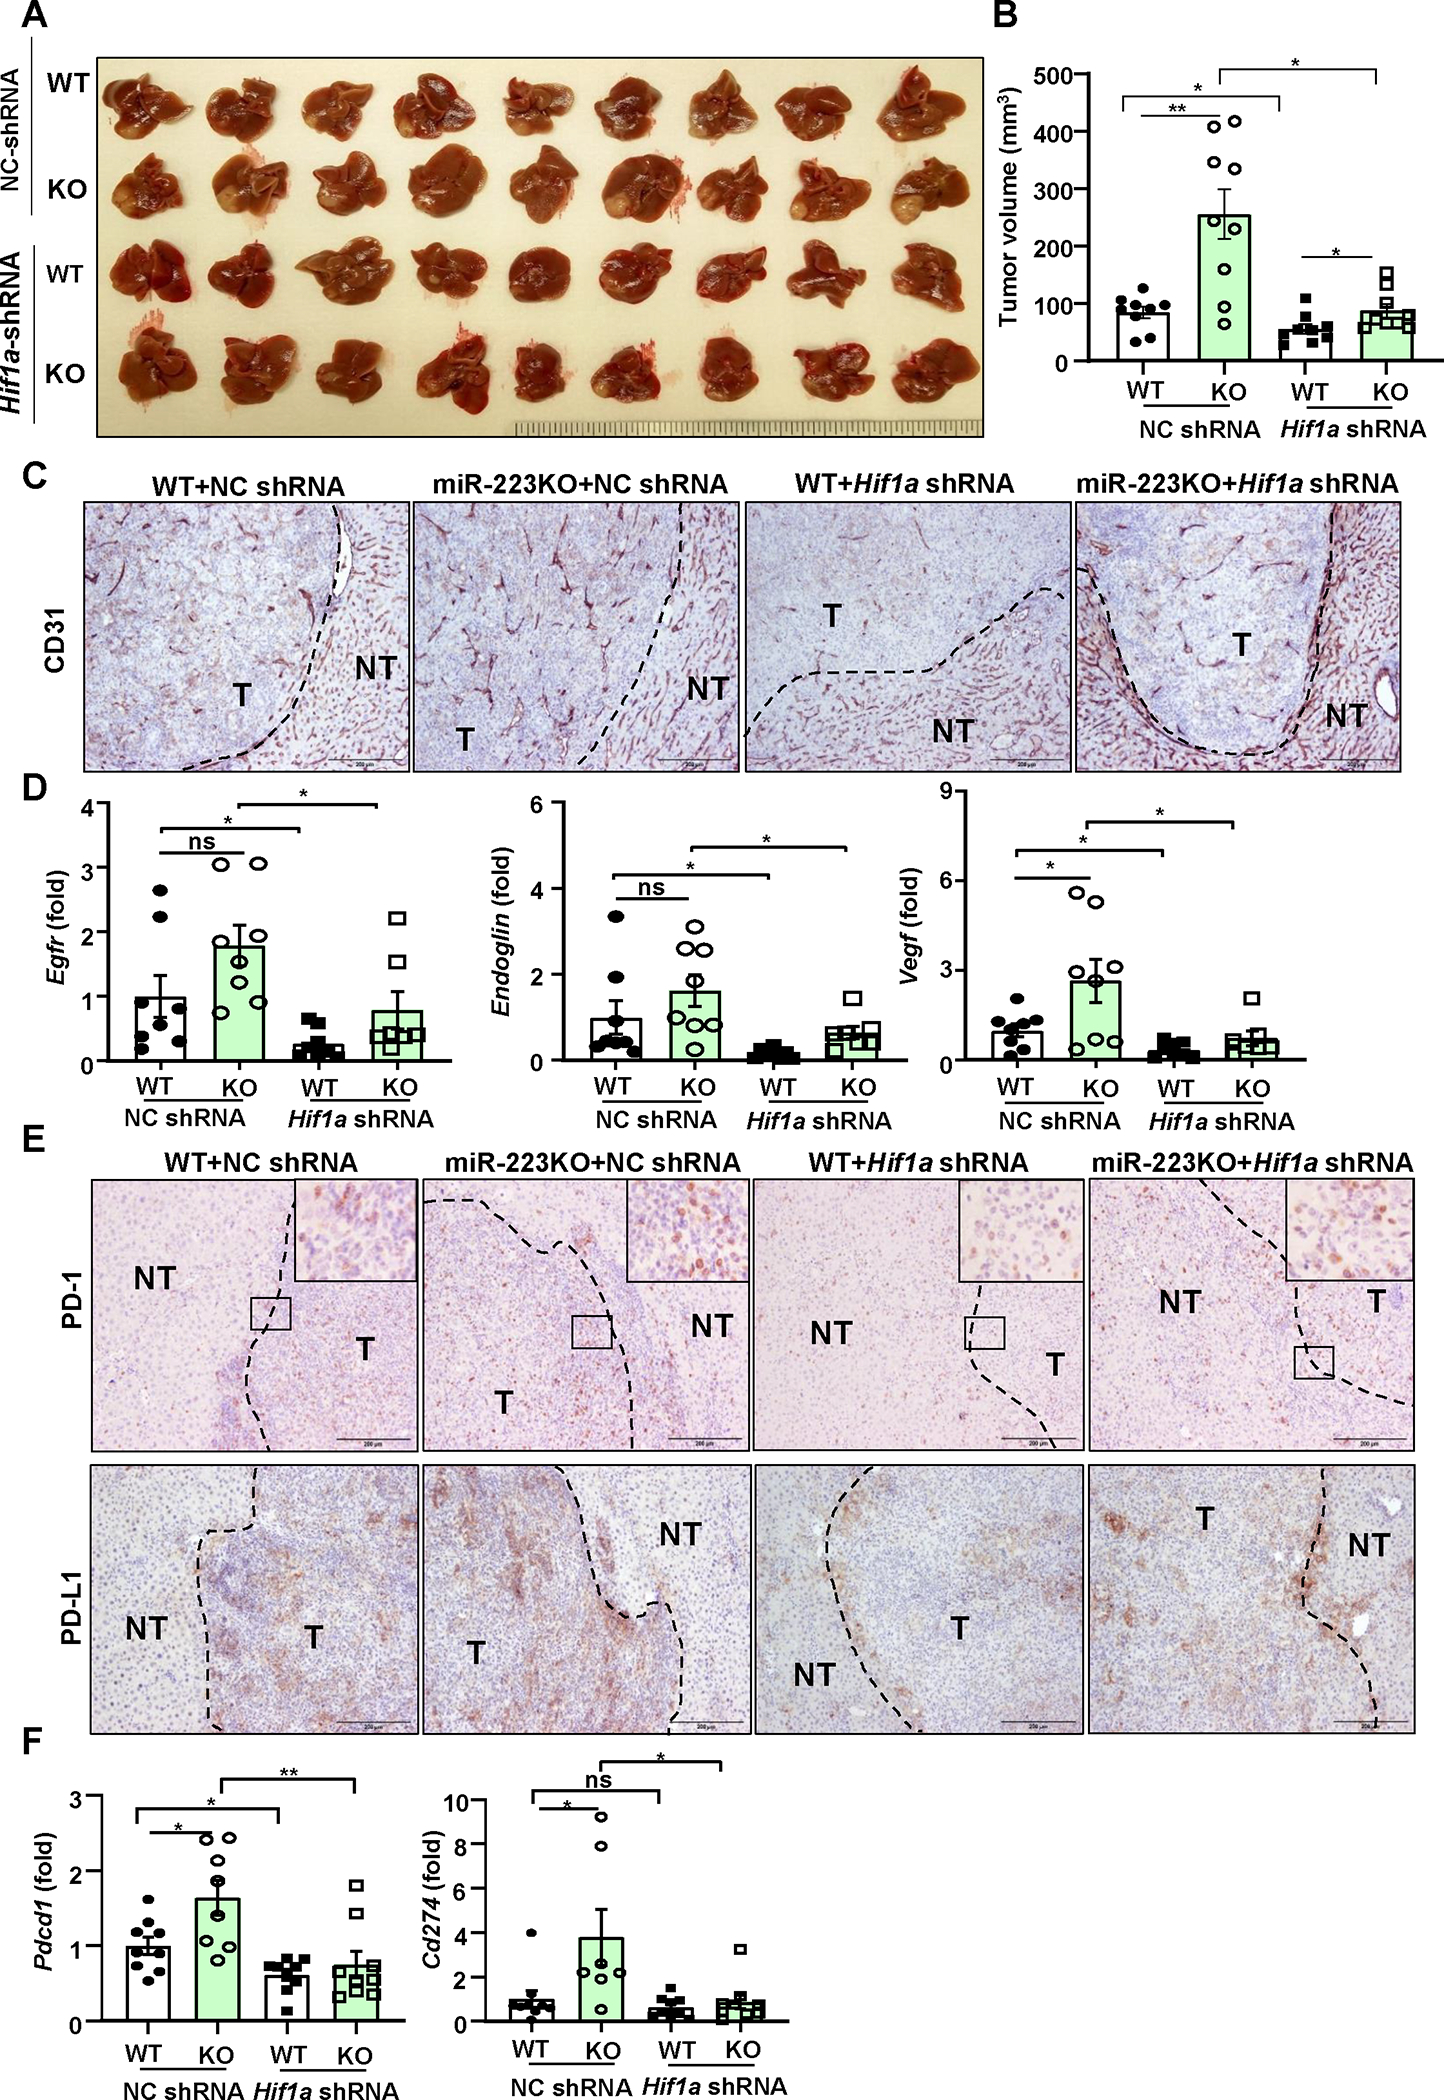
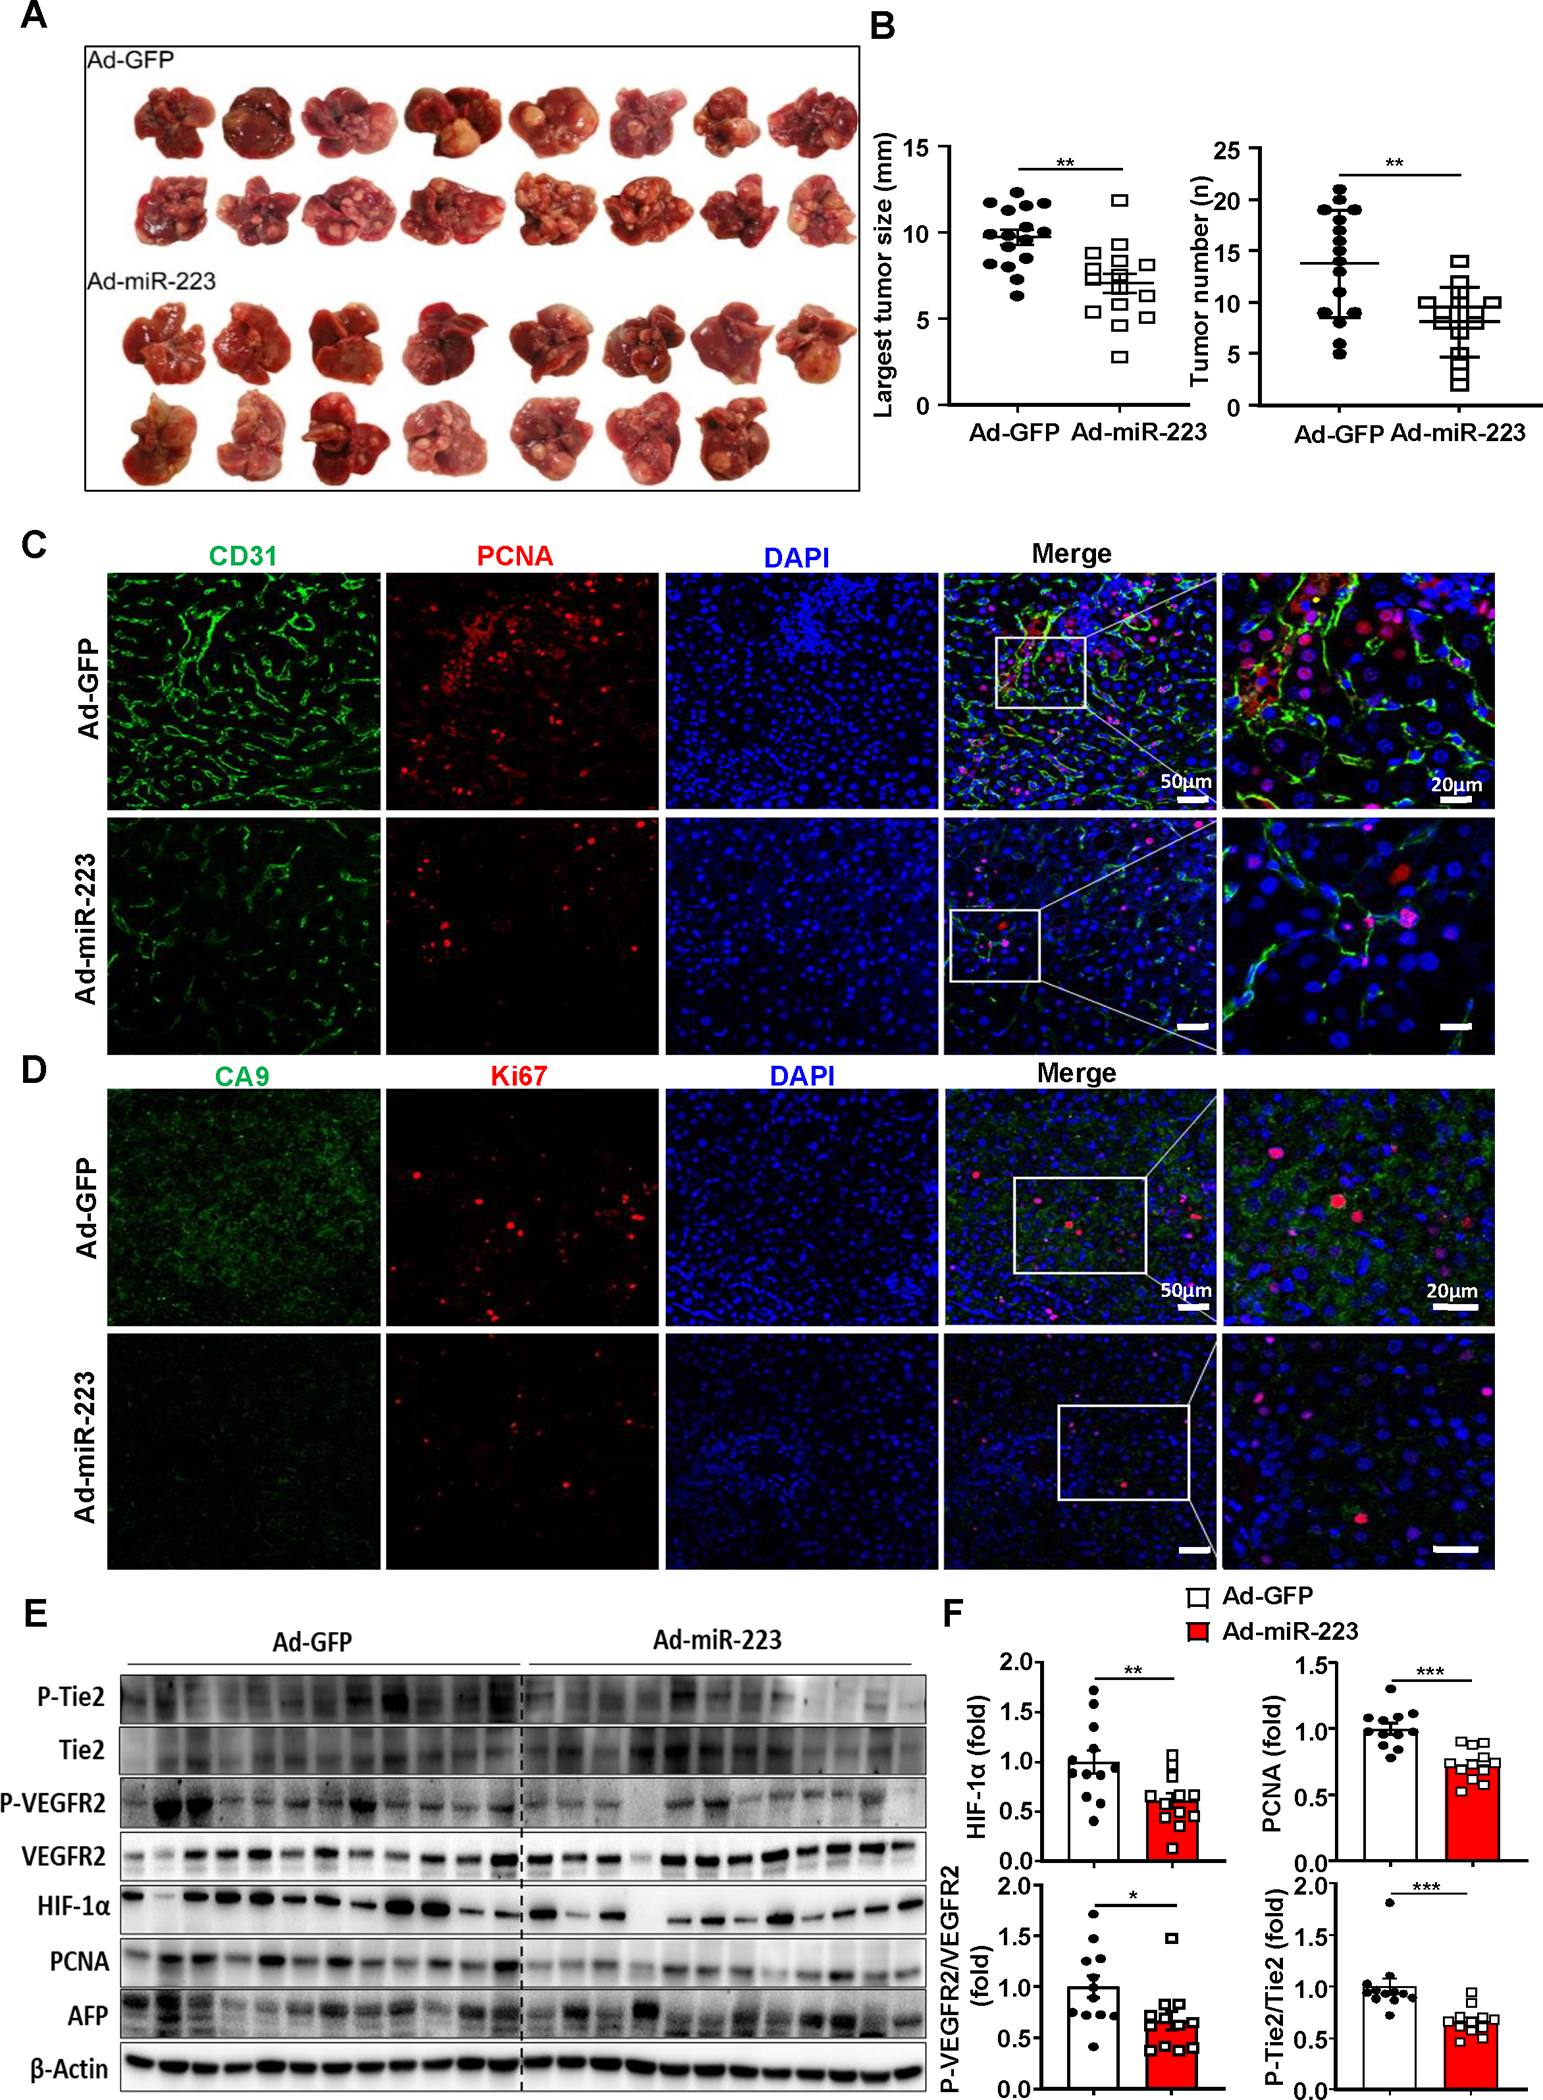
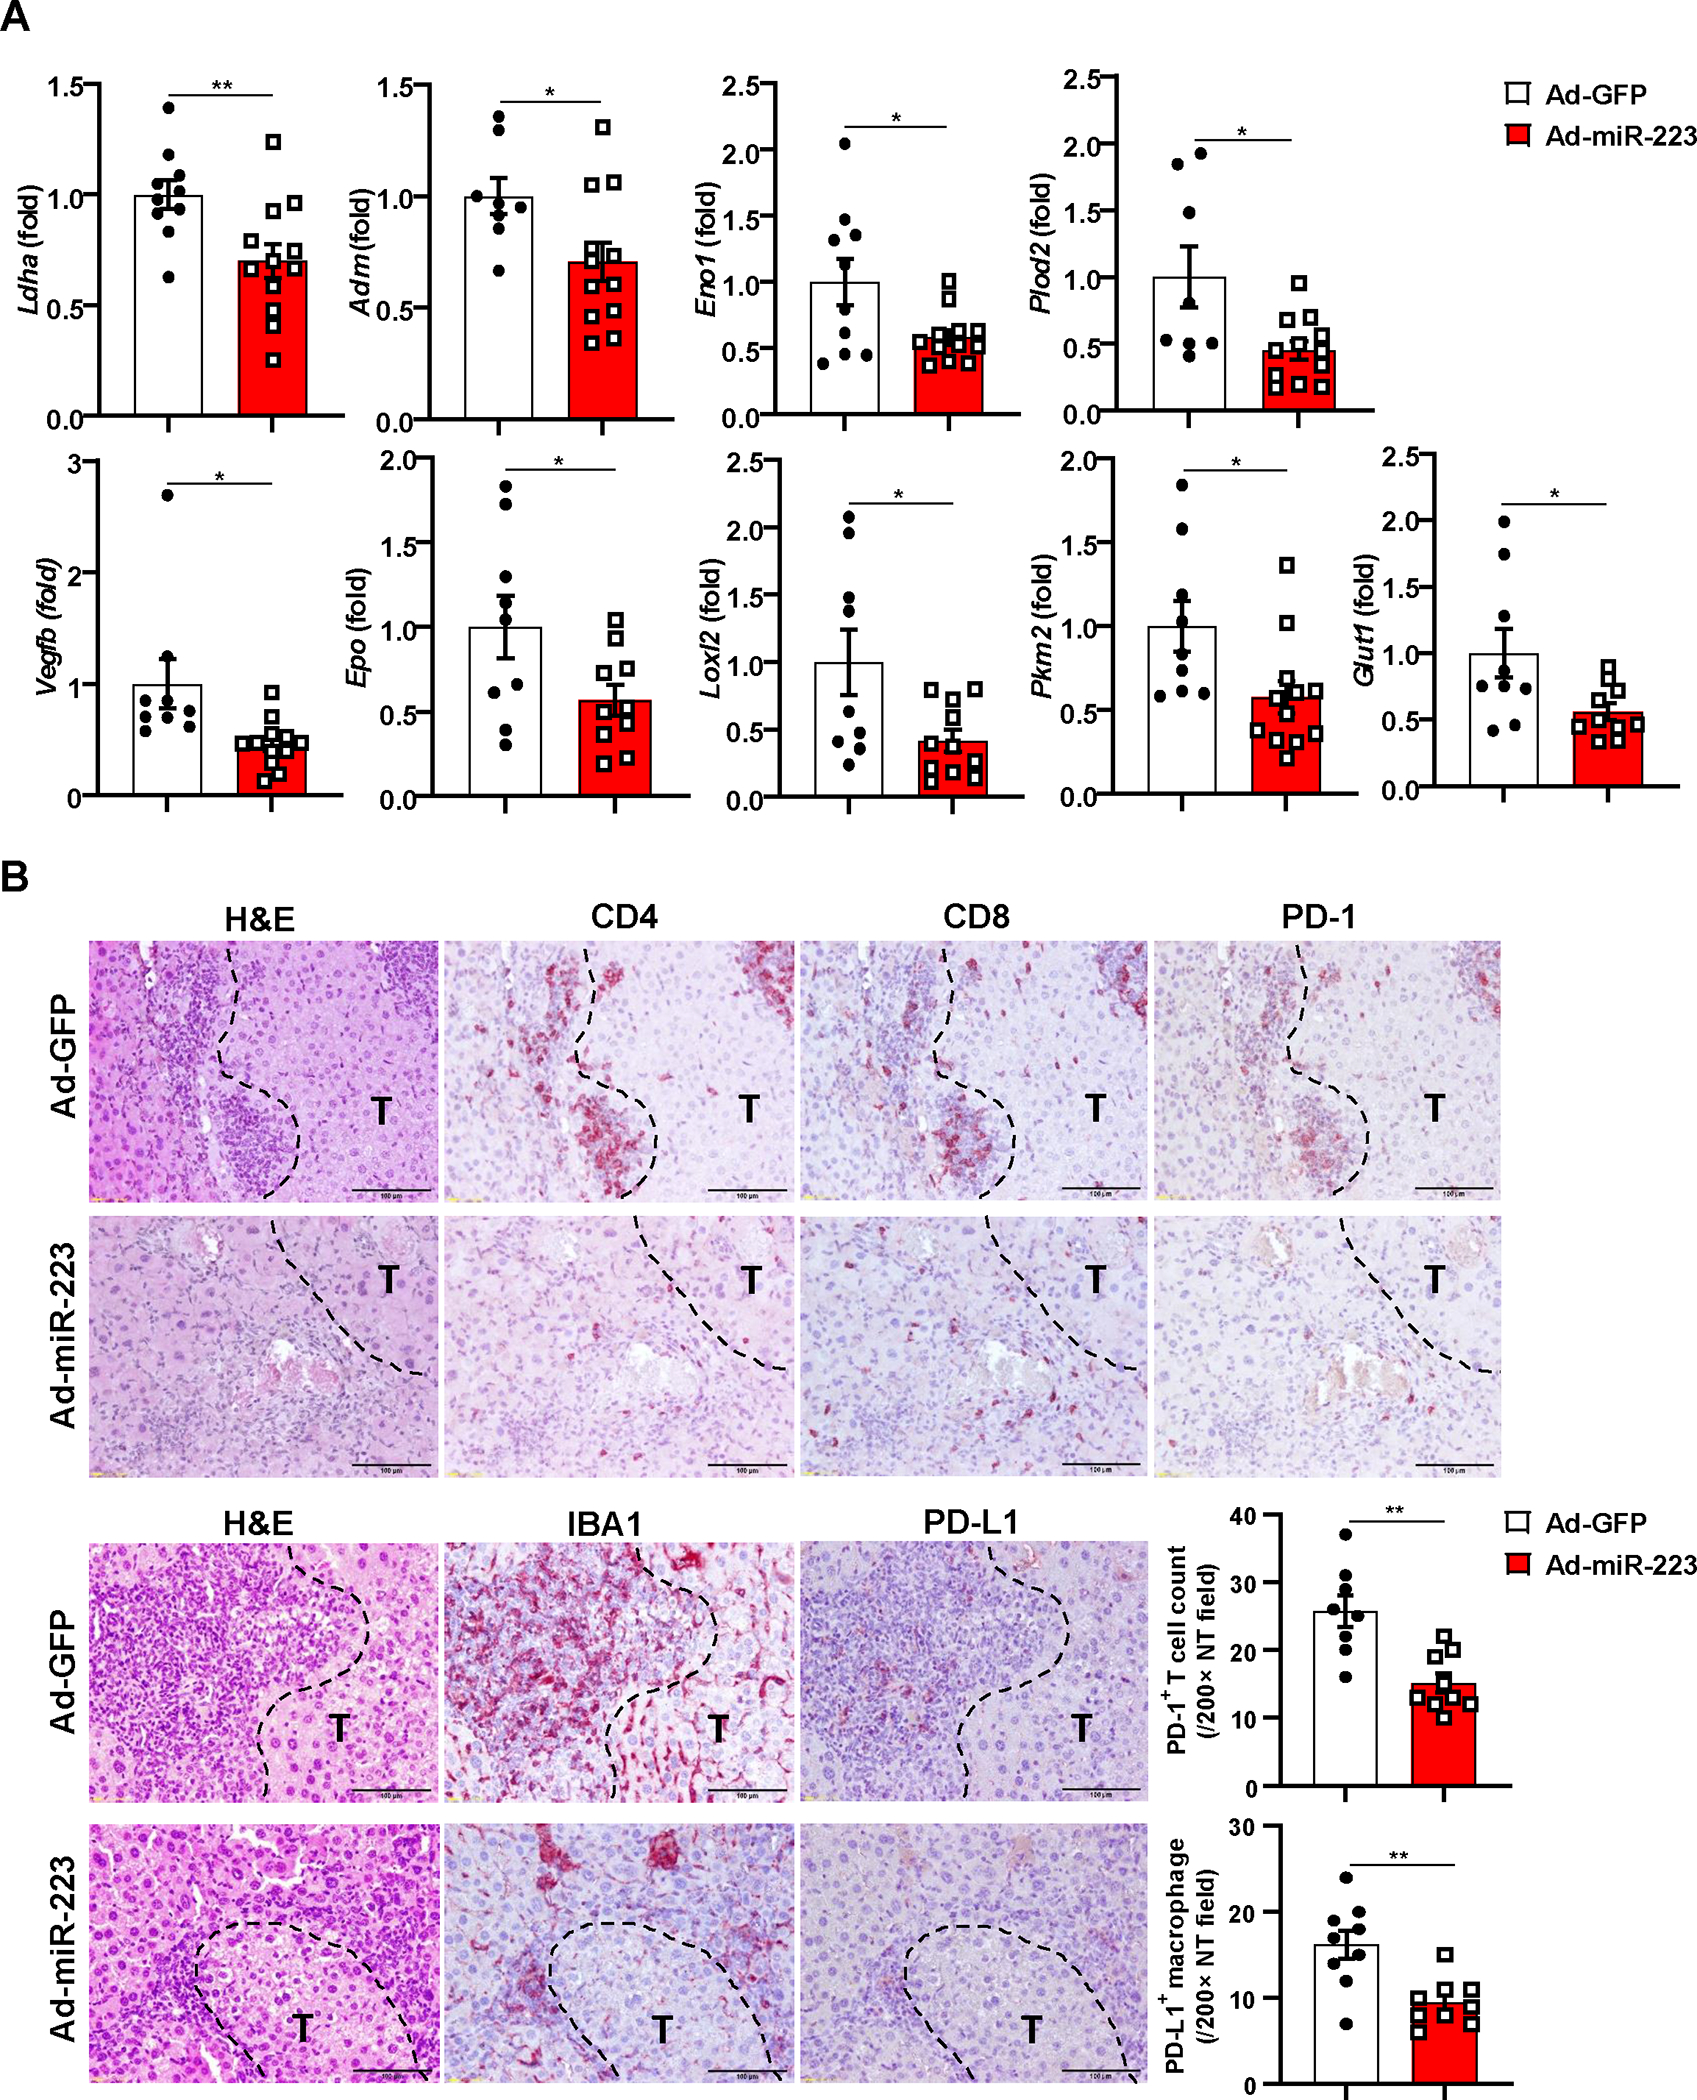
Results: Genetic deletion of miR-223 markedly exacerbated tumourigenesis in inflammation-associated HCC. Compared with wild-type mice, miR-223 knockout mice had more infiltrated programmed cell death 1 (PD-1+) T cells and programmed cell death ligand 1 (PD-L1+) macrophages after DEN+CCl4 administration. Bioinformatic analyses of RNA sequencing data revealed a strong correlation between miR-223 levels and tumour hypoxia, a condition that is well-documented to regulate PD-1/PD-L1. In vivo and in vitro mechanistic studies demonstrated that miR-223 did not directly target PD-1 and PD-L1 in immune cells rather than indirectly downregulated them by modulating tumour microenvironment via the suppression of hypoxia-inducible factor 1α-driven CD39/CD73-adenosine pathway in HCC. Moreover, gene delivery of miR-223 via adenovirus inhibited angiogenesis and hypoxia-mediated PD-1/PD-L1 activation in both HCC models, thereby hindering HCC progression.

Conclusion: The miR-223 plays a critical role in modulating hypoxia-induced tumour immunosuppression and angiogenesis, which may serve as a novel therapeutic target for HCC.

Keywords: CANCER IMMUNOBIOLOGY; HEPATOCELLULAR CARCINOMA; INFLAMMATORY CELLS.


Conflict of interest statement

Competing interests: None declared.

Figures

Figure 1.
Figure 1.. MiR-223 deficiency exacerbates HCC development and angiogenesis.
(A) Scheme of DEN+CCl4-induced HCC mouse model (see details in methods). Representative gross images of livers from miR-223KO and WT mice post DEN+CCl4 treatment are shown. The largest tumor diameter and the number of tumor masses were calculated (right panel). (B) RT-qPCR analyses of HCC markers including Afp, Gpc3, Golm2, and Tff3 in samples from miR-223KO and WT mice after DEN+CCl4. (C) Representative images of Ki-67 and CD31 staining in livers from miR-223KO and WT mice are shown. Tumor region was surrounded by dashed line (T: tumor region). (D) Ki-67 positive cells were counted and quantified as proliferation index; CD31 staining was quantified as the percentage of positive area in the whole section area. (E) RT-qPCR analyses of angiogenesis-related genes Endoglin and Vegf in HCC samples from miR-223KO and WT mice. (F) Western blot analysis of VEGFR2 and phosphorylated VEGFR-2 in non-tumor and tumor samples. Relative p-VEGFR2 protein levels were quantified. Values represent means ± SEM. *P< 0.05, **P< 0.01, ***P< 0.001.
Figure 2.
Figure 2.. MiR-223 deficiency promotes inflammation-associated tumor immunosuppression and PD-1/PD-L1 expression.
WT and miR-223KO mice were challenged with DEN+CCl4 as described in Figure 1. (A) Representative images of H&E staining in livers from miR-223KO and WT mice are shown. The tumor region was surrounded by dashed line (NT: non-tumor region; T: tumor region). (B) Representative images of F4/80 and MPO staining in non-tumor and tumor regions are shown. F4/80+ and MPO+ cells per field (x200) were quantified. (C) The expression levels of targeted immune checkpoint molecules in non-tumor (NT) and tumor (T) samples were analyzed by RT-qPCR analyses. (D) Western blot analysis PD-1 and PD-L1 proteins in control healthy livers, tumor and adjacent non-tumor samples. (E) Correlation between Pdcd1 or Cd274 expression levels and tumor number in DEN+CCl4-treated WT (n=14, blue dots) and miR-223KO mice (n=9, red dots) was analyzed. Values represent means ± SEM. *P< 0.05, **P< 0.01, ***P< 0.001.
Figure 3.
Figure 3.. MiR-223KO mice have higher PD-1+T cells and PD-L1+macrophages than WT mice in DEN+CCl4-induced HCC.
WT and miR-223KO mice were treated with DEN+CCl4 as described in Figure 1. (A, B) Mouse livers from DEN+CCl4-induced HCC were dissociated, PD-1+ or PD-L1+ cells were determined by flow cytometry. PD-L1 and PD-1 expression were mainly detected in CD11b+ CCR2+ macrophages (panel A) and CD4+/CD8+ T cells (panel B), respectively. (C, D) Representative images of PD-1 and PD-L1 staining of tumor and adjacent non-tumor samples from DEN+CCl4 are shown in panel C. PD-1+ and PD-L1+ cells per field were quantified and are shown in panel D. Values represent means ± SEM. *P< 0.05.
Figure 4.
Figure 4.. HIF-1α in HCC cells is a direct downstream target of miR-223.
(A) Gene Ontology (GO) analysis was performed to compare the difference of gene profiling between miR-223high and miR-223low HCC patients in TCGA database, and the results are shown on the right side. (B) Measurement of HIF-1α protein levels by western blot in Hepa1-6 cell after miR-223 mimics transfection. HIF-1α protein levels were quantified (lower left panel). RT-qPCR was performed to determine Hif1a mRNA expression in Hepa1-6 cell after miR-223 mimics transfection (lower right panel). (C) WT and miR-223KO mice were treated with DEN+CCl4 as described in Figure 1. Representative images of HIF-1α staining in HCC samples from miR-223KO and WT mice are shown. Tumor region was surrounded by dashed line (T: tumor region). (D, E) Tumor and adjacent non-tumor samples from miR-223KO and WT mice were subjected to RT-qPCR (panel D) and western blot analysis (panel E). (F) RT-qPCR analyses of HIF-1α target genes in samples from miR-223KO and WT mice after DEN+CCl4. (G) Correlation analysis of Hif1a expression in tumor samples and PD-1/PD-L1 (Pdcd1/Cd274) expression in non-tumor (NT) adjacent liver tissues from DEN+CCl4 challenged WT (n=11; blue dots) and miR-223KO (n=8; red dots) mice. The average value from WT mice was set as 1. Values represent means ± SEM. *P< 0.05, **P< 0.01, ***P< 0.001.
Figure 5.
Figure 5.. MiR-223 downregulates PD-1 and PD-L1 expression by targeting HIF-1α-mediated hypoxia in HCC.
(A) Scheme of co-culture of primary T cells or macrophages with Hepa1-6 cells under normoxia and CoCl2-induced hypoxia. Hepa1-6 cells were transfected with miR-223/NC mimics in vitro prior to establishment of co-culture system. (B, C) PD-1 expression in T cells or PD-L1 expression in macrophages were determined and quantified by western blot analysis. T cells or macrophages without any stimuli were set as control. (D) Representative flow cytometry analysis and quantification of PD-L1 expression of co-cultured primary macrophages. Mean Fluorescent Intensity (MFI) of PD-L1 was quantitated. (E) Representative flow cytometry analysis of PD-1 expression of co-cultured T cells. The percentage of PD-1+ cells was quantified. Values represent means ± SEM. *P< 0.05, **P< 0.01.
Figure 6.
Figure 6.. Inhibition of the CD39/CD73-adenosine pathway ameliorates hypoxia-driven immunosuppression in HCC development.
(A) WT and miR-223KO mice were treated with DEN+CCl4 as described in Figure 1. Levels of extracellular adenosine ectonucleotidases Cd39 and Cd73 mRNA expression, and adenosine levels in HCC tissues from WT and miR-223KO mice were determined. (B) The relative adenosine levels in cell medium were analyzed in Hepa1-6 cells after miR-223/NC mimics transfection under normoxia and hypoxia. (C) Adenosine and/or A2A adenosine receptor inhibitor CPI-444 were applied in primary macrophages or primary T cells, Cd274 and Pdcd1 mRNA expression were determined by RT-qPCR. (D, E) C57BL/6J mice were subjected to CCl4+Hepa1-6-derived HCC model and treated with anti-CD73 (n=10) or isotype antibodies (n=8). Gross images of livers are shown, and tumor volume (mm3) was measured (panel D). The percentages of PD-1+CD8+ T cells and PD-L1+ macrophages were analyzed by flow cytometry (panel E). Values represent means ± SEM. *P< 0.05, **P< 0.01, ***P< 0.001.
Figure 7.
Figure 7.. Knockdown of Hif1a in HCC abolishes miR-223 deficiency-driven angiogenesis and PD-1/PD-L1 activation.
Four groups of mice were used: NC-shRNA or Hif1a-shRNA-transfected HCC in WT and miR-223KO mice in CCl4 plus Hepa1-6 orthotopic HCC model. NC-shRNA stands for negative control of Hif1a-shRNA. (A) Gross images of HCC tumor masses. (B) Tumor volumes were analyzed. (C) Representative images of CD31 staining in HCC sections (NT: non-tumor region; T: tumor region) of 4 groups are shown; scale bar=200 μm. (D) RT-qPCR analyses of angiogenesis-related genes in HCC tissues. (E) Representative images of PD-1/PD-L1 staining in HCC section of 4 groups are shown. The specific enlarged regions are shown on the right upper corner of the image. The numbers of PD-L1+ and PD-1+ cells were quantified and are shown in Supporting Figure 11E. (F) RT-qPCR analyses of Pdcd1 and Cd274 mRNA levels in adjacent non-tumor samples. values represent means ± SEM. *P< 0.05, **P< 0.01.
Figure 8.
Figure 8.. Administration of Ad-miR-223 attenuates PD-1/PD-L1 activation and tumor angiogenesis, hypoxia in DEN+CCl4-induced HCC.
C57BL/6J mice were treated with DEN+CCl4 as described in Figure 1, and were treated with Ad-miR-223 or Ad-GFP. (A) Gross images of HCC tumor masses from Ad-miR-223 and control Ad-GFP-treated mice are shown. (B) The largest tumor diameter and the number of tumor masses between Ad-GFP and Ad-miR-223-treated mice were analyzed. (C, D) Representative immunofluorescence staining of CD31/PCNA (panel C) or hypoxia marker (CA9)/proliferative marker (Ki-67) (panel D) in tumor regions of Ad-GFP and Ad-miR-223-treated liver samples are shown. Relative CD31 and CA9 intensity, the percentages of PCNA and Ki67 positive cells were quantified and are shown in Supporting Figure 12B. (E, F) Protein levels of phosphorylated Tie-2 and VEGFR2 (p-TIE-2, p-VEGFR2), HIF-1α, PCNA and AFP were determined and quantified by western blot. Values represent means ± SEM. *P< 0.05, **P< 0.01, ***P< 0.001.
Figure 9.
Figure 9.. Overexpression of miR-223 in vivo reduces tumor hypoxia and PD-1/PD-L1 expression in DEN+CCl4-induced HCC.
C57BL/6J mice were treated with DEN+CCl4 as described in Figure 1, and were treated with Ad-miR-223 or Ad-GPF. (A) RT-qPCR analyses of HIF-1α target genes in HCC samples from Ad-miR-223 and control Ad-GFP-treated mice. (B) Upper panel: representative immunostaining for infiltrated PD-1+ CD4+/CD8+ T cells surrounding tumor region are shown. Scale bar: 200μm. Lower left panel: representative images for PD-L1+ macrophages surrounding tumor region are shown. Lower right panel: counts of PD-1+ T cells and PD-L1+ macrophages in non-tumor region (NT) were quantified and are shown. Tumor region was labeled with ‘T’; tumor border was depicted with black dash line. Values represent means ± SEM. *P< 0.05, **P< 0.01.
Figure 10.
Figure 10.. Administration of Ad-miR-223 suppresses PD-1/PD-L1 axis and angiogenesis in inflammation-related orthotopic HCC model.
C57BL/6J mice were treated with CCl4 plus Hepa1-6-implantation and were treated with Ad-miR-223 (n=8) or Ad-GPF (n=6). (A) Gross images of livers. (B) Tumor volume (mm3) in Ad-GFP and Ad-miR-223 treated-mice were analyzed. (C) miR-223 levels in tumor tissues of Ad-miR-223- or Ad-GFP-treated mice were measured. (D) Protein levels of HIF-1α, PCNA, phosphorylated VEGFR2, total VEGFR2 were determined by western blot analysis. (E) Quantitative analysis of HIF-1α, PCNA, total VEGFR2 and ratio of phosphorylated VEGFR2 to total VEGFR2 (p-VEGFR2/VEGFR2 ratio). (F) Upper panel: Representative images of H&E and immunostaining (CD31, Ki-67, PD-1, PD-L1) in consecutive liver sections from Ad-GFP and Ad-miR-223-treated groups are shown. Lower panel: quantification of CD31, Ki-67, PD-1, PD-L1 staining. Tumor region was surrounded by dashed white line. (T: tumor region). Values represent means ± SEM. *P< 0.05, **P< 0.01, ***P< 0.001.
Figure 11.
Figure 11.. A model depicting the anti-HCC role of miR-223 in blocking tumor hypoxia-driven PD-1/PD-L1 immunosuppression and angiogenesis.
In chronic inflammation-associated HCC, the source of miR-223 in HCCs is likely transferred via the extracellular vesicles from myeloid cells including neutrophils and macrophages, which are enriched in adjacent tumor regions. MiR-223 directly inhibits Hif1a/HIF-1α in HCC cells and subsequently alters hypoxic tumor microenvironment, thereby limiting hypoxia-driven angiogenesis and immunosuppression. HIF-1α-mediated upregulation of CD39/CD73-adenosine pathway contributes to PD-1 and PD-L1 upregulation in immune cells, which is suppressed by miR-223.

Comment in

Similar articles

Cited by

References

    1. Hanahan D, Weinberg RA. Hallmarks of cancer: the next generation. Cell 2011;144:646–74. - PubMed
    1. Finn RS, Qin S, Ikeda M, et al. Atezolizumab plus Bevacizumab in Unresectable Hepatocellular Carcinoma. N Engl J Med 2020;382:1894–1905. - PubMed
    1. Sengez B, Carr BI, Alotaibi H. EMT and Inflammation: Crossroads in HCC. J Gastrointest Cancer 2022. - PubMed
    1. Yang YM, Kim SY, Seki E. Inflammation and Liver Cancer: Molecular Mechanisms and Therapeutic Targets. Semin Liver Dis 2019;39:26–42. - PMC - PubMed
    1. Geh D, Leslie J, Rumney R, et al. Neutrophils as potential therapeutic targets in hepatocellular carcinoma. Nat Rev Gastroenterol Hepatol 2022;19:257–273. - PubMed

Publication types