

Demographic recruitment bias of adults in United States randomized clinical trials by disease categories between 2008 to 2019: a systematic review and meta-analysis
- PMID: 36593228
- PMCID: PMC9807581
- DOI: 10.1038/s41598-022-23664-1
Demographic recruitment bias of adults in United States randomized clinical trials by disease categories between 2008 to 2019: a systematic review and meta-analysis
Abstract
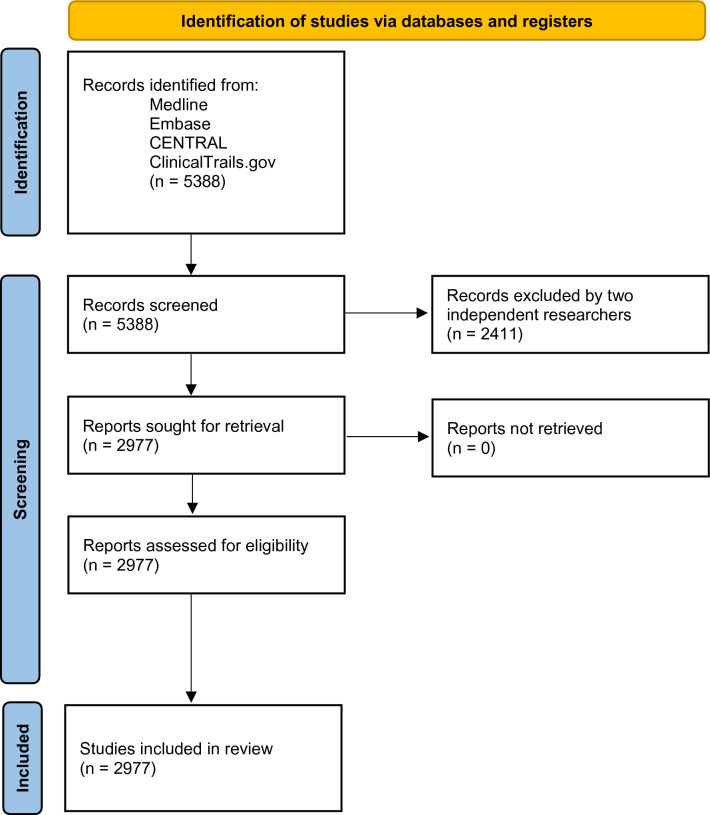
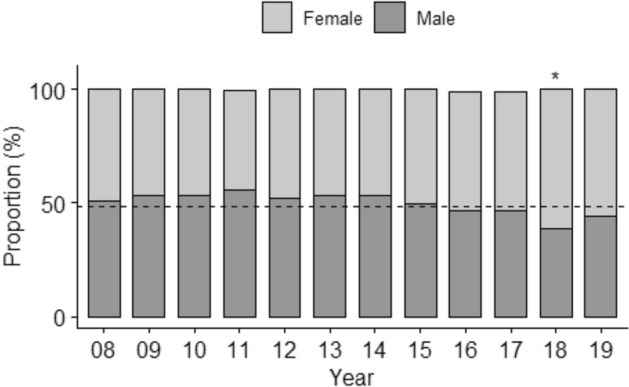
To promote health equity within the United States (US), randomized clinical trials should strive for unbiased representation. Thus, there is impetus to identify demographic disparities overall and by disease category in US clinical trial recruitment, by trial phase, level of masking, and multi-center status, relative to national demographics. A systematic review and meta-analysis were conducted using MEDLINE, Embase, CENTRAL, and ClinicalTrials.gov, between 01/01/2008 to 12/30/2019. Clinical trials (N = 5,388) were identified based on the following inclusion criteria: study type, location, phase, and participant age. Each clinical trial was independently screened by two researchers. Data was pooled using a random-effects model. Median proportions for gender, race, and ethnicity of each trial were compared to the 2010 US Census proportions, matched by age. A second analysis was performed comparing gender, race, and ethnicity proportions by trial phase, multi-institutional status, quality, masking, and study start year. 2977 trials met inclusion criteria (participants, n = 607,181) for data extraction. 36% of trials reported ethnicity and 53% reported race. Three trials (0.10%) included transgender participants (n = 5). Compared with 2010 US Census data, females (48.3%, 95% CI 47.2-49.3, p < 0.0001), Hispanics (11.6%, 95% CI 10.8-12.4, p < 0.0001), American Indians and Alaskan Natives (AIAN, 0.19%, 95% CI 0.15-0.23, p < 0.0001), Asians (1.27%, 95% CI 1.13-1.42, p < 0.0001), Whites (77.6%, 95% CI 76.4-78.8, p < 0.0001), and multiracial participants (0.25%, 95% CI 0.21-0.31, p < 0.0001) were under-represented, while Native Hawaiians and Pacific Islanders (0.76%, 95% CI 0.71-0.82, p < 0.0001) and Blacks (17.0%, 95% CI 15.9-18.1, p < 0.0001) were over-represented. Inequitable representation was mirrored in analysis by phase, institutional status, quality assessment, and level of masking. Between 2008 to 2019 representation improved for only females and Hispanics. Analysis stratified by 44 disease categories (i.e., psychiatric, obstetric, neurological, etc.) exhibited significant yet varied disparities, with Asians, AIAN, and multiracial individuals the most under-represented. These results demonstrate disparities in US randomized clinical trial recruitment between 2008 to 2019, with the reporting of demographic data and representation of most minorities not having improved over time.
© 2022. The Author(s).
Conflict of interest statement
The authors declare no competing interests.
Figures


Comment in
-
Promoting equitable patient representation in therapeutic clinical trials by accounting for population disease burden.Sci Rep. 2025 Mar 27;15(1):10591. doi: 10.1038/s41598-025-91174-x. Sci Rep. 2025. PMID: 40148374 Free PMC article. No abstract available.
References
-
- Office of Management and Budget,. Revisions to the standards for the classification of federal data on race and ethnicity. Fed. Reg.62(210), 58782–58790 (1997).
-
- NIH policy and guidelines on the inclusion of women and minorities as subjects in clinical research. U.S. department of health and human services, National Institute of Health (2001).
-
- Freedman, L. S. et al. Inclusion of women and minorities in clinical trials and the NIH revitalization act of 1993—The perspective of NIH clinical trialists. Control. Clin. Trials16(5), 277–285 (1995). - PubMed
-
- WHO Trial Registration Data Set. ICRTP registry network, World Health Organization.
Publication types
MeSH terms
Grants and funding
LinkOut - more resources
Full Text Sources
Miscellaneous
