. 2023 Jan;8(1):77-90.
doi: 10.1038/s41564-022-01265-y. Epub 2023 Jan 2.

Evolution of CRISPR-associated endonucleases as inferred from resurrected proteins

Affiliations

Evolution of CRISPR-associated endonucleases as inferred from resurrected proteins

Borja Alonso-Lerma et al. Nat Microbiol. 2023 Jan.

Abstract

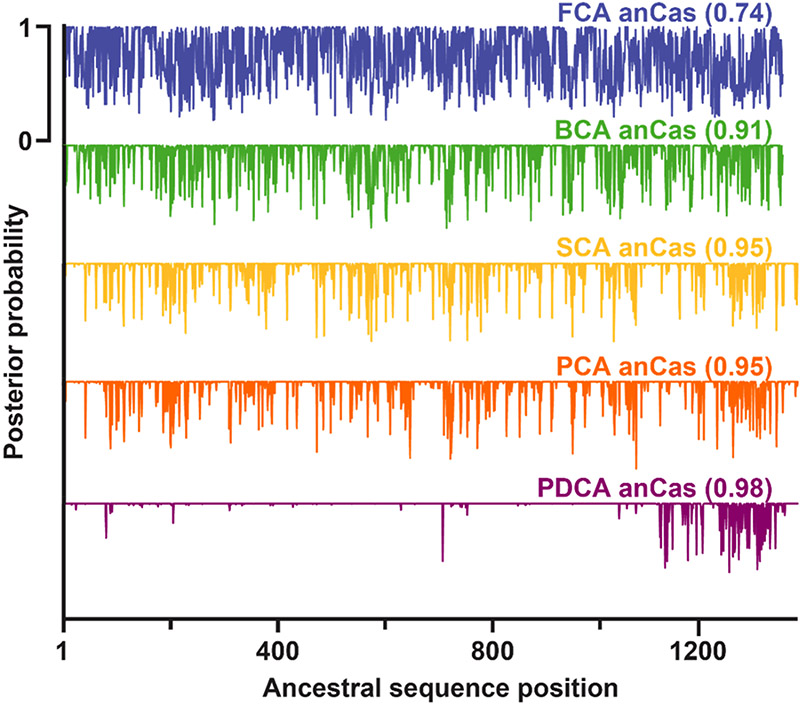
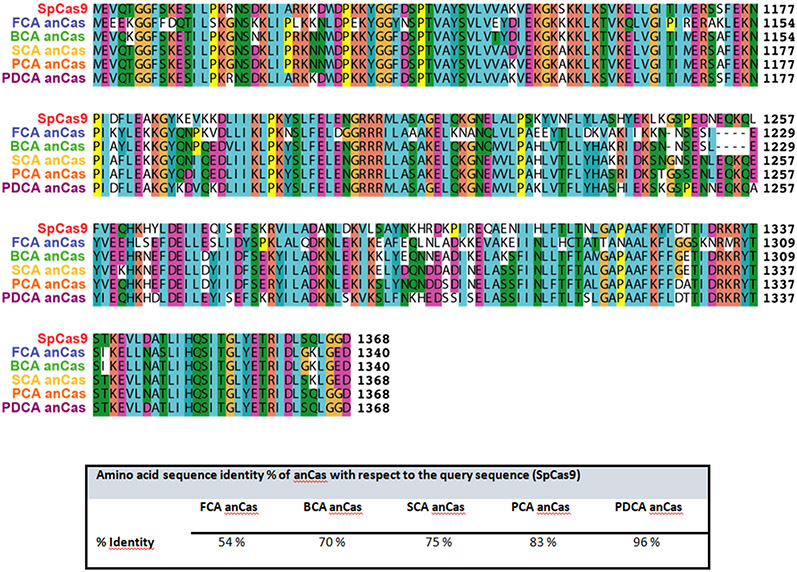
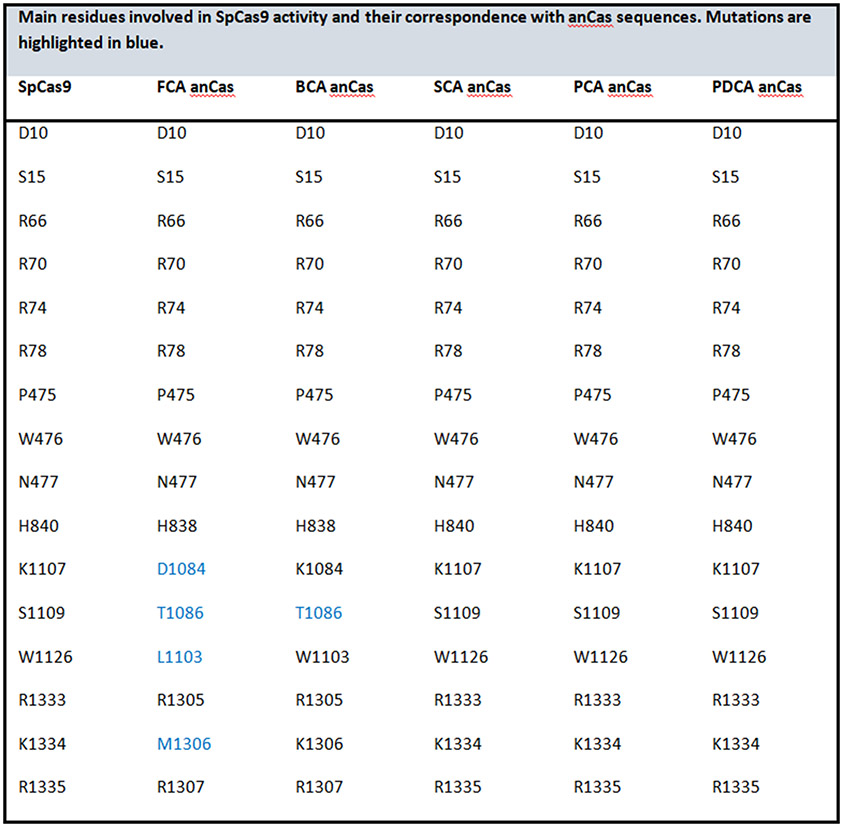
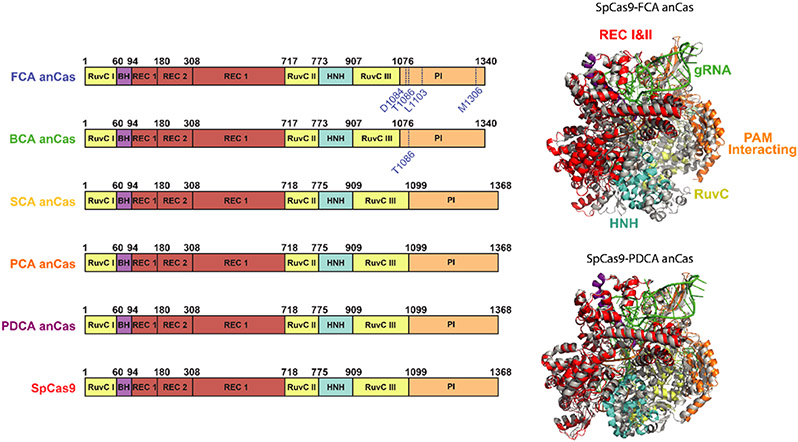
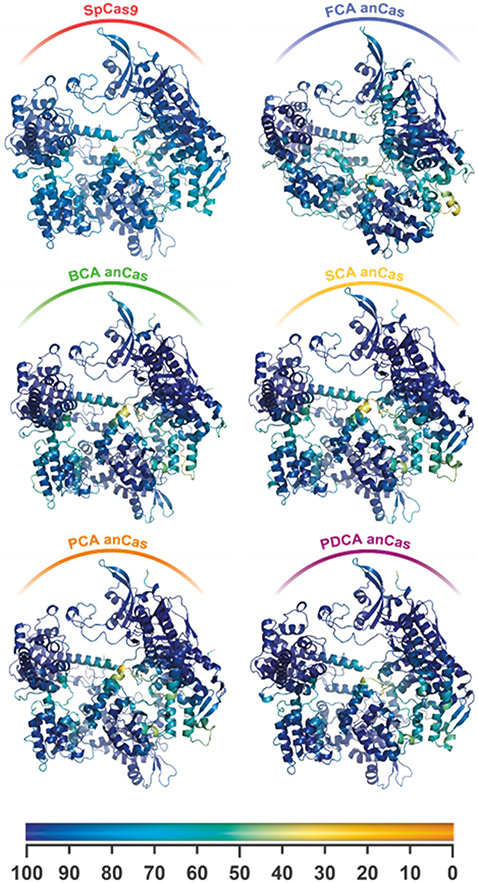
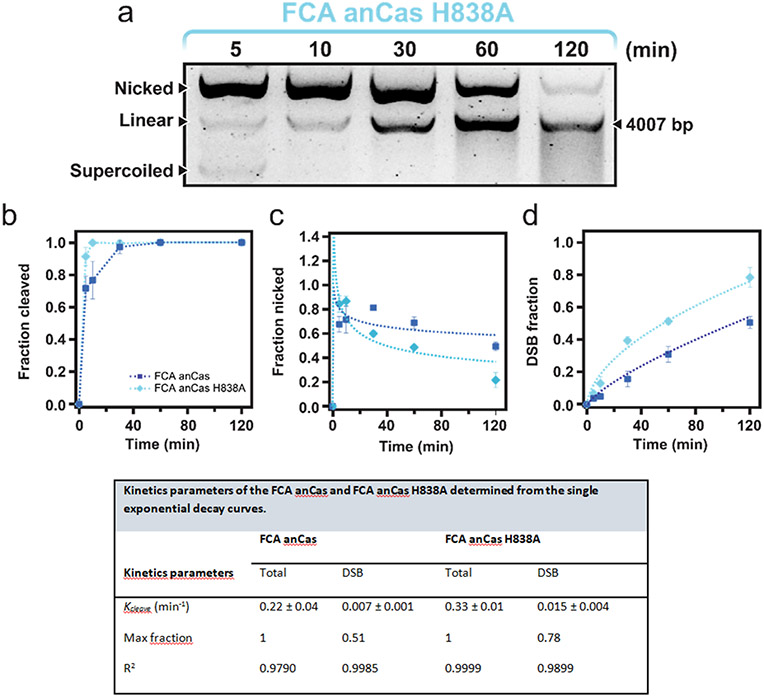
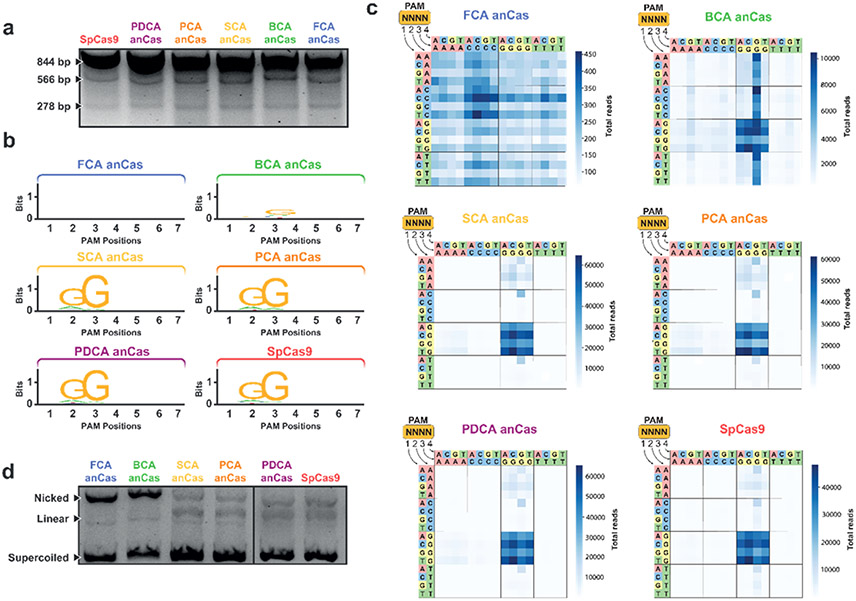
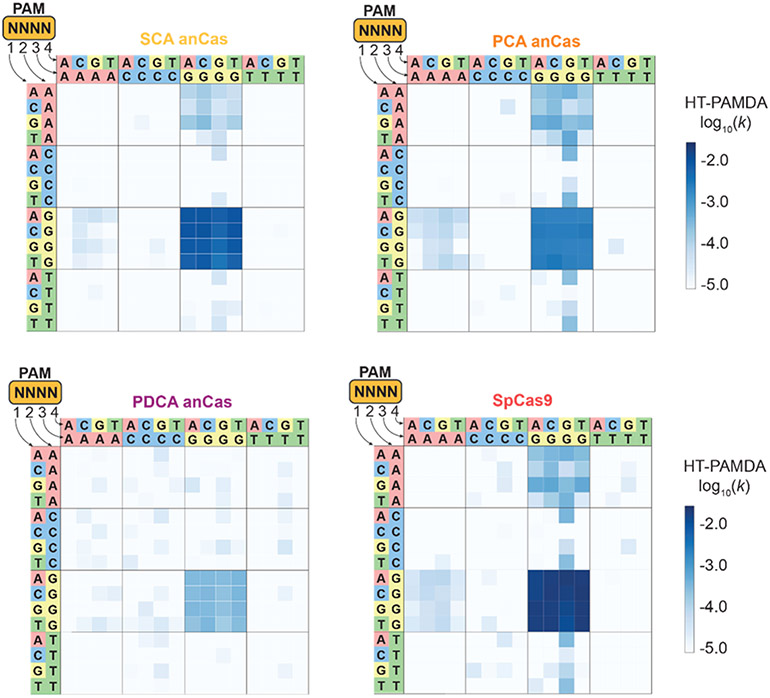
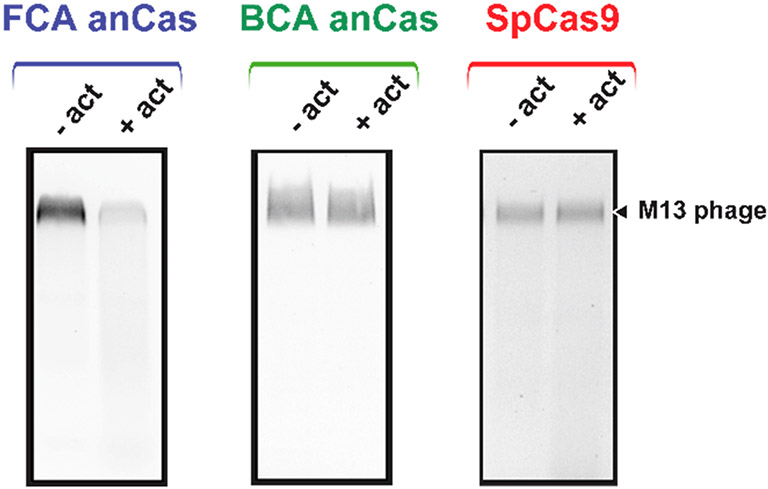
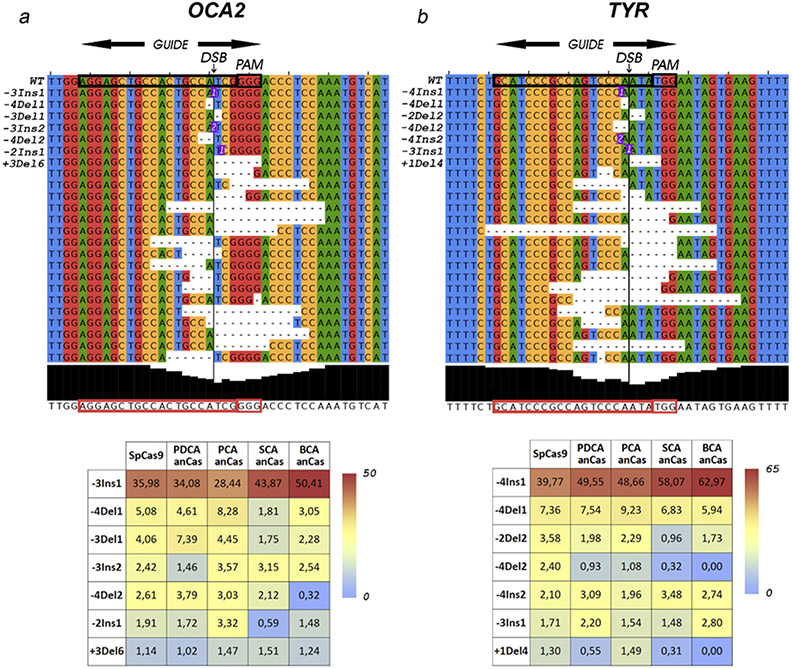
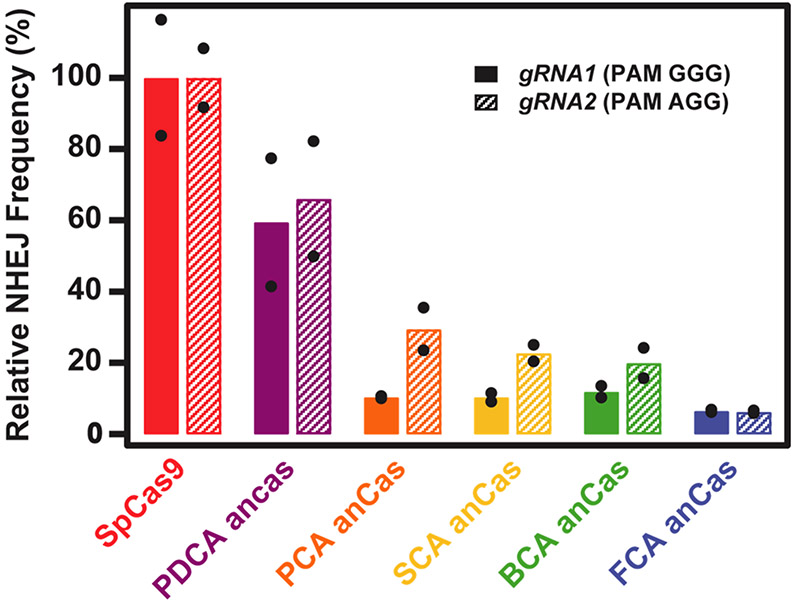
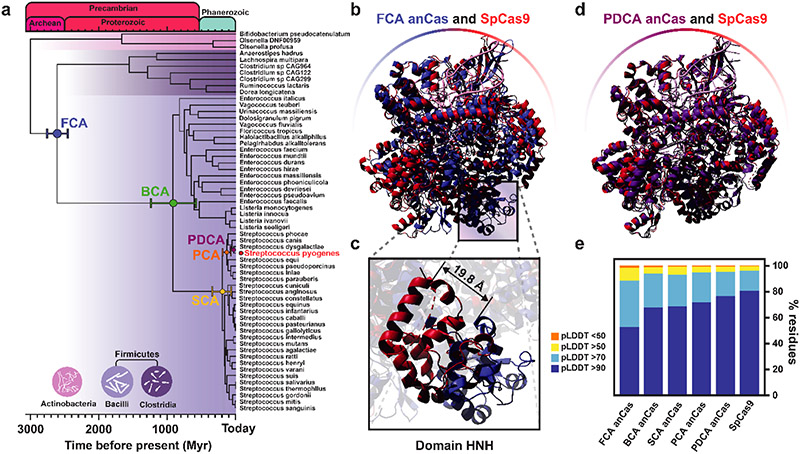
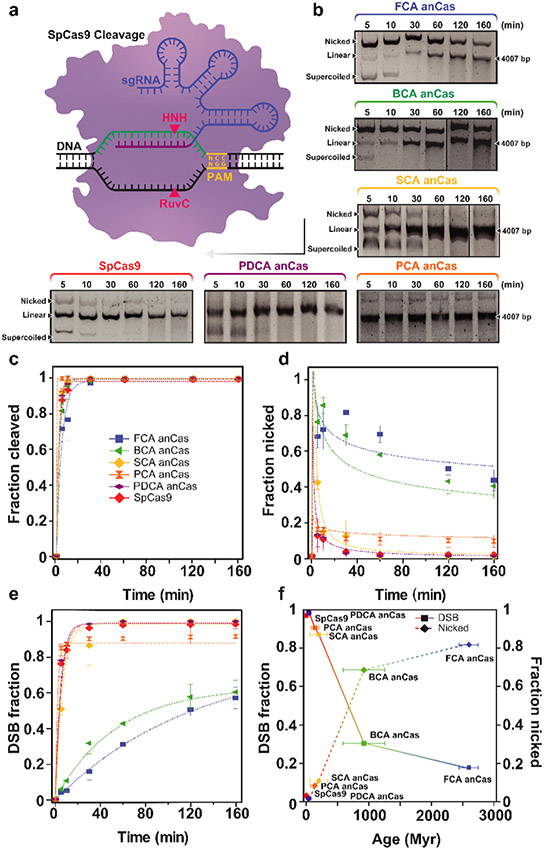
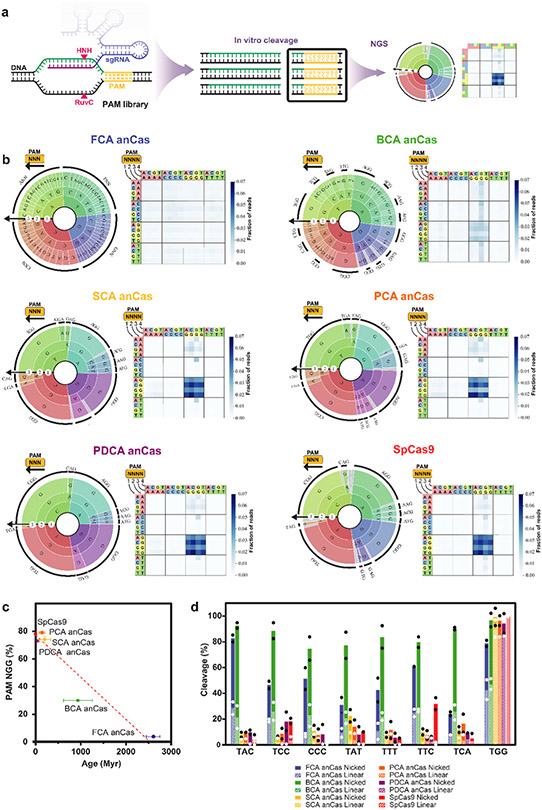
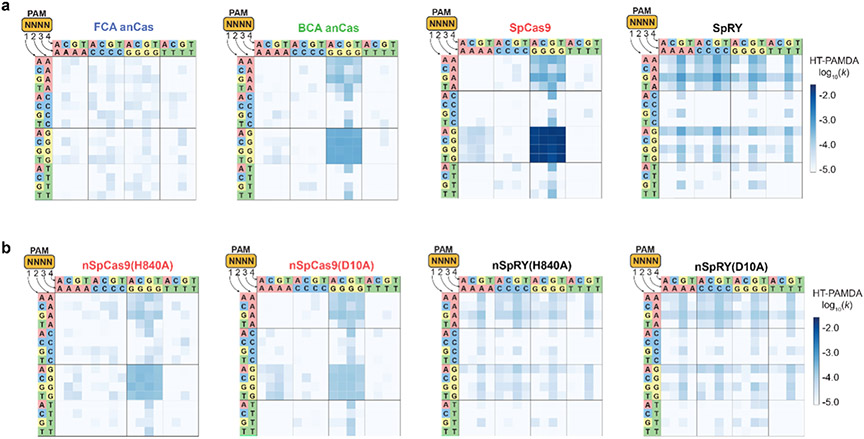
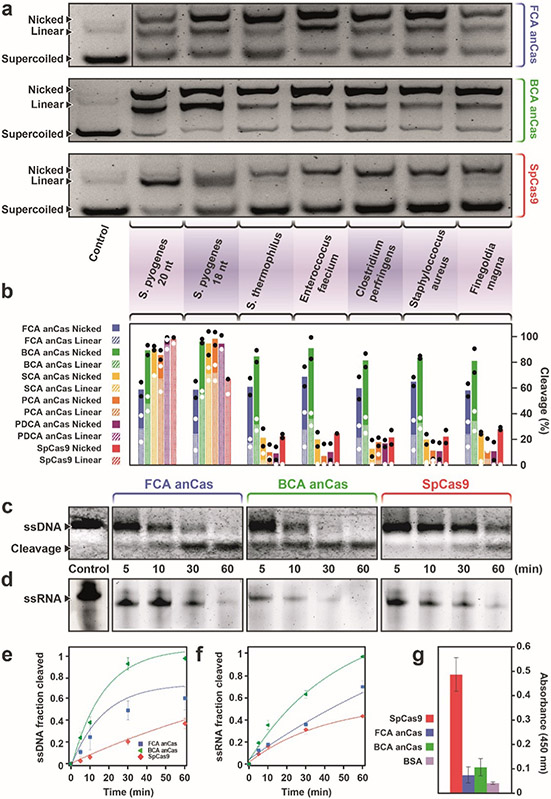
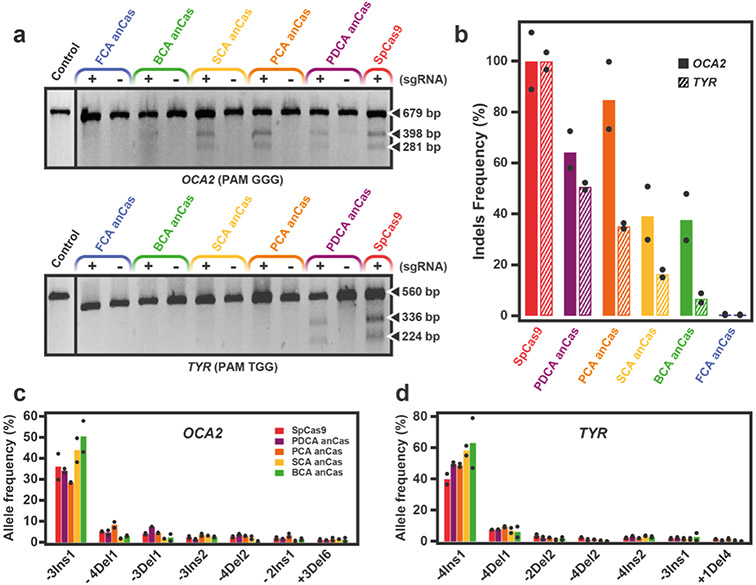
Clustered regularly interspaced short palindromic repeats (CRISPR)-associated Cas9 is an effector protein that targets invading DNA and plays a major role in the prokaryotic adaptive immune system. Although Streptococcus pyogenes CRISPR-Cas9 has been widely studied and repurposed for applications including genome editing, its origin and evolution are poorly understood. Here, we investigate the evolution of Cas9 from resurrected ancient nucleases (anCas) in extinct firmicutes species that last lived 2.6 billion years before the present. We demonstrate that these ancient forms were much more flexible in their guide RNA and protospacer-adjacent motif requirements compared with modern-day Cas9 enzymes. Furthermore, anCas portrays a gradual palaeoenzymatic adaptation from nickase to double-strand break activity, exhibits high levels of activity with both single-stranded DNA and single-stranded RNA targets and is capable of editing activity in human cells. Prediction and characterization of anCas with a resurrected protein approach uncovers an evolutionary trajectory leading to functionally flexible ancient enzymes.


Figures

Extended Data Fig. 1.
Extended Data Fig. 1.. Posterior probability distribution for each inferred residue of all ancestral anCas endonucleases.
The residue with the highest posterior probability is assigned at each position. The posterior probability average of each form is indicated in brackets. In all cases, posterior probability average is close to 1 except for FCA anCas which shows an average value of 0.74.
Extended Data Fig. 2.
Extended Data Fig. 2.. Alignment of the amino acid sequences from PI domain of anCas and SpCas9.
Percentage of identity of the different anCas sequences with respect to SpCas9.
Extended Data Fig. 3.
Extended Data Fig. 3.. List of important mutations and domain organization of anCas compared to SpCas9.
Mutations of the main residues involved in PAM recognition are marked in blue. Bottom figure depicts domain organization and structural alignment of SpCas9-FCA and SpCas9 PDCA anCas. Ancestral anCas are grey colored and SpCas9 colored by domains.
Extended Data Fig. 4.
Extended Data Fig. 4.. Structural predictions of anCas and SpCas9 by AlphaFold2.
Structures are colored by pLDDT score according to the color bar.
Extended Data Fig. 5.
Extended Data Fig. 5.. Activity of FCA anCas H838A endonuclease on a supercoiled DNA substrate
(a) In vitro cleavage assay for anCas FCA H838A on a 4007 bp substrate at different reaction times showing nicked and linear fractions. (b) Quantification of total cleavage fraction at different reaction times and exponential fits (lines). (c) Quantification of fraction nicked at different times. (d) Quantification of DSB cleavage. Single-exponential fits were used to obtain kcleave and maximum fraction cleaved (amplitude). Values reported as mean ± SD, where n = 2.
Extended Data Fig. 6.
Extended Data Fig. 6.. PAM determination of anCas enzymes.
(a) Example of in vitro cleavage assay to obtain 278 bp fragment for NGS analysis. (b) Weblogo of the different PAM recognized by anCas and SpCas9. (c) Heatmaps illustrating the total reads for each of the possible 256 NNNN PAMs, analyzed from NGS of the of 278 bp cleaved DNA fragments from panel a. (d) In vitro cleavage assay using the PAM sequence TCC.
Extended Data Fig. 7.
Extended Data Fig. 7.. HT-PAMDA-determined PAM profiles of Cas enzymes.
PAM profiles of anCas enzymes and SpCas9 as determined by HT-PAMDA. Rate constants corresponding to Cas cleavage activity on each of the 256 NNNN PAMs are illustrated as mean log10 values of cleavage reactions against two unique spacer sequences. For comparison, the SpCas9 is re-plotted from Fig. 4.
Extended Data Fig. 8.
Extended Data Fig. 8.. Trans-activity of FCA anCas, BCA anCas and SpCas on M13 phage ssDNA.
Nonspecific M13 ssDNA cleavage with sgRNA and complementary (or not) 85nt ssDNA activator with no sequence homology to M13 circular ssDNA. FCA anCas can cleave the ssDNA substrate in the presence of the activator, whereas BCA anCAs and SpCas9 do not cleave the same substrate.
Extended Data Fig. 9.
Extended Data Fig. 9.. Analysis of the in vivo activity of anCas variants.
Alignments generated by Jalview program of the wild-type and the most frequent edited alleles (indels) detected by Mosaic Finder in (a) OCA2 and (b) TYR genes after NHEJ cell repair in HEK 293T cells. Heatmaps are shown underneath the alignments highlighting the frequencies of the top-7 most frequent alleles generated after cleavage and repair with SpCas9, PDCA, PCA, SCA and BCA anCas, once normalized with respect to the total number of indels for each Cas. The guide, the PAM and the DSB theoretical site are marked in the figure. For the mutation nomenclature of each allele we consider the first nucleotide of the PAM as +1. Numbers within the allele sequences represent the length of insertions or deletion in the exact location indicated by the first figure. Example: −4Ins1, insertion of 1 nucleotide four bases upstream the PAM.
Extended Data Fig. 10.
Extended Data Fig. 10.. Traffic Light Reporter cleavage assay targeting gene TLR.
The relative NHEJ frequency is estimated by the number of RFP-positive cells and is normalized to SpCas9. Bars represent the average value of two independent experiments indicated by the black dots.
Figure 1.
Figure 1.. Phylogenetic and structural analysis of anCas endonucleases.
(a) Phylogenetic chronogram of Cas9 endonucleases. Fifty-nine sequences were chosen from two phyla, Firmicutes and Actinobacteria, with two classes, Bacilli and Clostridia, belonging to Firmicutes. Identification codes of all sequence can be found in the Supplementary Information. Divergence times were estimated using Bayesian inference and information from the Time Tree of Life. Internal nodes from Firmicutes Common Ancestor (FCA), Bacilli Common Ancestor (BCA), Streptococci Common Ancestor (SCA), Pyogenic Common Ancestor (PCA) and Pyogenes-Dysgalactiae Common Ancestor (PDCA) were selected for testing. Node height error bars are indicated per each selected node. (b) Superposition of structural prediction of FCA anCas using AlphaFold2 (blue) with x-Ray structure of SpCas9 with guide RNA and target DNA (PDB:4oo8, red). (c) Isolated HNH domains of SpCas9 (red) and FCA anCas (blue) from whole structure coordinates. (d) Superposition of structural prediction of PDCA anCas with guide RNA and target DNA using AlphaFold2 (purple) with x-Ray structure of SpCas9 (PDB:4oo8, red). (e) pLDDT values for all anCas as estimated from AlphaFold2 prediction.
Figure 2.
Figure 2.. Activity of anCas endonucleases on a supercoiled DNA substrate.
(a) Schematic representation of endonuclease activity on a supercoiled substrate. (b) In vitro cleavage assay for SpCas9 and all anCas on a 4007 bp substrate at different reaction times showing nicked and linear fractions. Black arrow top-down and right-left represents the chronological order. (c) Quantification of total cleavage at different reaction times and exponential fits (lines). (d) Quantification of nicked fraction for all anCas and SpCas9 at different times. (e) Quantification of DSB cleavage. Single-exponential fits were used to obtain kcleave and maximum fraction cleaved (amplitude). Fitting parameters are summarized in Table 1. Values reported as mean ± SD, where n = 2. (f) DSB fraction (left axis) and nicked fraction (right axis) at 30 minutes reaction plotted against evolutionary time. Horizontal error bars represent the node height error per each anCas form.
Figure 3.
Figure 3.. PAM determination of anCas.
(a) Scheme of in vitro determination of PAM preference using a substrate library encoding a random 7-nt PAMs using Next-generation Sequencing. Two fragments of 566 and 278 bp are generated after target cleavage. (b) PAM wheels (Krona plots) with 3nt PAM and heatmaps with 4nt PAM for all five anCas and SpCas9, used as control. (c) Percentage of reads containing an NGG PAMs 3-4 bp downstream from the cleavage position plotted against evolutionary time. Values reported as mean ± SD, where n = 2. Horizontal error bars represent the node height error per each anCas form (d) In vitro cleavage assay (DSB and nicked products) using a variety of PAMs represented by TNN and CCC as control. Incubation time was 10 min. Bars represent the average value of two independent experiments indicated by the black (nicked) and white (linear) dots.
Figure 4.
Figure 4.. HT-PAMDA assay.
(a) PAM profiles of anCas, SpCas9 and SpRY proteins as determined by HT-PAMDA. Rate constants corresponding to Cas cleavage activity are illustrated as log10 values and are the mean of cleavage reactions against two unique spacer sequences. (b) PAM profiles of contemporary Cas9 and variant SpRY proteins with inactivating mutations in the HNH (H840A) or RuvC (D10A) domain result in a single stranded DNA nickase enzyme with attenuated rate constant values relative to the double-stranded nuclease.
Figure 5.
Figure 5.. sgRNA test and nuclease activity of anCas on single-stranded substrates.
(a) In vitro cleavage assay on a supercoiled DNA substrate of anCas and SpCas9 using sgRNAs from different species. FCA, BCA anCas and SpCas9 are shown. (b) Quantification of in vitro cleavage for all anCas and SpCas9 using the different sgRNAs. Bars represent the average value of two independent experiments indicated by the black (nicked) and white (linear) dots. (c) In vitro cleavage assay on an 85 nt ssDNA fragment at different incubation times for FCA, BCA anCas and SpCas9. (d) In vitro cleavage assay on a 60 nt ssRNA at different incubation times for FCA, BCA anCas and SpCas9. In both (c) and (d), the control lane is the same for the three proteins. (e) Quantification of fraction cleavage of ssDNA at different times and exponential fits for determination of kinetics parameters. (f) Quantification of fraction cleavage of ssRNA at different times and exponential fits for determination of kinetics parameters. All kinetics parameters are summarized in Table 2. Values reported as mean ± SD, where n = 2. (g) Results from ELISA test of Anti-Cas9 rabbit antibody against SpCas9, FCA anCas, BCA anCas and BSA, used as control. Results are reported as average, and S.D. calculated from three independent experiments.
Figure 6.
Figure 6.. Activity of anCas endonucleases in HEK293T human cells.
(a) T7 endonuclease mismatch assay for OCA2 and TYR genes. Expected fragments for OCA2 were 398 and 281 bp for a 679 bp amplified target, and 336 and 224 bp for TYR for a total 560 bp fragment. Experiments with (+) and without (−) sgRNA were run for each anCas. (b) Indels determination for OCA2 and TYR by NGS of the experiments in (a) analyzed using Mosaic Finder. Indels frequency is normalized to SpCas9. (c) Allele frequency for OCA2 and (d) TYR. Position of preferred cleavage was analyzed determining the preference, insertion (Ins) or deletion (Del) with position indicated upstream (−) or downstream (+) with respect to PAM. Length of the indel is indicated below the x axis (e.g. −3Ins1). The preferred allele for OCA2 is one insertion at three nucleotides upstream the PAM (−3Ins1). In the case of TYR, we find one insertion at the fourth nucleotide upstream the PAM as the preferred allele (−4Ins1). Bars represent the average value of two independent experiments indicated by the black dots.

Similar articles

Cited by

References

    1. Mohanraju P et al. Alternative functions of CRISPR–Cas systems in the evolutionary arms race. Nature Reviews Microbiology (2022). - PubMed
    1. Makarova KS et al. Evolutionary classification of CRISPR–Cas systems: a burst of class 2 and derived variants. Nature Reviews Microbiology 18, 67–83 (2020). - PMC - PubMed
    1. Garneau JE et al. The CRISPR/Cas bacterial immune system cleaves bacteriophage and plasmid DNA. Nature 468, 67–71 (2010). - PubMed
    1. Barrangou R et al. CRISPR Provides Acquired Resistance Against Viruses in Prokaryotes. Science 315, 1709–1712 (2007). - PubMed
    1. Karginov FV & Hannon GJ The CRISPR system: small RNA-guided defense in bacteria and archaea. Mol Cell 37, 7–19 (2010). - PMC - PubMed

Publication types

MeSH terms

Substances