. 2023 Jun;41(6):845-857.
doi: 10.1038/s41587-022-01539-0. Epub 2023 Jan 2.

A proteome-wide atlas of drug mechanism of action

Affiliations

A proteome-wide atlas of drug mechanism of action

Dylan C Mitchell et al. Nat Biotechnol. 2023 Jun.

Abstract

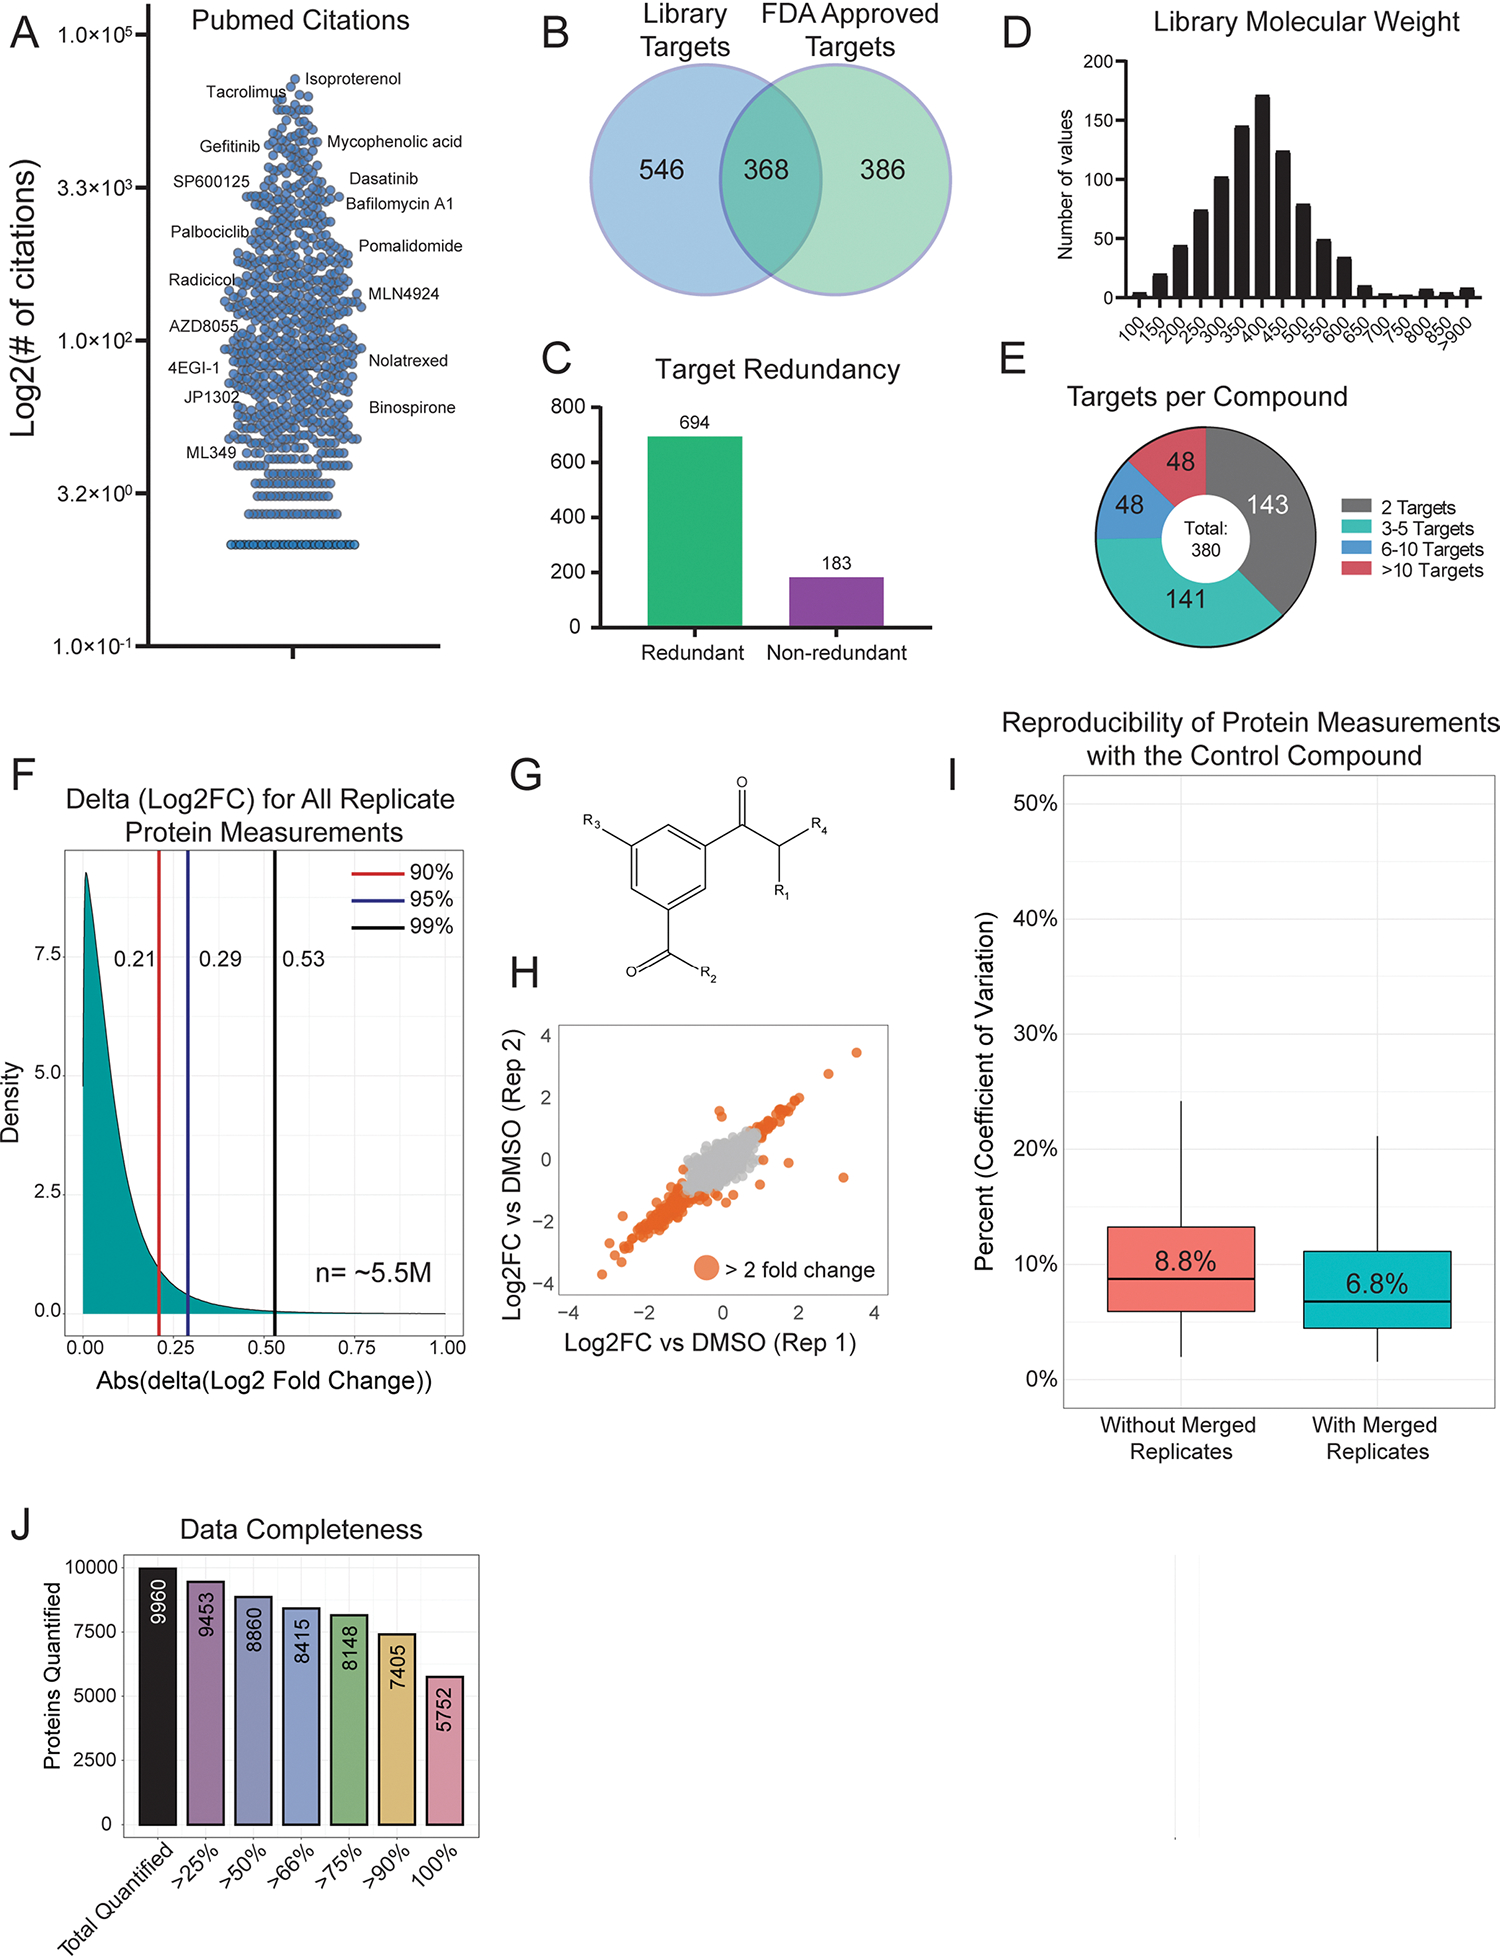
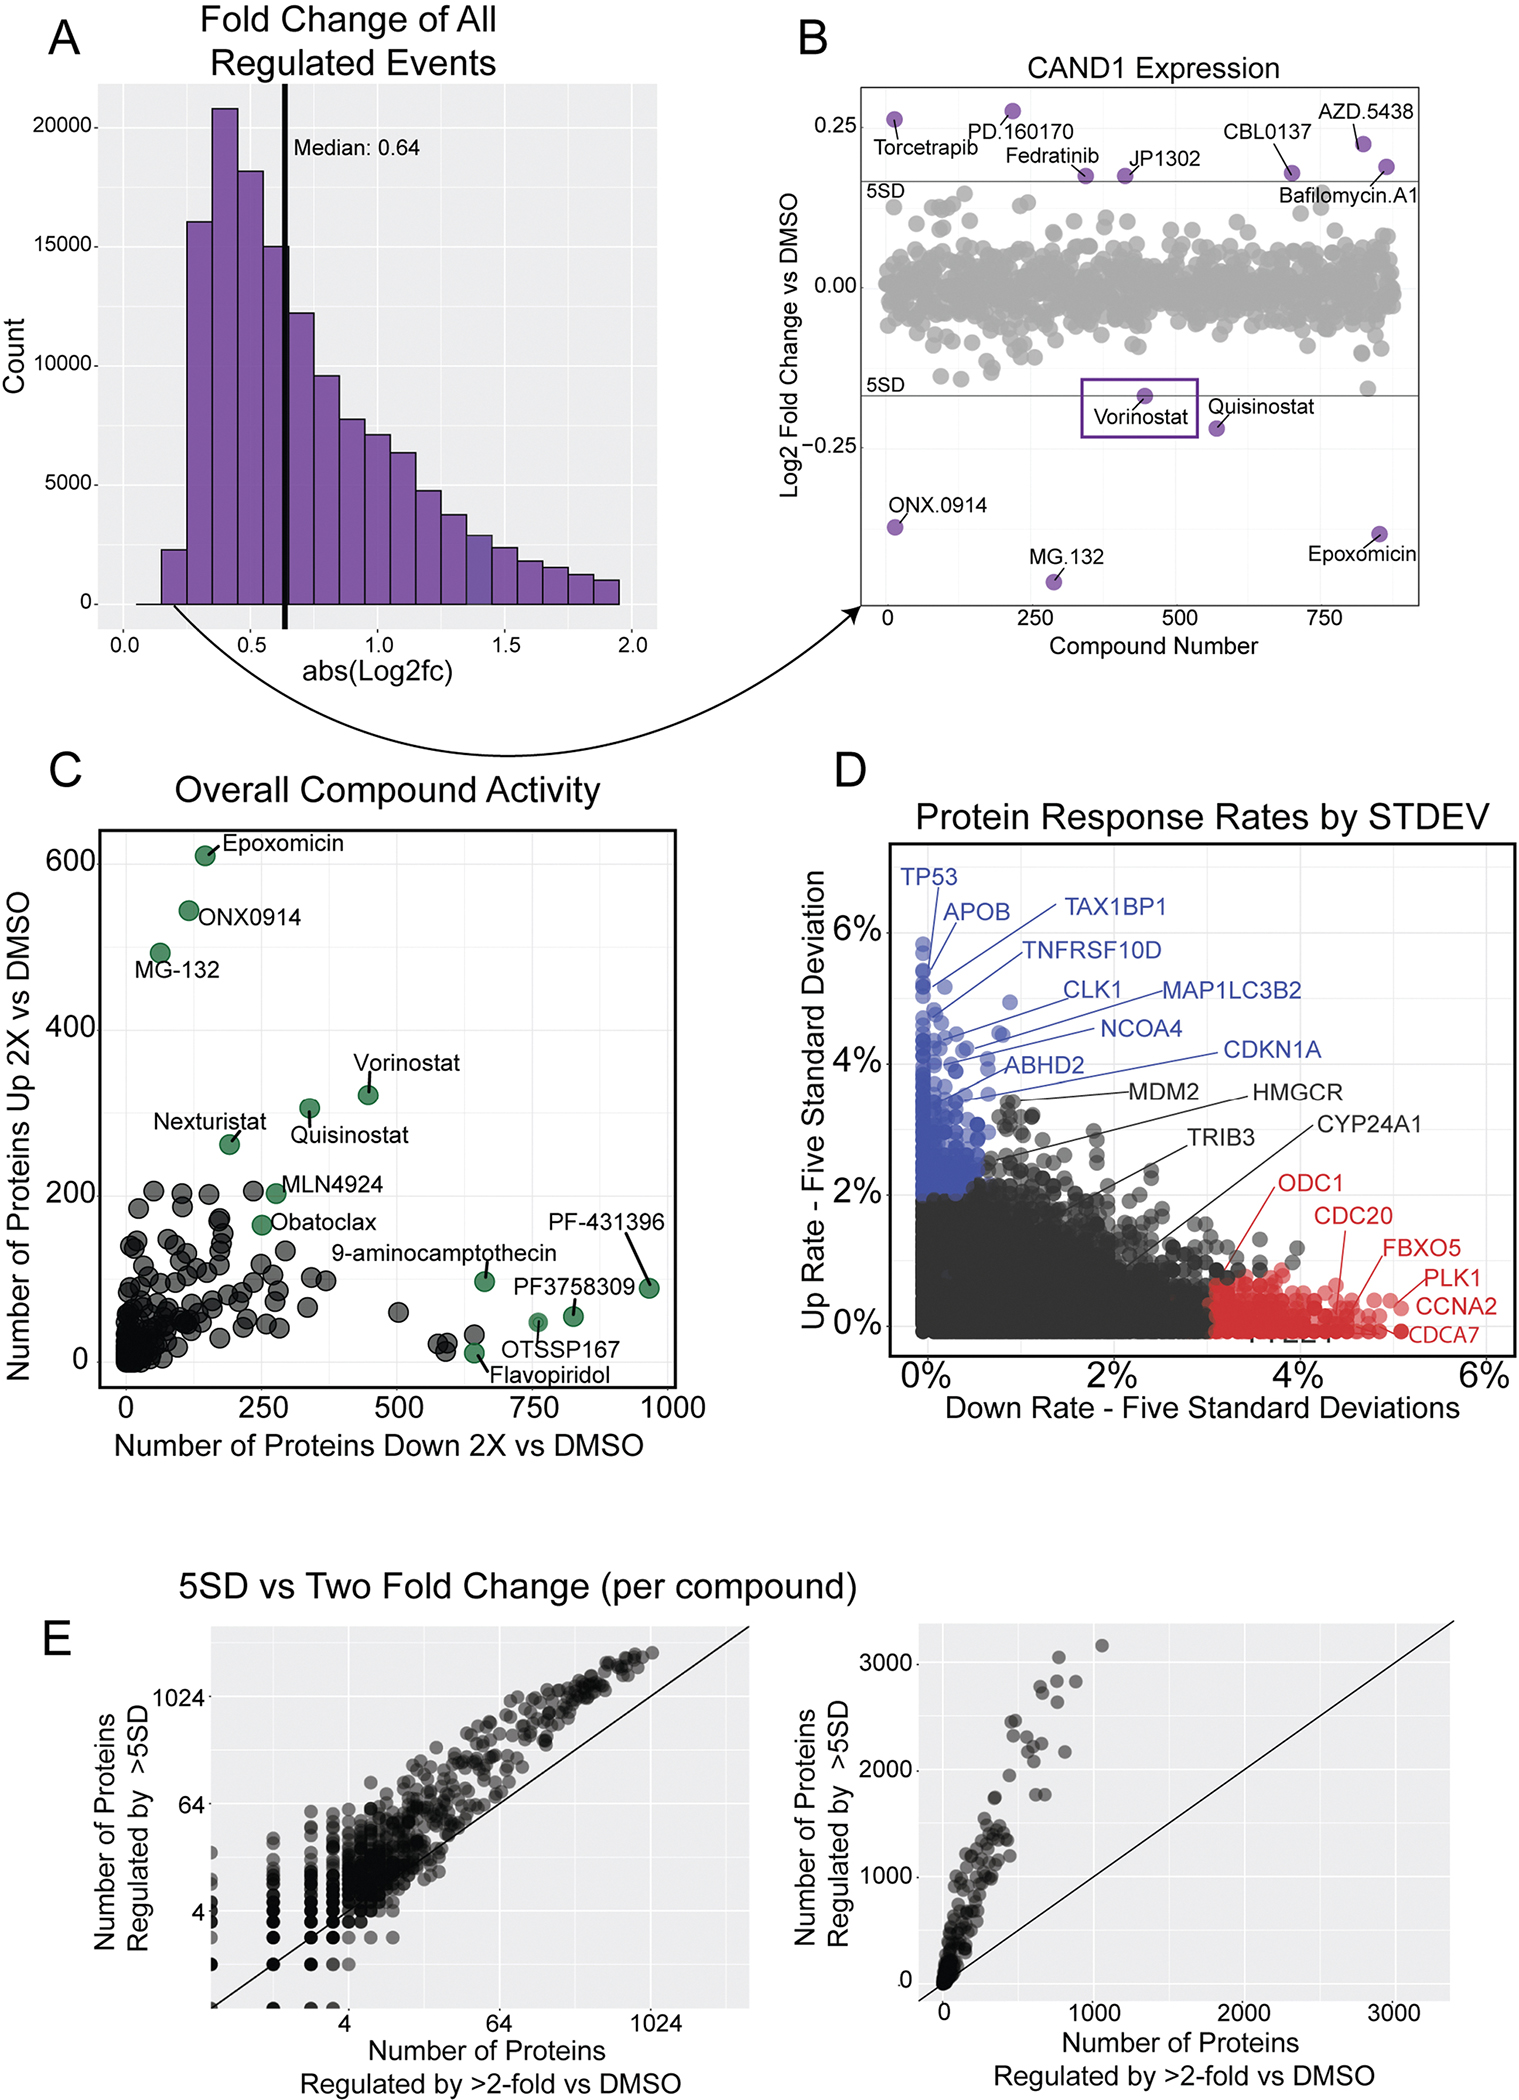
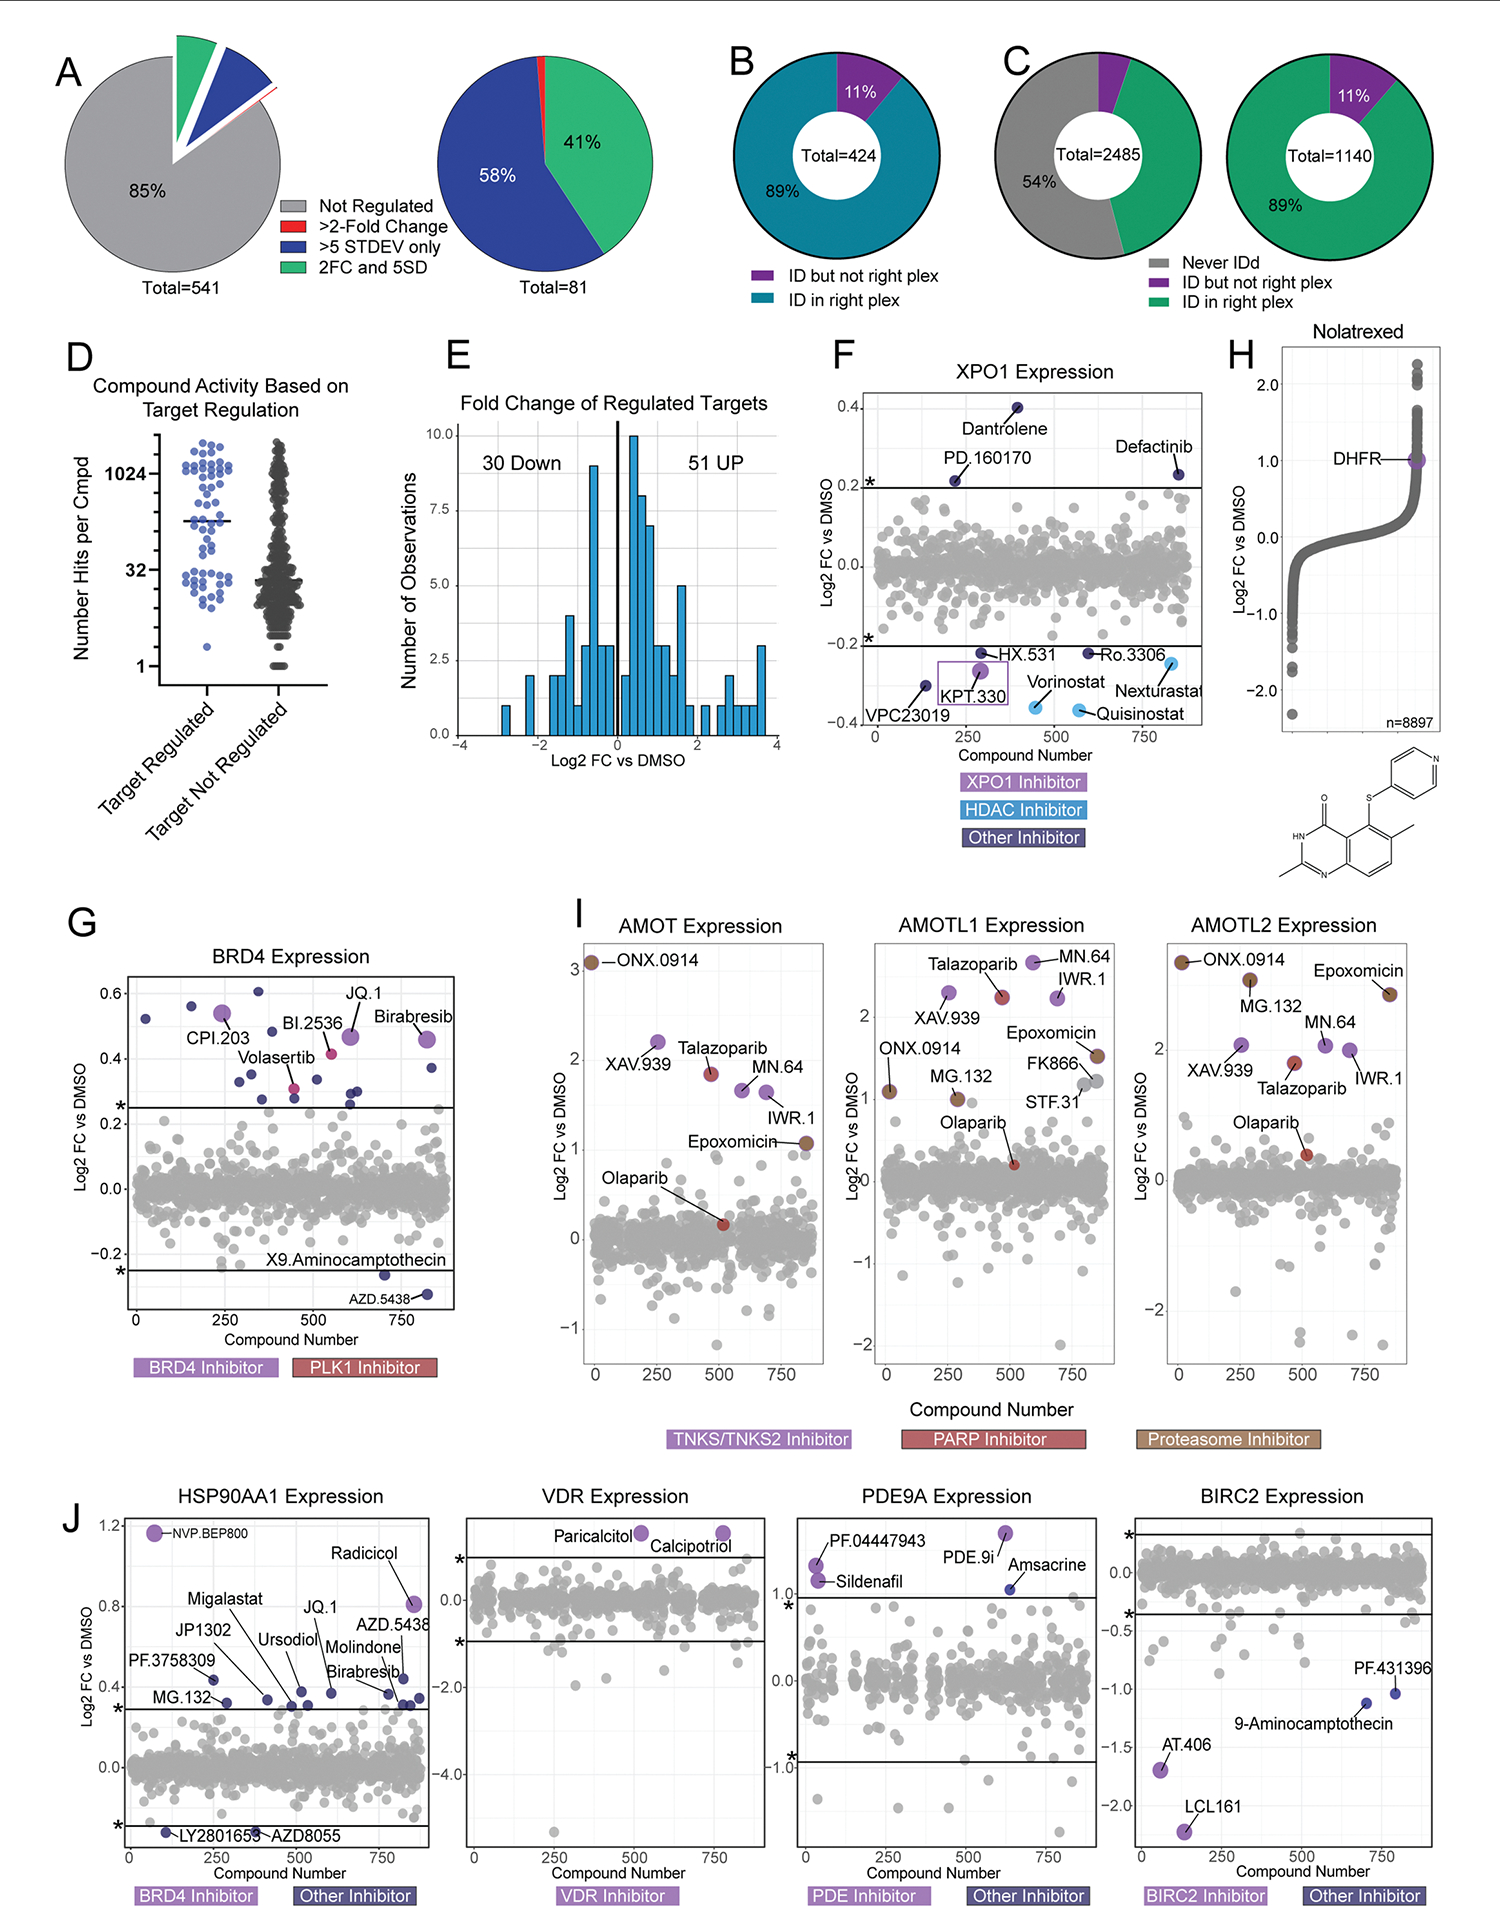
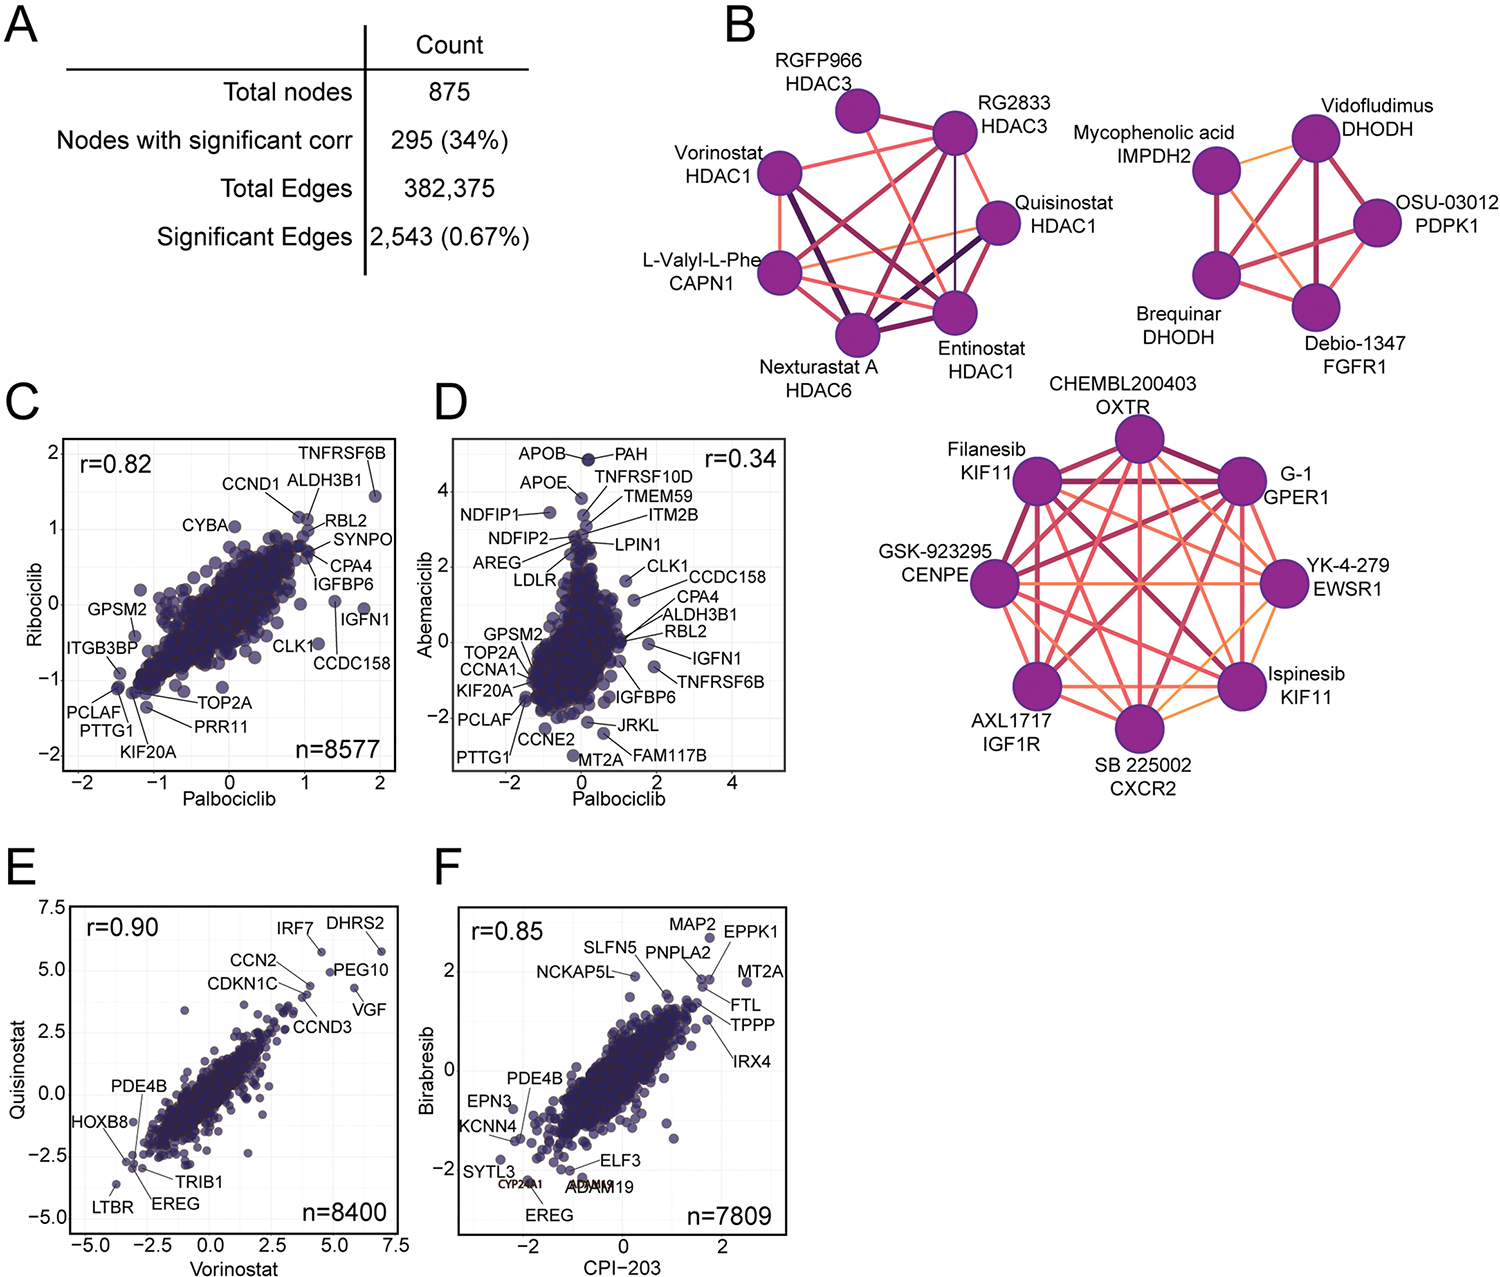
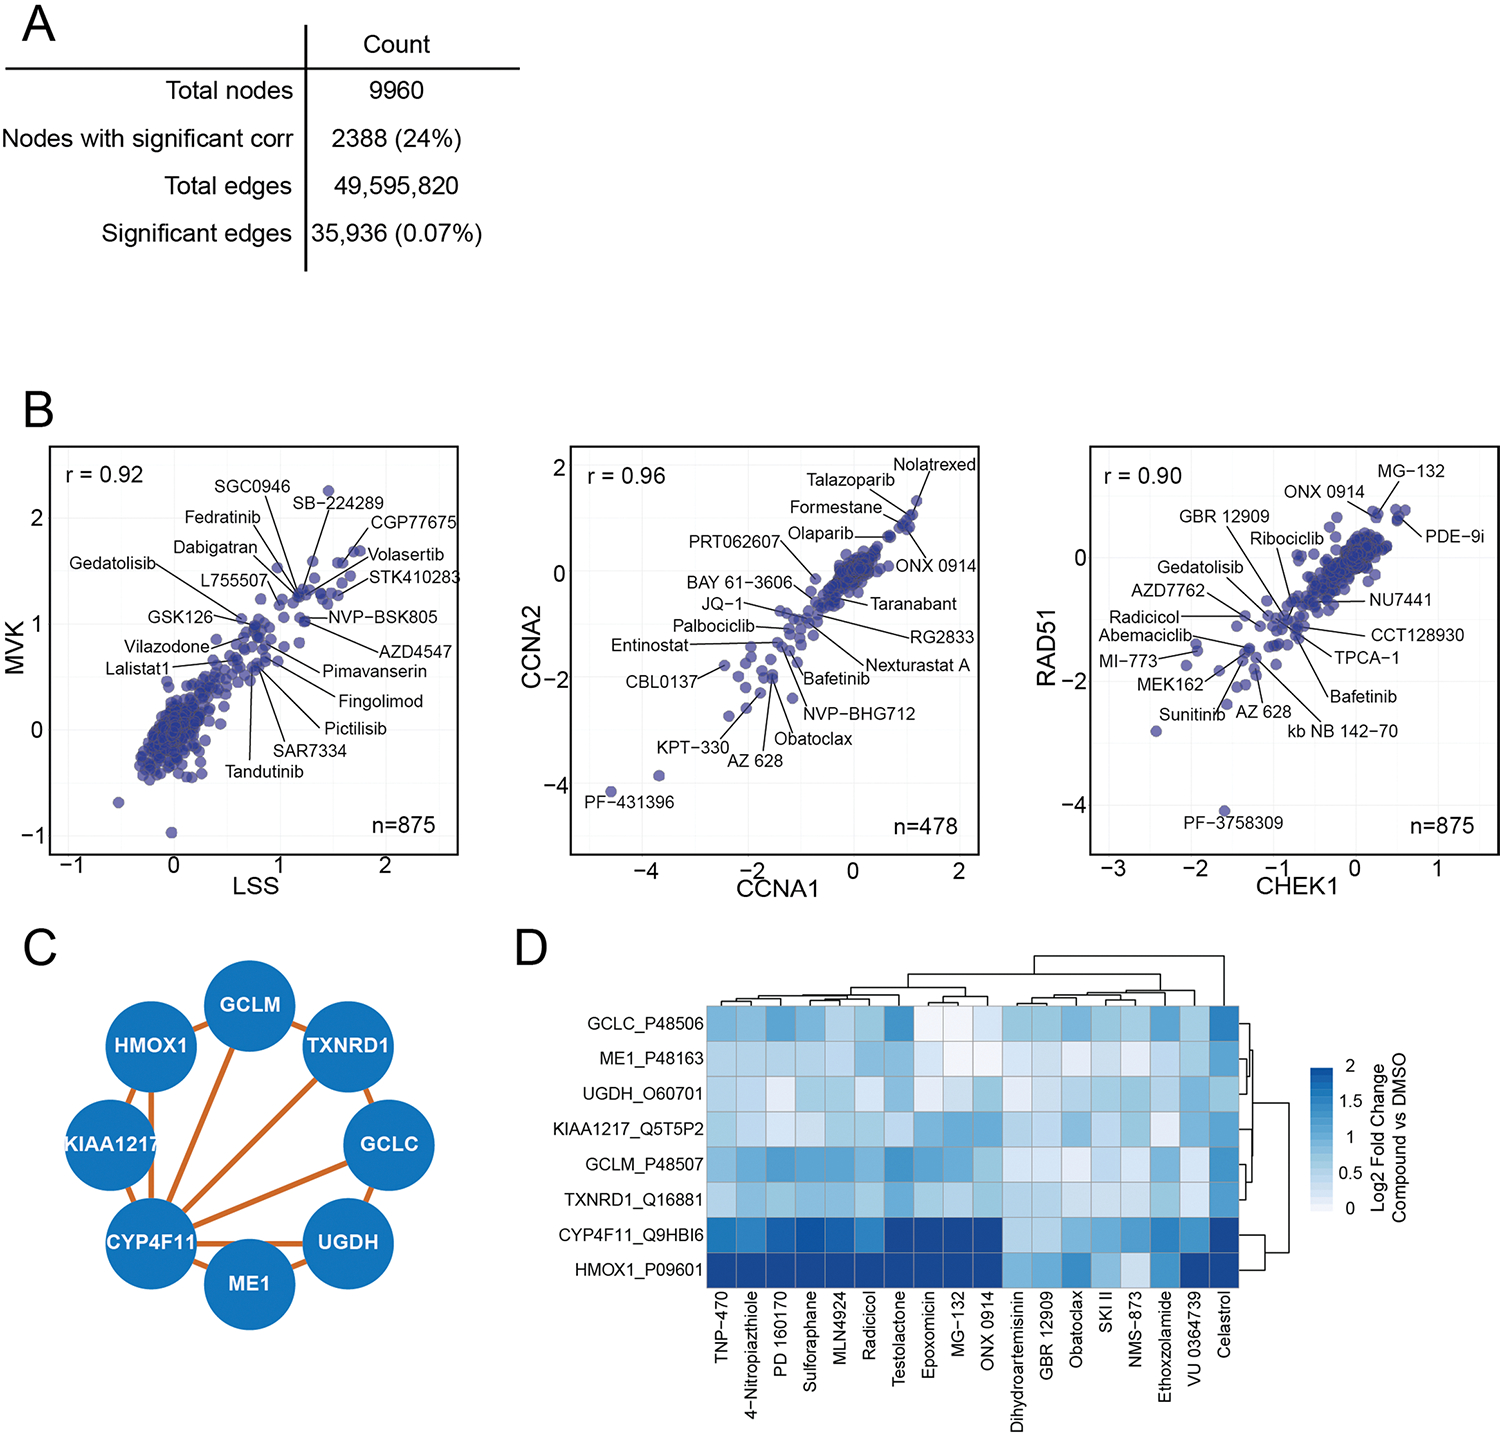
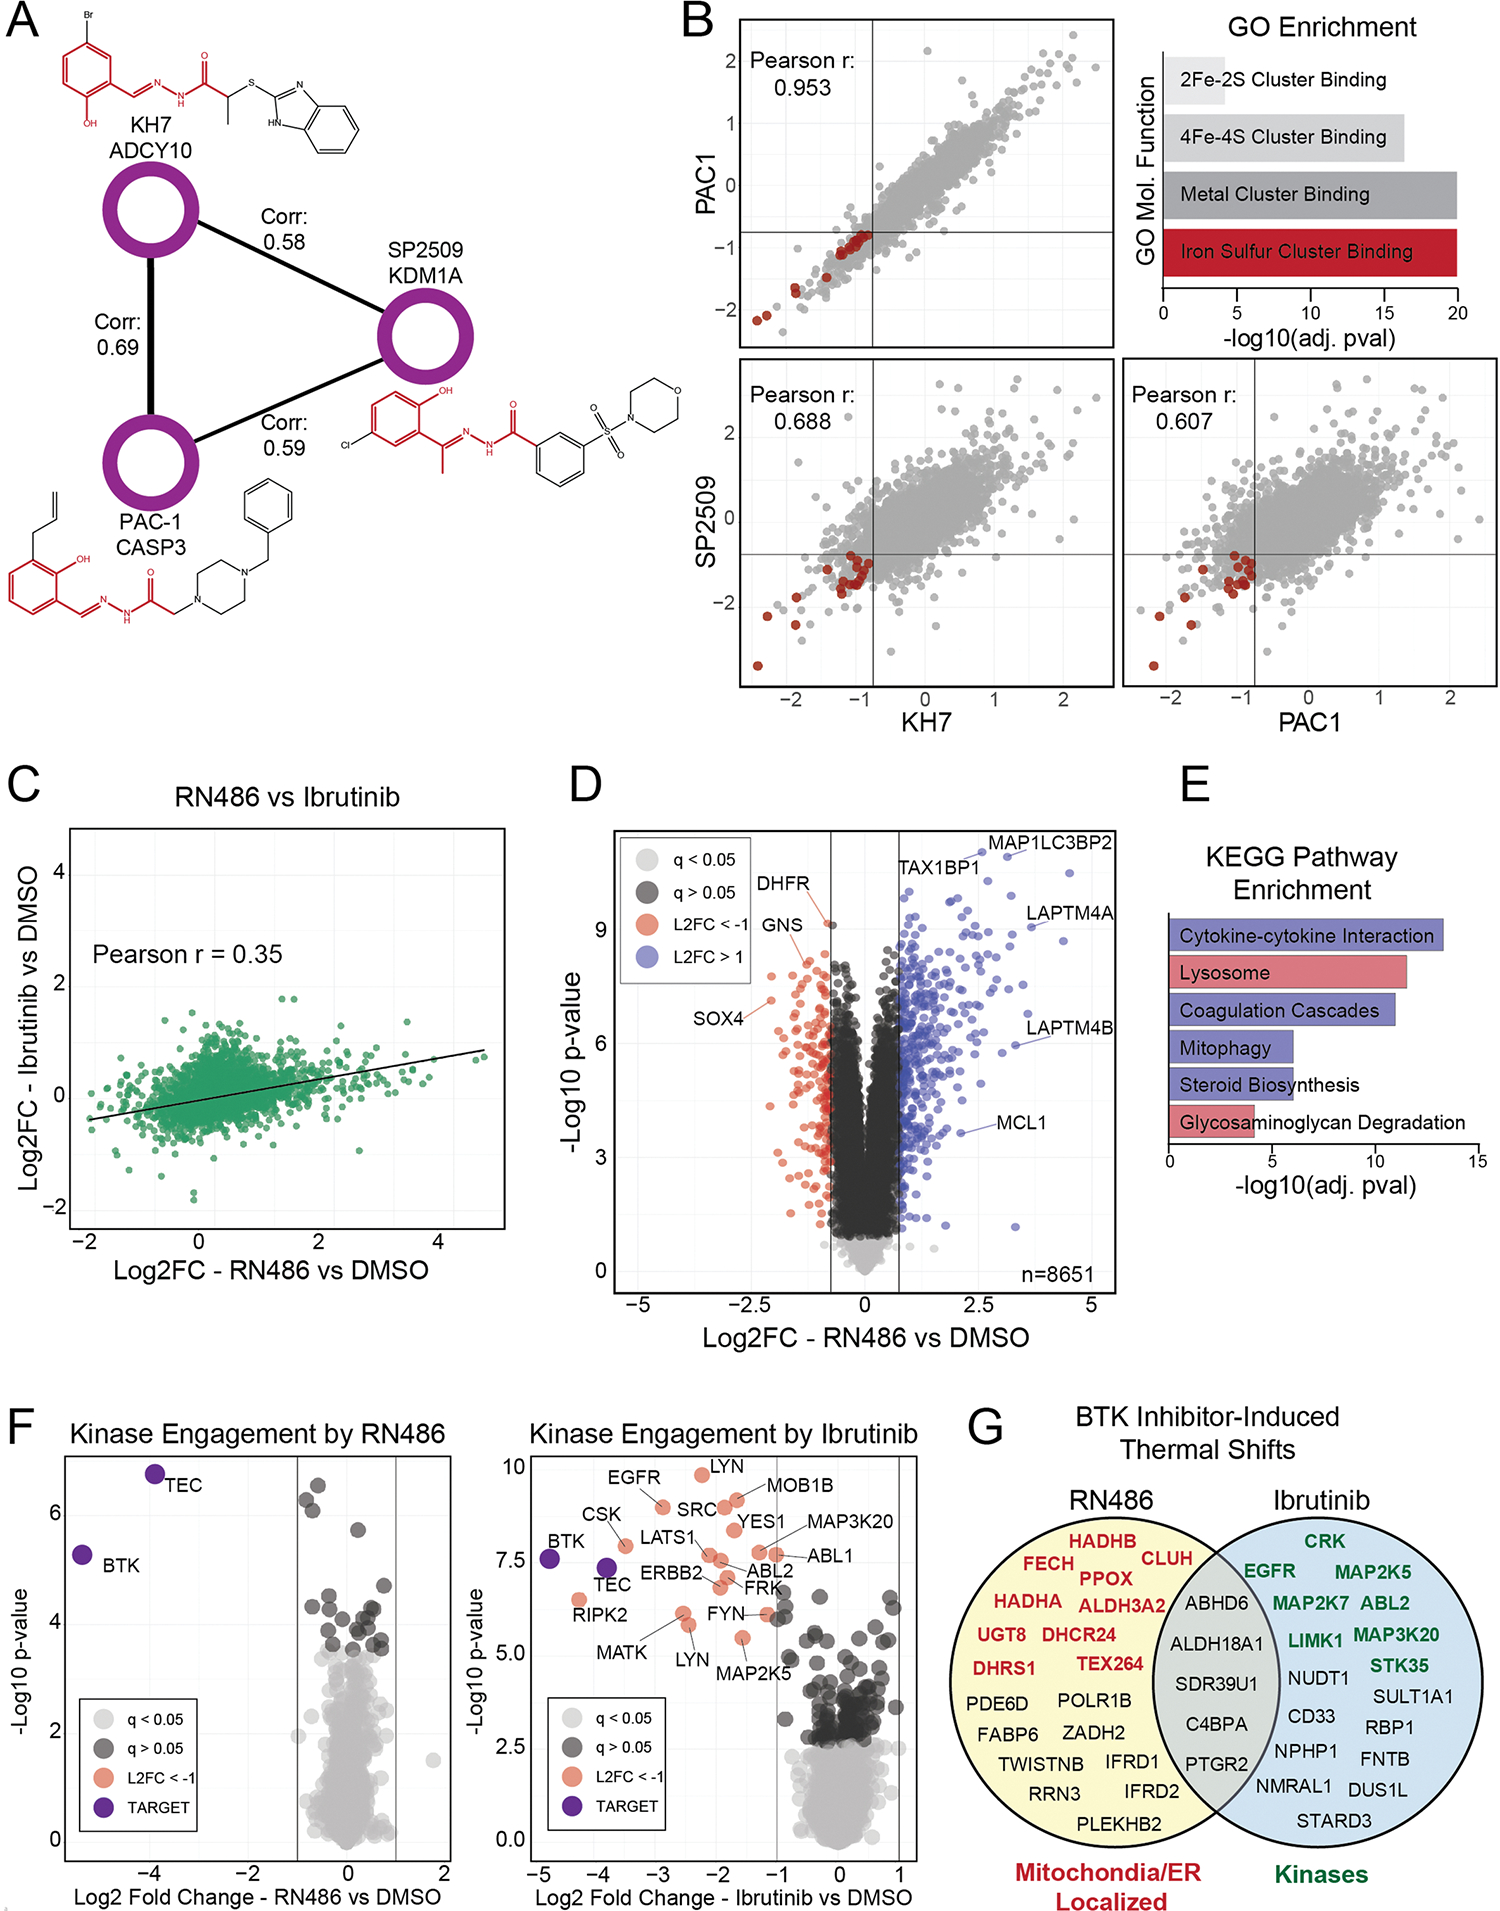
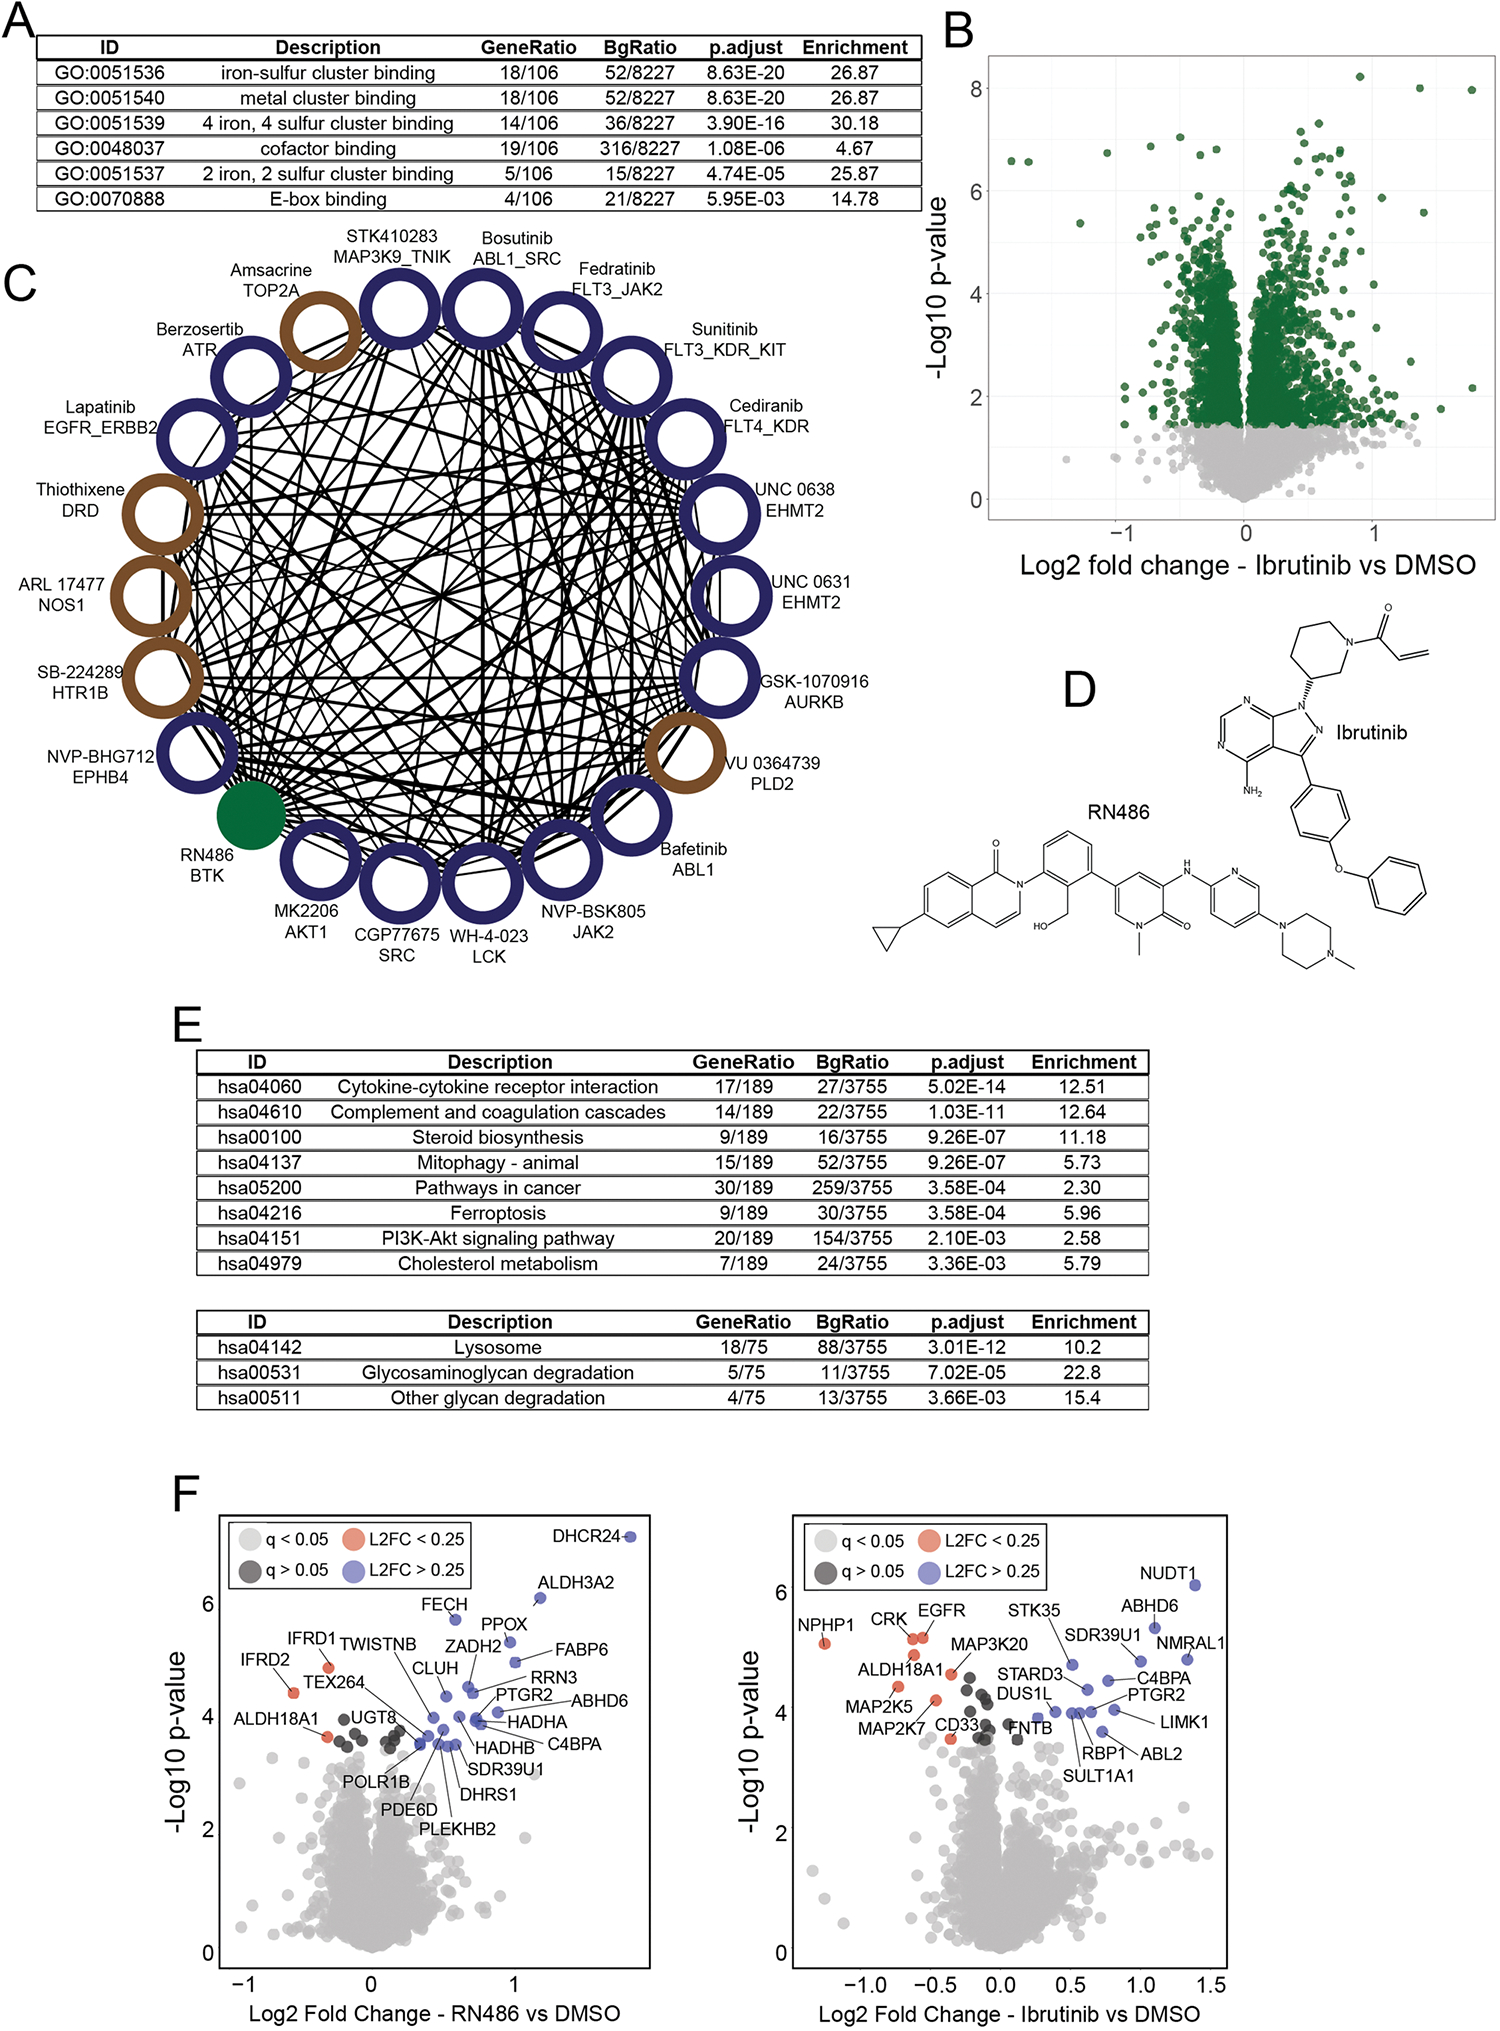
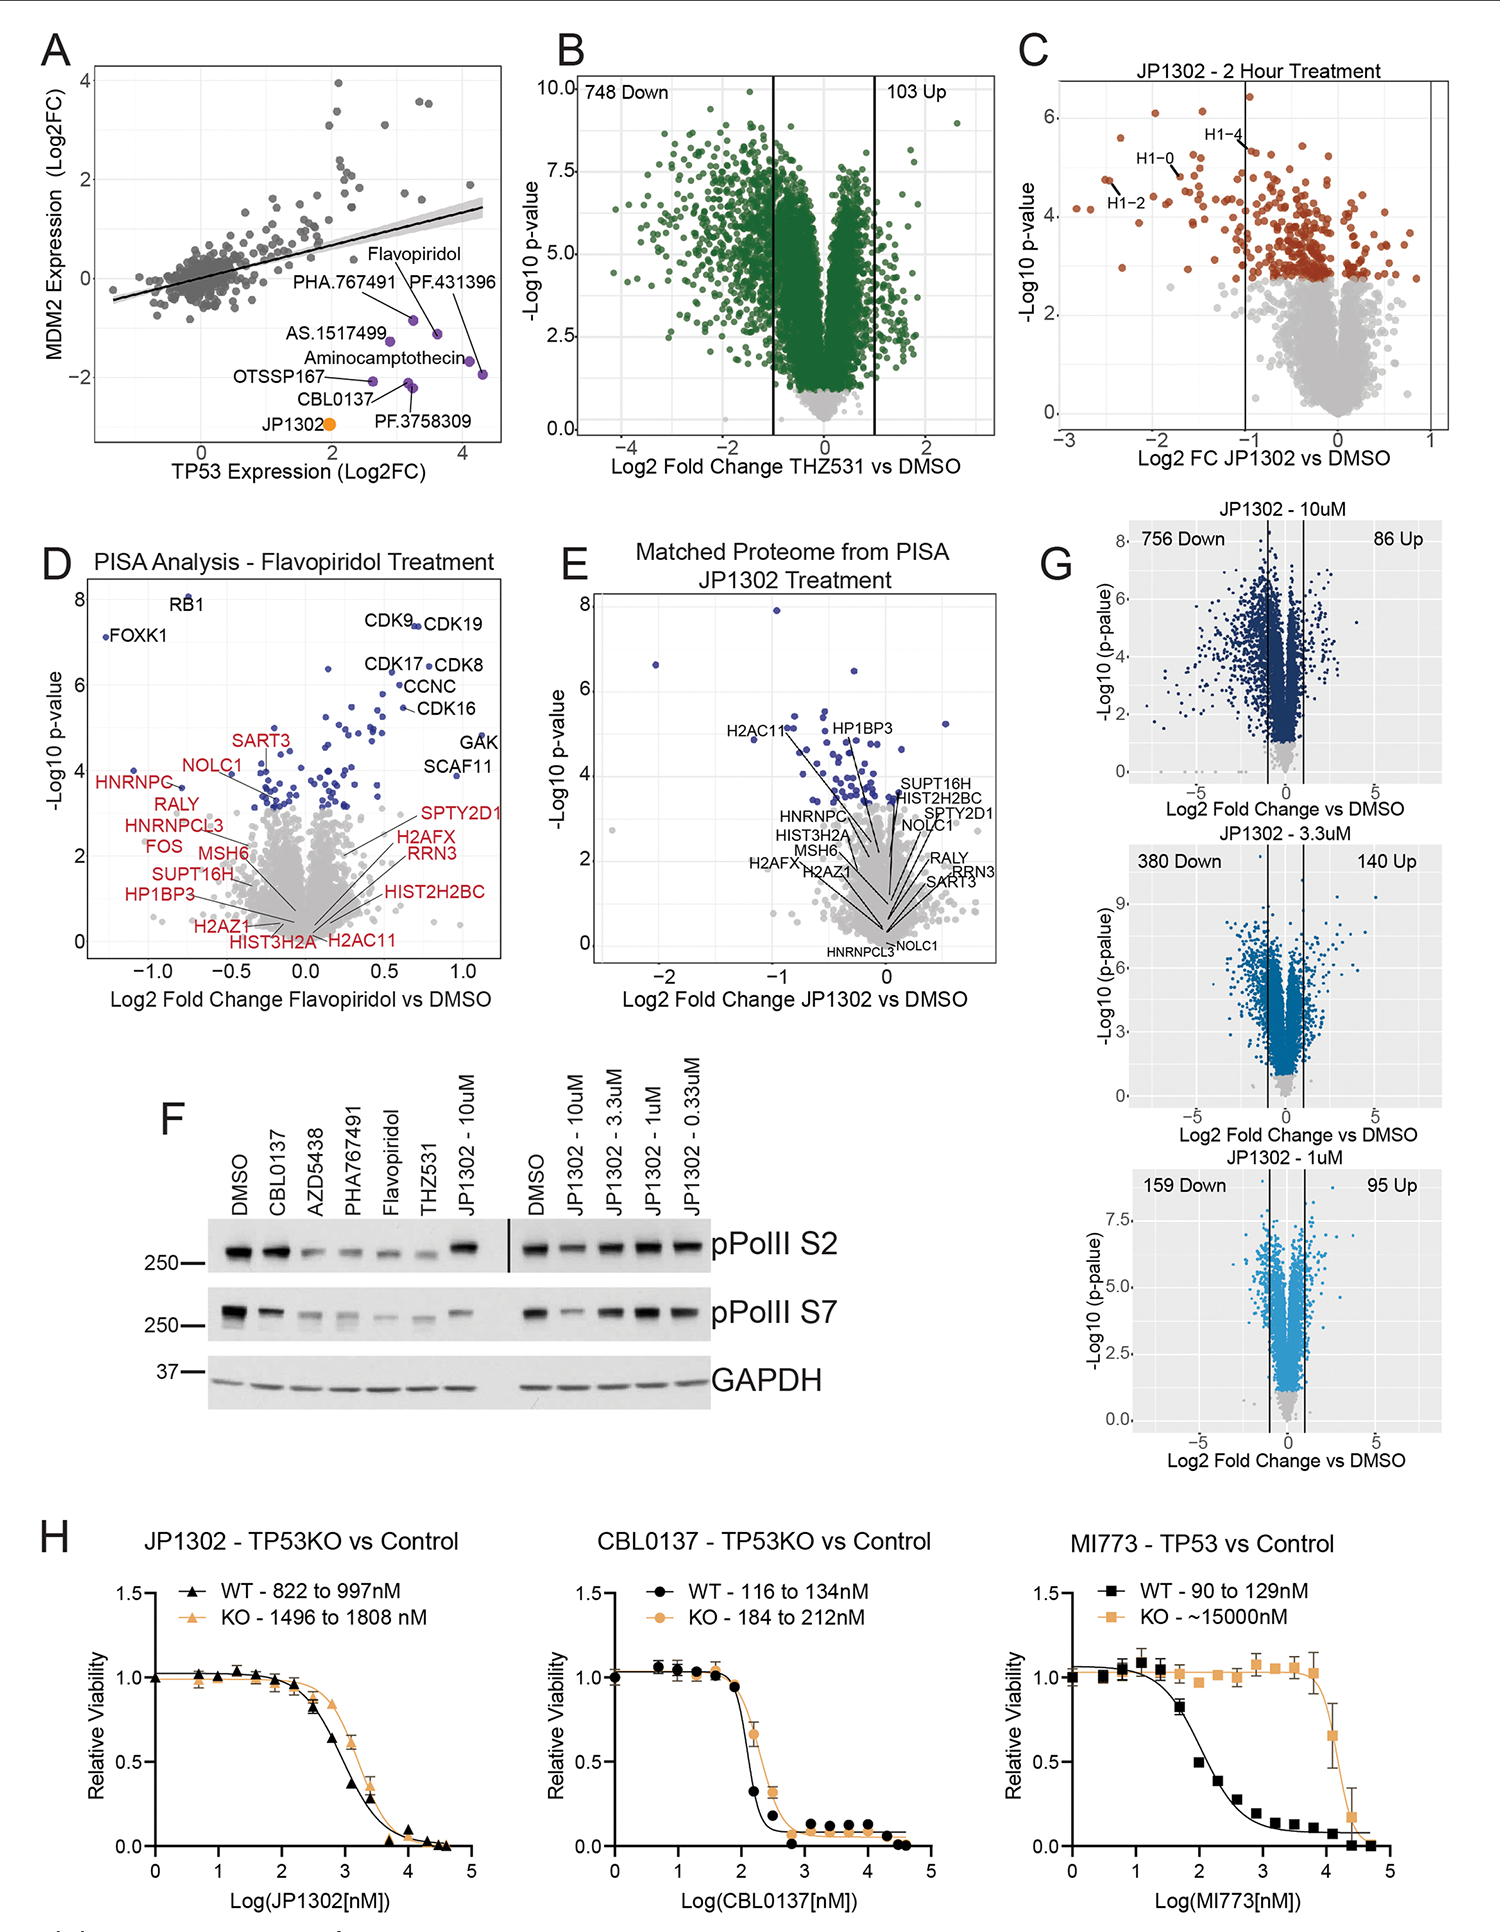
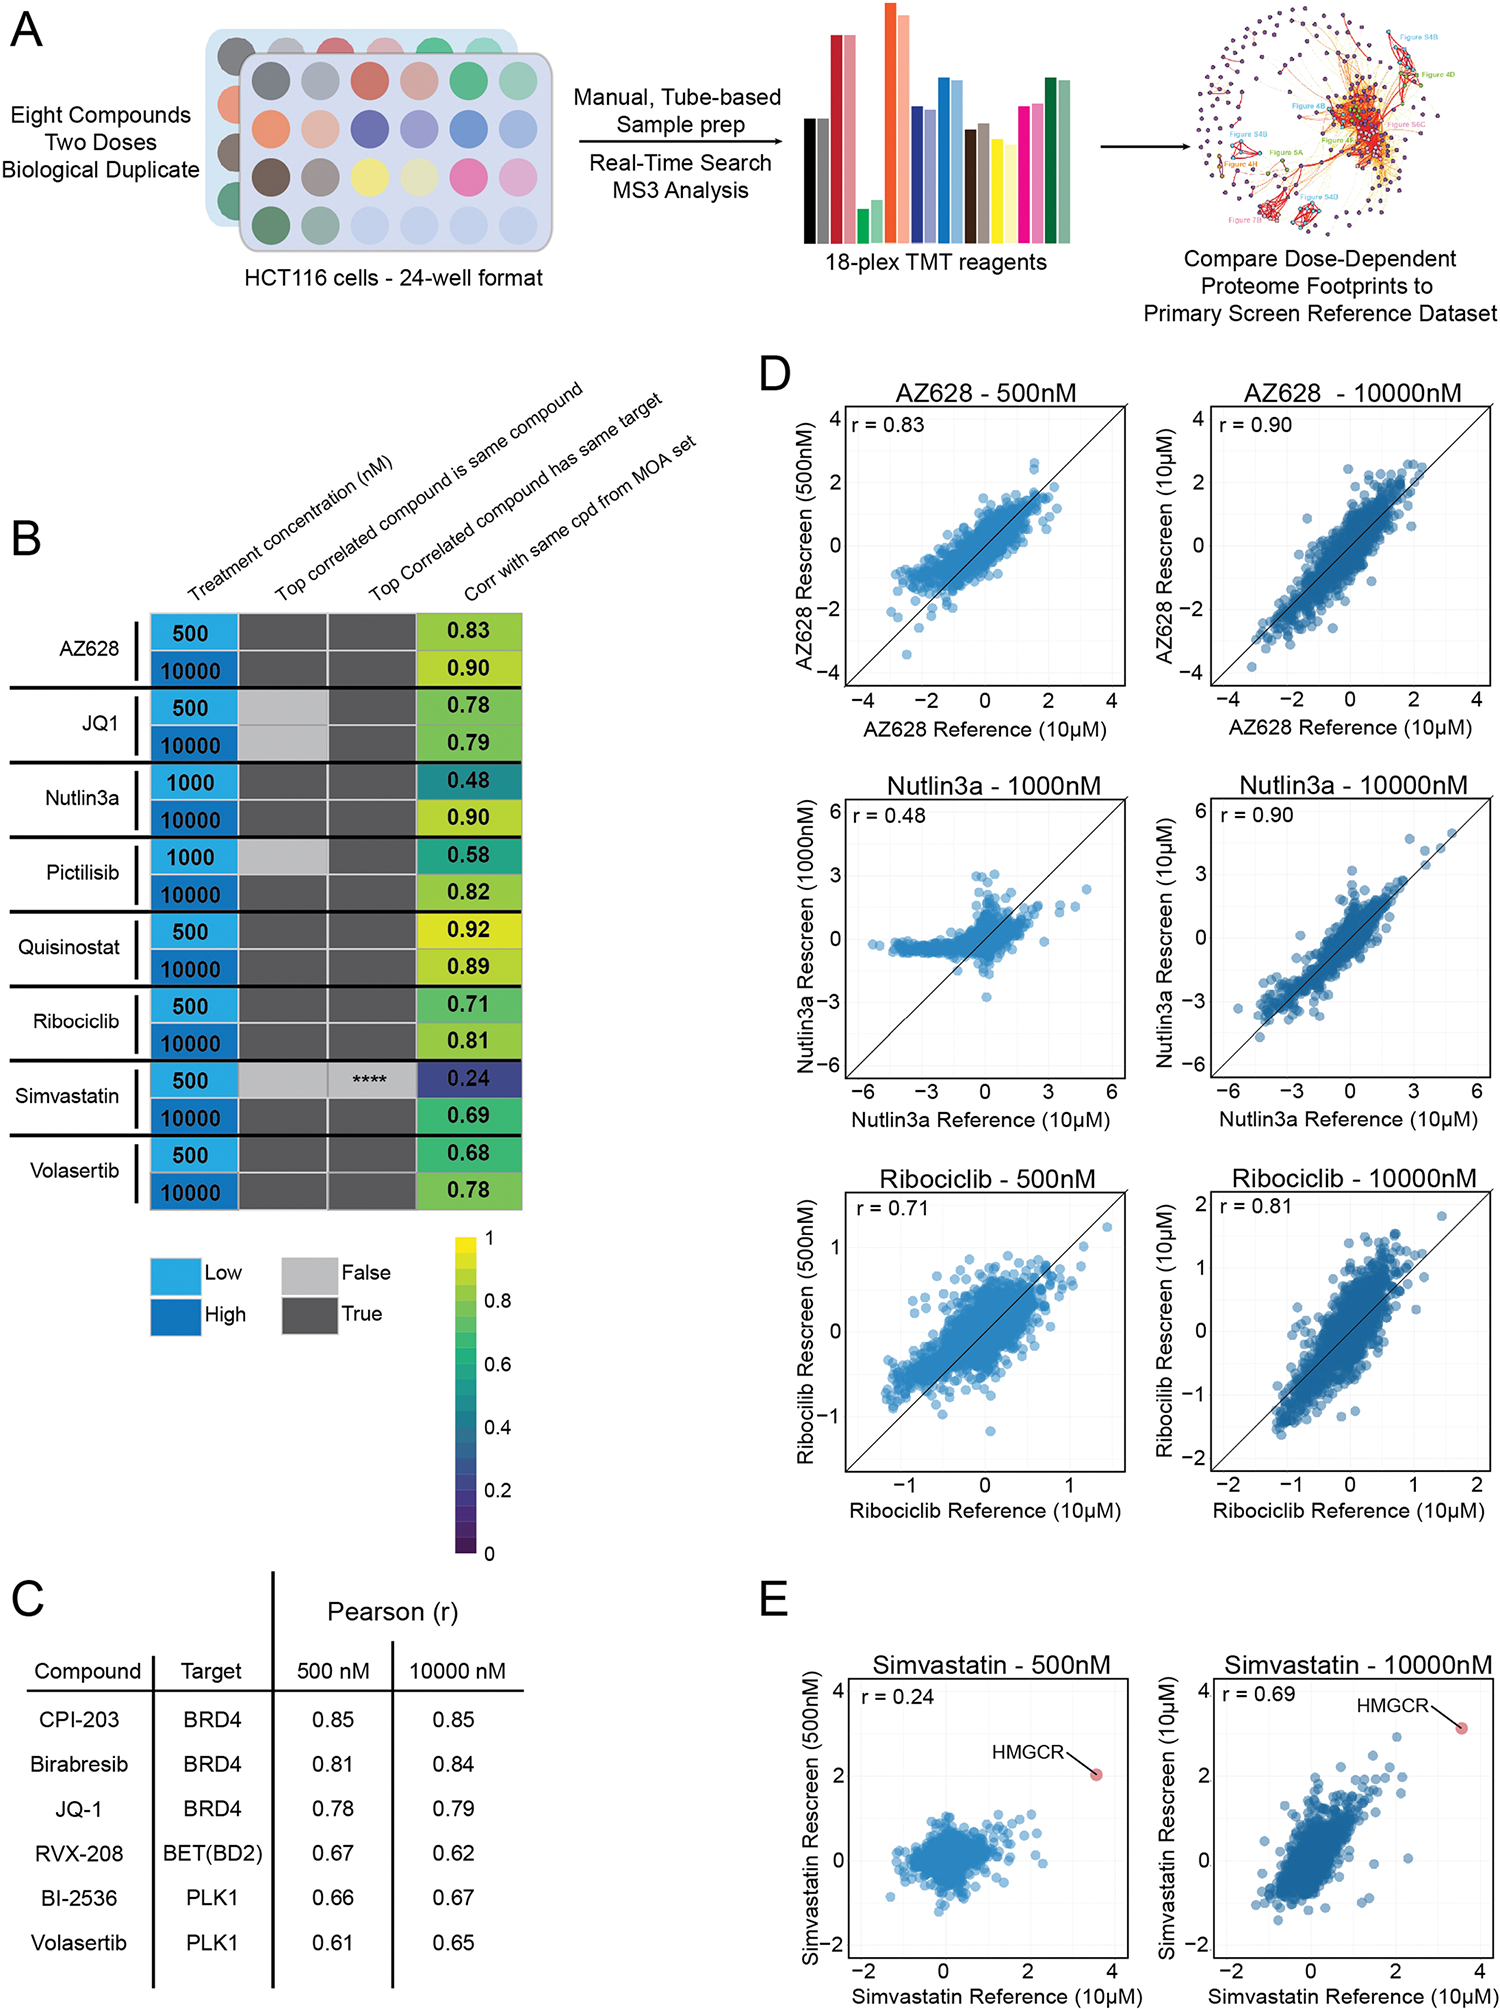
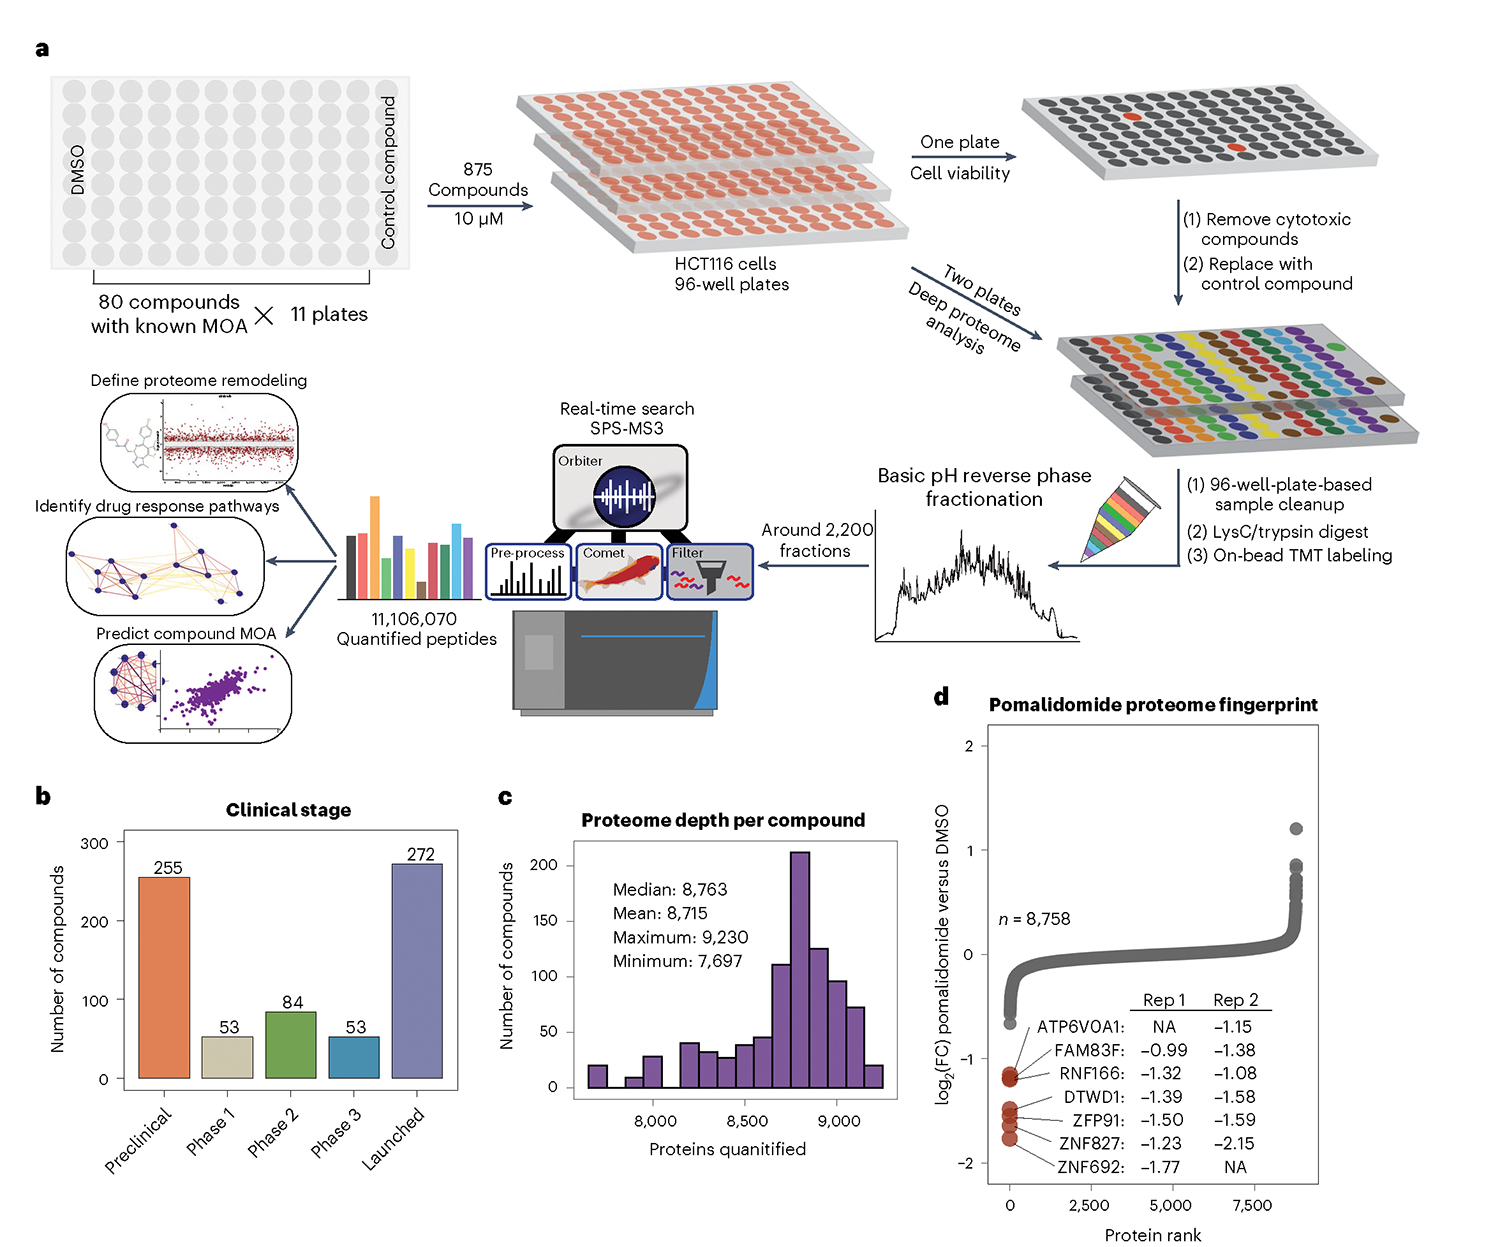
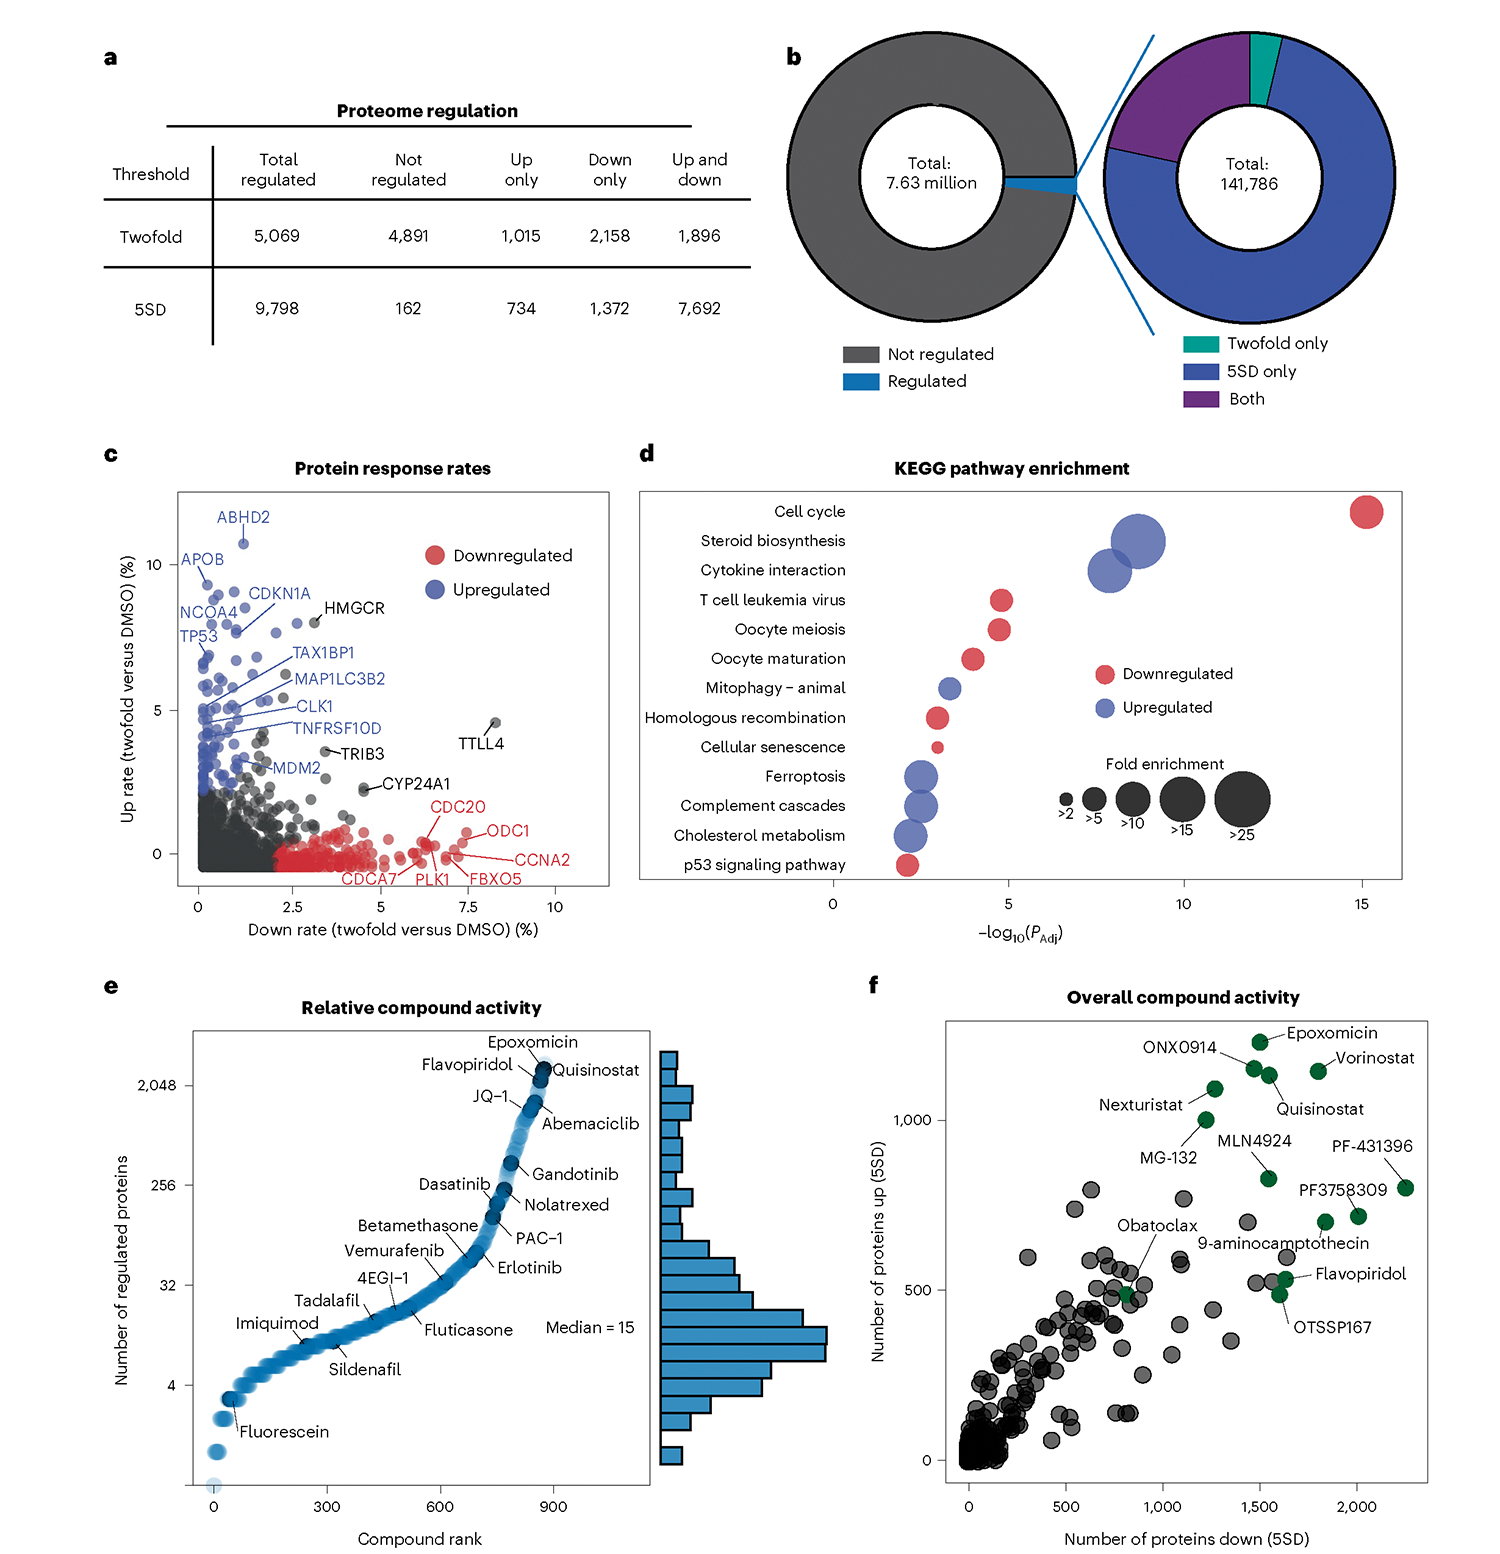
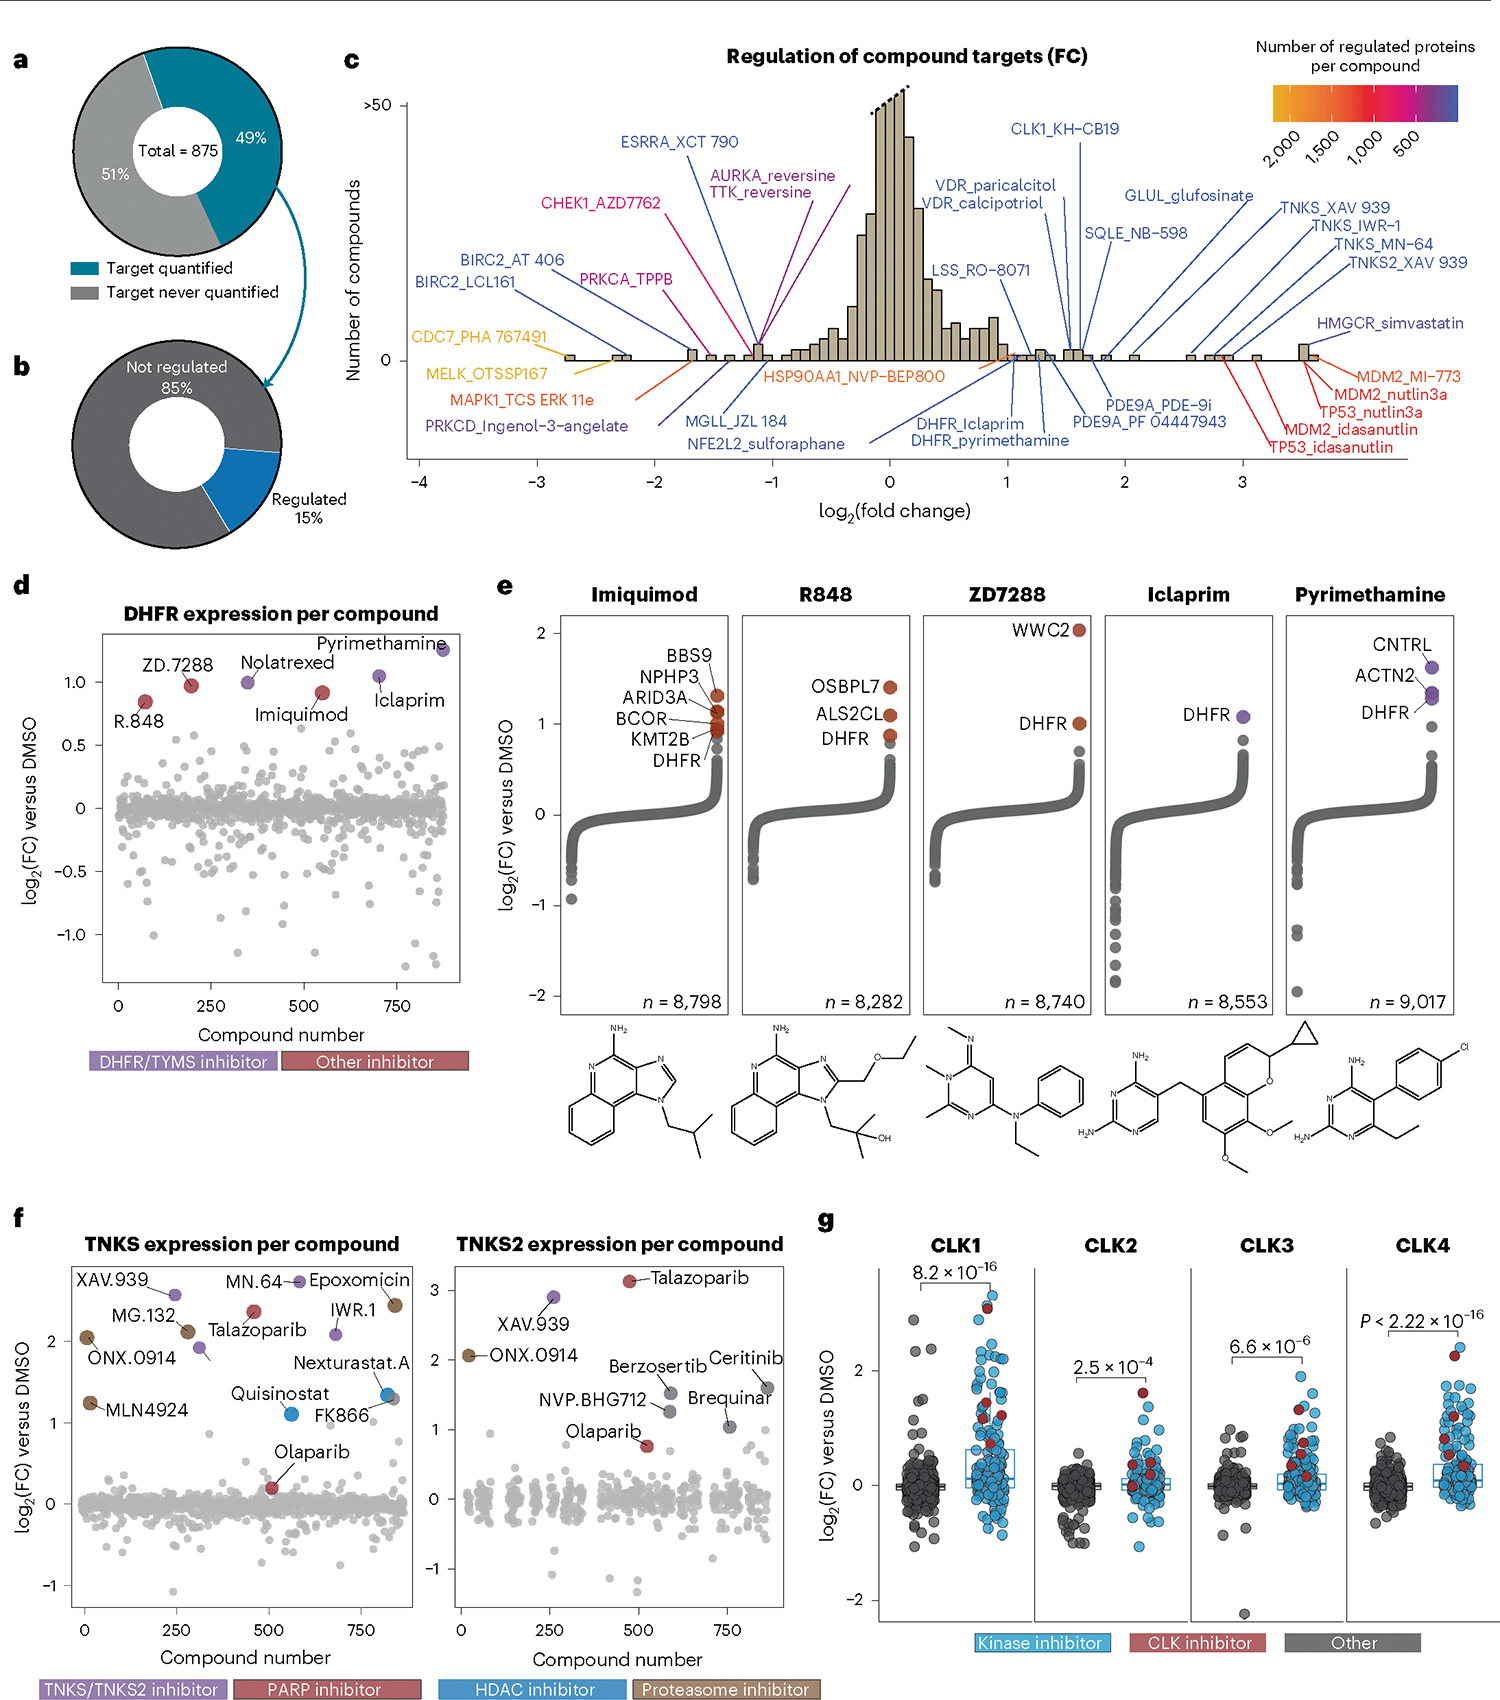
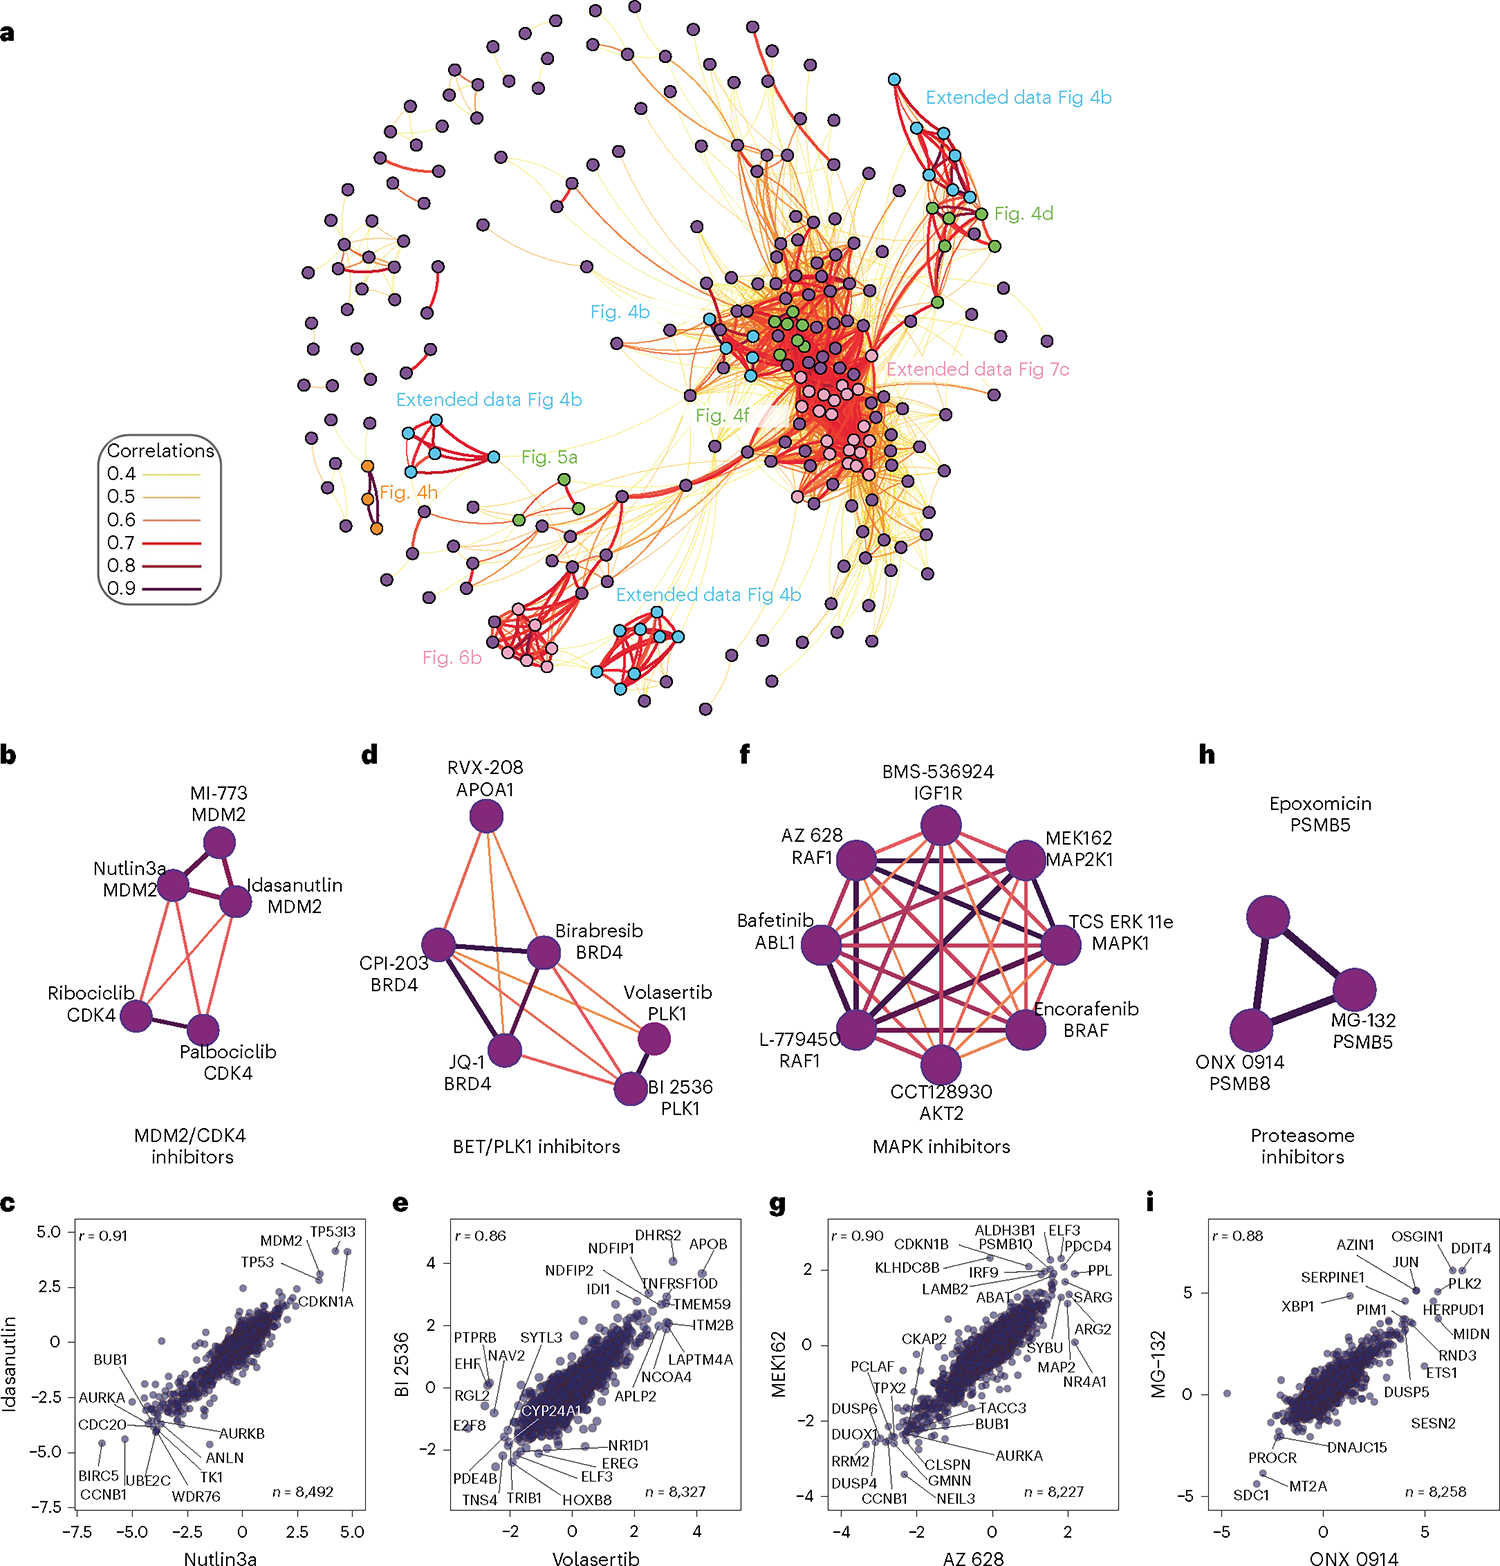
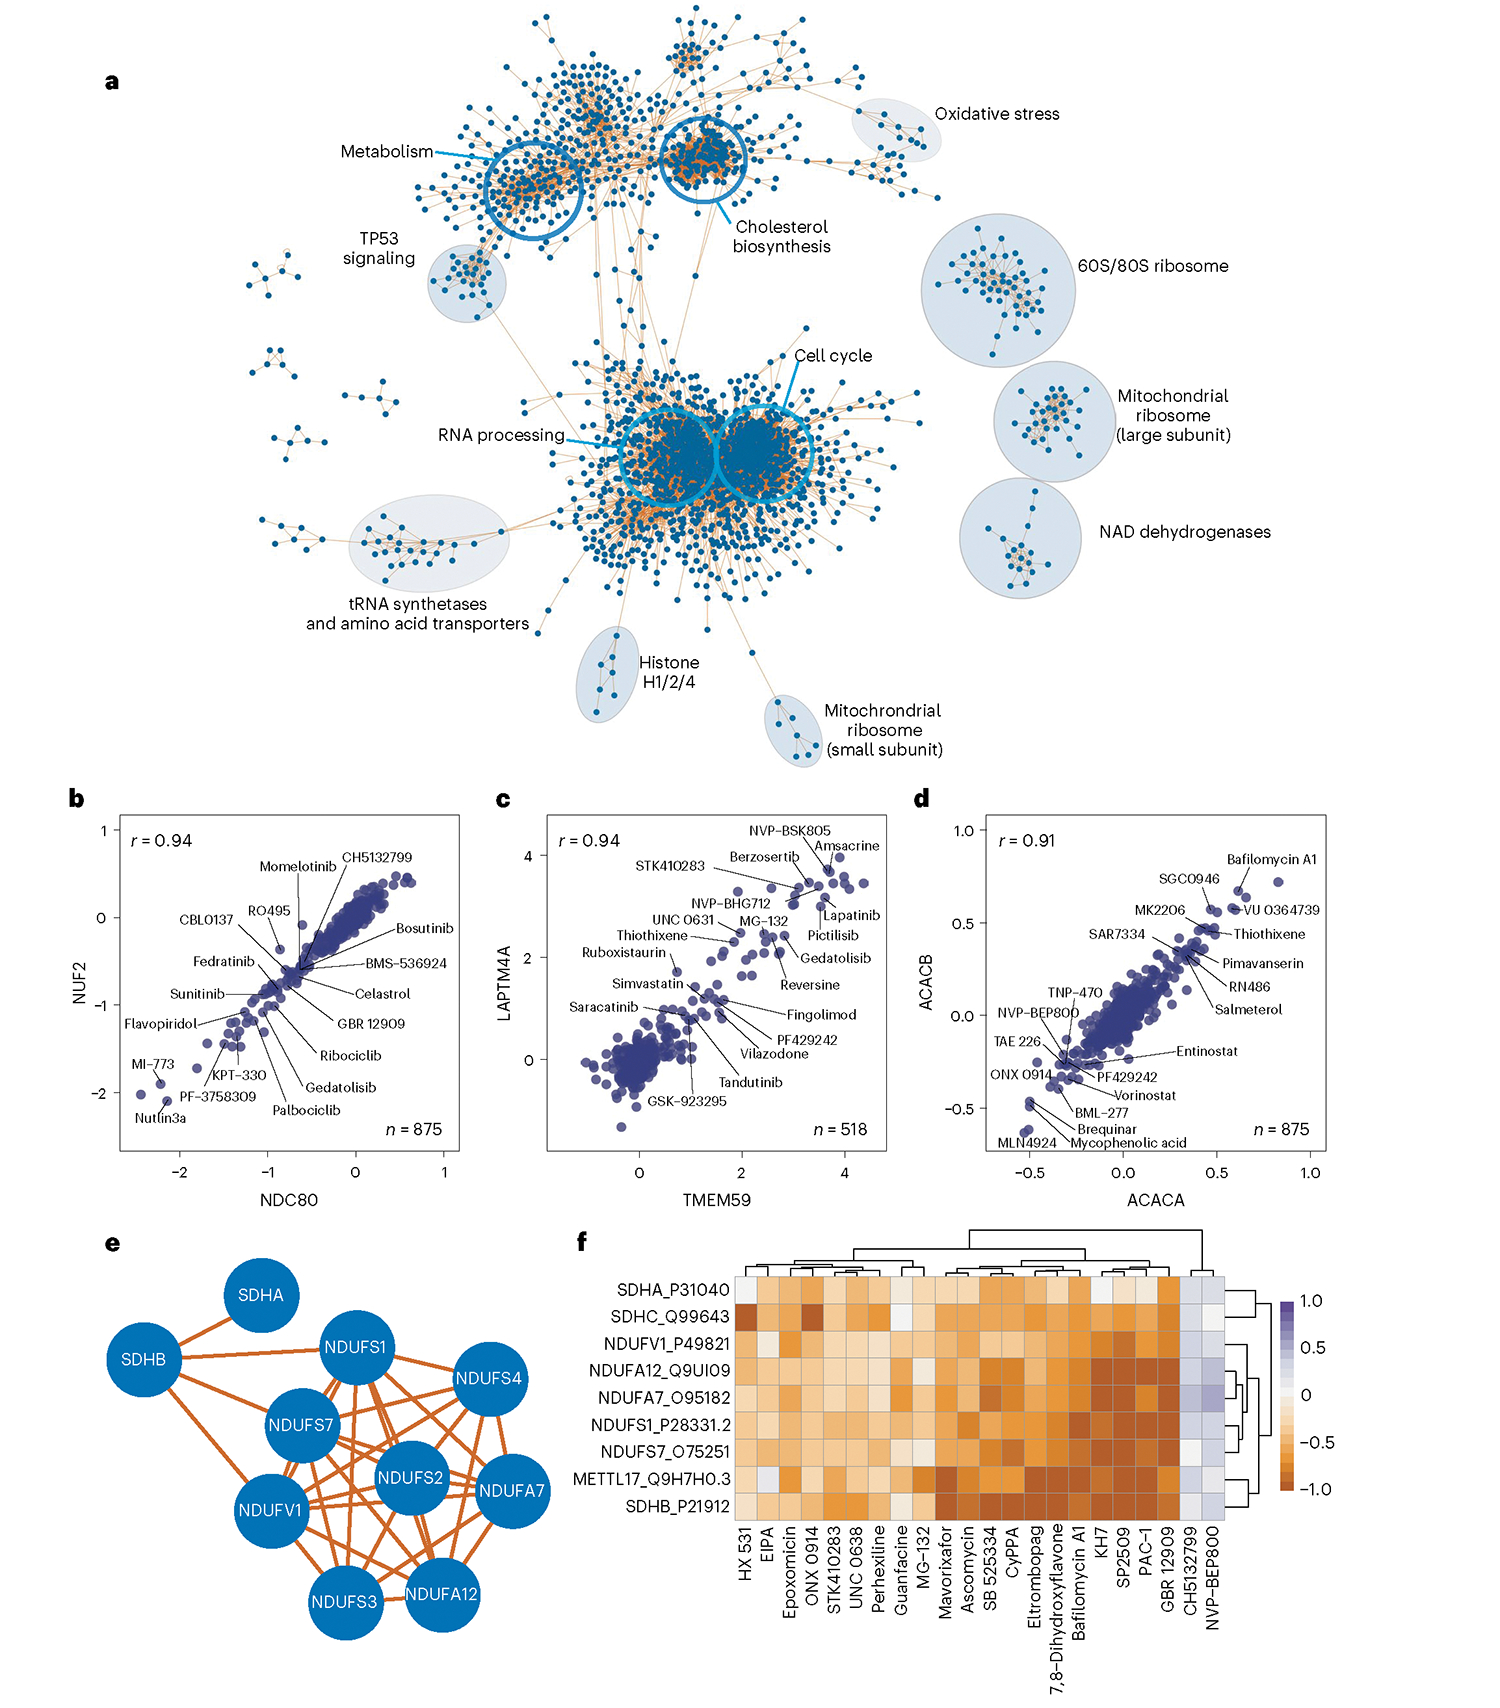
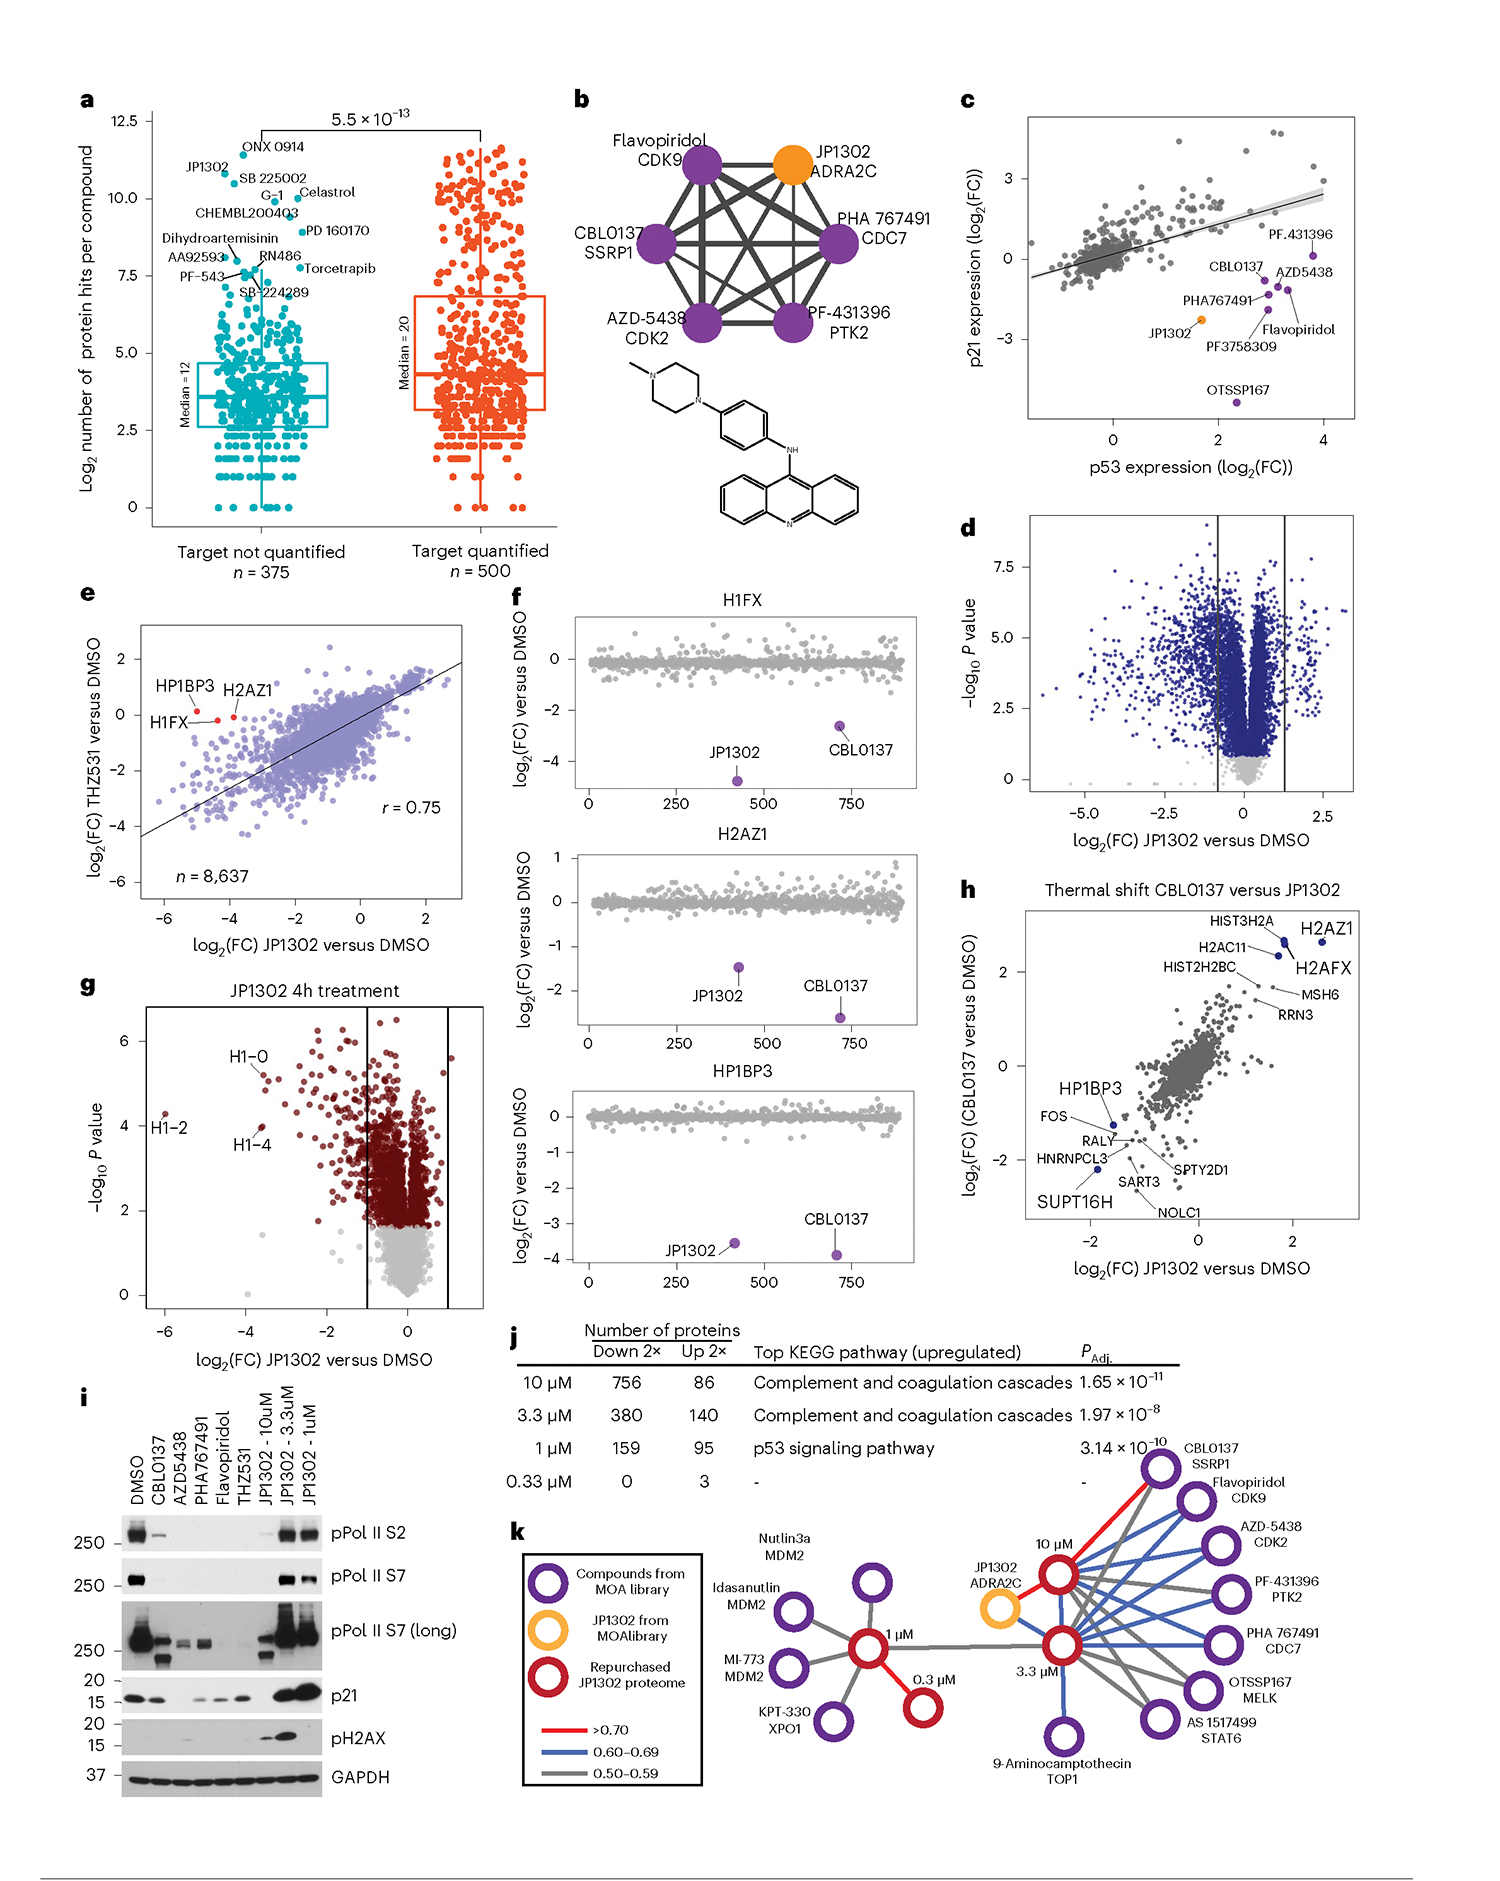
Defining the cellular response to pharmacological agents is critical for understanding the mechanism of action of small molecule perturbagens. Here, we developed a 96-well-plate-based high-throughput screening infrastructure for quantitative proteomics and profiled 875 compounds in a human cancer cell line with near-comprehensive proteome coverage. Examining the 24-h proteome changes revealed ligand-induced changes in protein expression and uncovered rules by which compounds regulate their protein targets while identifying putative dihydrofolate reductase and tankyrase inhibitors. We used protein-protein and compound-compound correlation networks to uncover mechanisms of action for several compounds, including the adrenergic receptor antagonist JP1302, which we show disrupts the FACT complex and degrades histone H1. By profiling many compounds with overlapping targets covering a broad chemical space, we linked compound structure to mechanisms of action and highlighted off-target polypharmacology for molecules within the library.


Conflict of interest statement

Competing interests

S.P.G. is an advisory board member for Cell Signaling Technology, ThermoFisher Scientific, Cedilla Therapeutics, Casma Therapeutics and Frontier Medicines. The remaining authors declare no competing interests.

Figures

Extended Data Fig. 1 |
Extended Data Fig. 1 |. Details on the MOA library and measurement reproducibility.
(a) Number of PubMed citations per library compound, with select examples shown. (b) Overlap of all annotated targets from the MOA library and all targets with an FDA approved drug. The list of FDA approved drug targets was acquired from The Human Protein Atlas (proteinatlas.org) (c) Target redundancy for compounds in the library. 694 compounds are annotated to target a protein that is also targeted by another compound. 183 compounds target proteins that are unique among the library. All annotated targets were considered. (d) Distribution of compound molecular weight across the MOA library. (e) A breakdown of the number of annotated targets per compound. 495 compounds have one annotated target. (f) Distribution of the absolute difference between replicate protein measurements. The difference between Log2 fold change (compound versus DMSO) measurements was compared for the same protein treated with the same compound. The ~5.5 million Log2FC differences between biological replicate 1 and biological replicate 2 represents ~11 million total protein measurements. (g) Basic structure of the control compound included 55 times across all 170 TMT groups. (h) Representative plot comparing the Log2 FC values for two replicates of the control compound. The median Pearson correlation (r) for two replicates of the control compound was 0.87, which is the correlation of the two replicates shown. (i) Percent coefficient of variation (CV) protein level fold-change measurements across all 55 biological replicates (red). After merging/averaging two biological replicates (coming from the same 96-well plate position, as is the case for other compound replicates), the Percent CV was recalculated (blue). The center line represents the median, the upper and lower bounds of the box indicate the interquartile range (IQR, the range between the 25th and 75th percentiles), and whiskers extend to the highest and lowest values within 1.5 times the IQR. (j) Bar graph showing dataset completeness. For example, 8,860 proteins were quantified in at least half (438) of the compound treatments.
Extended Data Fig. 2 |
Extended Data Fig. 2 |. Illustration of five standard deviations as a suitable threshold for regulated events.
(a) Histogram of absolute value Log2 fold change for all regulated events (5 standard deviations or two fold change–n = 141,786). The histogram is truncated at abs(L2FC) = 2 for clarity. (b) Scatterplot of CAND1 expression, highlighting the regulation event with the lowest fold change in the dataset (n = 875 compounds). Vorinostat and Quisinostat (both HDAC inhibitors) regulated CAND1 to similar levels. The three proteasome inhibitors in the dataset, ONX0914, MG132, and Epoxomicin, all downregulate CAND1. (c) The activity of each compound measured by the number of proteins decreased (x-axis) and increased (y-axis) by two-fold versus DMSO. Compare to Fig. 2f, which is the same graph using a five standard deviation cutoff. (d) Rate at which proteins increase versus decrease by five standard deviations. Proteins that mostly increase with small molecule treatments are in blue, those that mostly decrease in red. Only those proteins quantified in more than half of compound are shown (n = 8,860). Change rate is calculated by taking the number of compounds affecting expression by five standard deviations and dividing by the compounds where the protein was quantified. Compare to Fig. 2c, which is the same graph using two-fold versus DMSO cutoff. (e) Illustration of the two different regulation cutoff thresholds for each compound in the dataset. The number of proteins regulated by 5 standard deviations (y-axis) versus the number of proteins changed by two-fold versus DMSO (x-axis). Log scale (left) and linear (right). The line represents y = x. The slope of the scatterplot = ~3.
Extended Data Fig. 3 |
Extended Data Fig. 3 |. Regulation of target proteins informs on compound MOA.
(a) The 541 compound-target pairs analyzed, broken down by the two different regulation thresholds. Those in green and red are highlighted/annotated in Fig. 3c. (b) Proportion of primary targets that were identified, broken down by whether they were quantified in the TMT group that contained the compound. For a fraction of the target-compound pairs (<11%), the target was expressed in HCT116 cells, but it was not quantified in the TMT plex containing the compound. (c) Proportion of all 2,485 annotated targets quantified in the dataset (d) Number of regulated events per compound, separated by those that regulate their target (blue) and those that do not (black). (e) Histogram of Log2 fold change (compound versus DMSO) for all compound-target regulation events. The number of upregulation and downregulation events is indicated. (f) The compound-target regulation event with the smallest fold change is highlighted in purple. The 5 SD threshold is marked with an asterisk. Three HDAC inhibitors also regulate XPO1 expression to similar levels, suggesting a five standard deviation cutoff captures reproducible biology. (g) BRD4 expression across the dataset, with BRD4 inhibitors (purple) and PLK1 inhibitors (red) annotated. This is a low-fold change regulation event, highly reproducible across several compounds of the same class. (h) Protein expression (Log2 fold change) of all quantified proteins for the TYMS inhibitor nolatrexed, (highlighted in Fig. 3d) with DHFR labeled. Compound structure is shown below. (i) Related to Fig. 3f: Expression of the angiomotin family of proteins (AMOT, AMOTL1, and AMOTL2) across the MOA dataset. TNKS inhibitors (purple), PARP inhibitors (red) and proteasome inhibitors (brown) are highlighted. ( j) Expression of several proteins regulated by at least two compounds that target them. In each case the 5 SD threshold is marked with an asterisk.
Extended Data Fig. 4 |
Extended Data Fig. 4 |. Compounds with a similar MOA are strongly correlated.
(a) A table highlighting the number of nodes and edges in the overall network from Fig. 4a, after filtering to a FDR of 0.1%. The percentage of nodes and edges included in the network out of the total possible is shown in parentheses. (b) Several subcommunities highlighted from the larger compound-compound correlation network, including a cluster of HDAC inhibitors. All subnetworks are filtered to only include edges with a Pearson r > 0.60. (c-f) Pairwise correlation plots of (c) the CDK4/6 inhibitors palbociclib and ribociclib, (d) the CDK4/6 inhibitors palbociclib and abemaciclib, (e) the HDAC inhibitors quisinostat and vorinostat, and (f) the BRD4 inhibitors birabresib and CPI-203. All x- and y-axes are represented as Log2 fold change (compound versus DMSO).
Extended Data Fig. 5 |
Extended Data Fig. 5 |. Proteins with similar functions are correlated across the dataset.
(a) A table highlighting the number of nodes and edges in the overall network from Fig. 5a, after filtering to a FDR less than 5%. The percentage of nodes and edges included in the network out of the total possible is shown in parentheses. (b) Correlation plots for select pairs of strongly correlated proteins. All x- and y-axes are represented as Log2 fold change versus DMSO. Each point represents one compound. Plots include: 1) mevalonate kinase (MVK) versus lanosterol synthase (LSS), two proteins essential for cholesterol biosynthesis; 2) cyclin A1 (CCNA1) and cyclin A2 (CCNA2); 3) DNA damage proteins RAD51 and CHEK1. (c) A subcommunity of proteins (from Fig. 5a) correlated to cytochrome P450 monooxygenase, including redox sensors HMOX and TXNRD1. (d) A heatmap of protein expression for each of the proteins from (c) for all compounds that increase their expression by a median Log2 fold change of >0.6.
Extended Data Fig. 6 |
Extended Data Fig. 6 |. Novel activities and compound mechanisms can be inferred through compound-level correlation networks.
(a) An isolated community of three compounds with different targets and high correlation. Names, targets, and structures for each compound are shown. An aroylhydrazone group, common in all three compounds, is highlighted in red. (b) Correlation plots of the indicated compounds; repurchased and rescreened. All axes are Log2 fold change (compound versus DMSO). Lines are drawn at x = −0.75 and y = −0.75. GO enrichment of proteins decreased by ≥60% by all three compounds. Proteins from the ‘iron-sulfur cluster binding’ molecular function category are highlighted on the scatterplot in red. Enriched GO functions and their adjusted (using Benjamini-Hochberg) p-values were calculated using the enrichGO R package. (c) Correlation plot of repurchased RN486 (a noncovalent BTK inhibitor) and Ibrutinib (a covalent BTK inhibitor). (d) Volcano plot highlighting significantly up (blue) and down (red) regulated proteins in RN486 treated cells. ‘L2FC’ = Log2 fold change (RN486 vs DMSO) (e) KEGG pathway enrichment of up (blue bars) and down (red bars) regulated proteins in RN486 treated cells. Proteins used for KEGG pathway enrichment are color coded from (d). Enriched pathways and their adjusted (using Benjamini-Hochberg) p-values were calculated using the enrichKEGG R package. (f) Volcano plots of proteins competed off a kinase affinity enrichment medium (kinobeads) by RN486 (left) and Ibrutinib (right). A mixed lysate was used for this experiment, as BTK is not expressed in HCT116 cells. Compounds were tested at 10 μM, and all proteins with a two-fold or greater decrease in association with the enrichment matrix are labeled. BTK and TEC, the targets of these compounds, are highlighted in purple. ‘L2FC’ = Log2 fold change (treated vs DMSO) (g) Putative off targets of RN486 and Ibrutinib revealed by the proteome integral solubility alteration assay (PISA—a form of a thermal shift assay), performed in live HCT116 cells. Indicated proteins were significantly (5% FDR) stabilized or destabilized by treatment with one or both of the compounds (10 μM–30 min). All proteins with a Log2 fold change of >±0.25 are shown. Proteins localized to the mitochondria and/or endoplasmic reticulum are highlighted in red; kinases are highlighted in green. P-values in panels (d and f) were calculated for each protein within each treatment group relative to DMSO using a two-sided student’s t-test. False discovery rates (q-values) were estimated using the permutation-based method with 250 randomizations.
Extended Data Fig. 7 |
Extended Data Fig. 7 |. Novel activities and compound mechanisms can be inferred through compound-level correlation networks.
(a) Full table of GO enrichment results from Supplementary Fig. 6b. Enriched GO functions and their adjusted (using Benjamini-Hochberg) p-values were calculated using the enrichGO R package. (b) Volcano plot of protein expression from cells treated with (repurchased) ibrutinib for 24 hr at 10 μM. Green dots have q < 0.05 by permutation-based FDR. (c) Compound-compound community of RN486 correlated compounds (Pearson > 0.5). Blue nodes are kinase inhibitors, brown nodes are annotated to target other classes of proteins. The RN486 node is green. (d) Chemical structures of RN486 and Ibrutinib. (e) Full tables of KEGG pathway enrichment related to Supplementary Fig. 6E. Pathways enriched from upregulated proteins (top) and down-regulated proteins (bottom) are shown. Enriched pathways and their adjusted (using Benjamini-Hochberg) p-values were calculated using the enrichKEGG R package. (f) Volcano plot showing results of the thermal shift assay (PISA experiment) from HCT116 cells treated with Ibrutinib (left) or RN486 (right). Compounds were treated at 10 μM for 30 minutes in suspension. All proteins (with q < 0.05) with Log2FC greater than 0.25 or less than −0.25 are included in Fig. 6g. ‘L2FC’ = Log2 fold change (treated vs DMSO). P-values in panels (b and f) were calculated for each protein within each treatment group relative to DMSO using a two-sided student’s t-test. False discovery rates (q-values) were estimated using the permutation-based method with 250 randomizations.
Extended Data Fig. 8 |
Extended Data Fig. 8 |. JP1302 stops transcription by disrupting the FACT complex and histone H1.
(a) Protein-level linear regression of TP53 and the TP53 response gene MDM2 for all compounds in the dataset. Compounds that break the expected trend are shown (purple), including JP1302 (orange). Shading along the regression line represents the 95% confidence interval. (b) Volcano plot of protein expression from HCT116 cells treated with 1 μM THZ531 for 24 hr. (c) Volcano plot of protein expression from HCT116 cells treated with repurchased JP1302 (10 μM) for 2 hr. (d) Volcano plot showing results from a PISA experiment from cells treated with flavopiridol (10 μM). Red labels correspond to the same proteins labeled in the CBL0137/JP1302 PISA experiment in Fig. 6h. Black text highlights proteins with melting temperatures uniquely affected by flavopiridol. (e) Volcano plot of protein expression from HCT116 cells treated with repurchased JP1302 for 30 min (10 μM), prior to being subjected to melting for PISA analysis. This is a matched proteome for Fig. 6h; the same proteins are labeled to show ligand-induced changes in thermal stability are not due to protein-level changes. (f) Western blot of RNA polymerase II phosphorylation levels in HCT116 cells treated for 90 minutes with indicated compounds. Treatment concentration is 10 μM or 1 μM (THZ531) unless indicated. The ‘pPolII S2’ panel is made from two separate Western blots, as indicated by the black vertical line. This experiment was performed twice, on different days, achieving similar results. (g) Volcano plots from the dose-dependent JP1302 whole proteome experiment. Noted in each plot is the number of proteins decreased by two-fold versus DMSO (left side) and increased two-fold versus DMSO (right side). (h) Full 16-point EC50 curves for the indicated compounds in HCT116 cells with wild-type (WT) TP53 or after TP53 knockout (KO). Labeled in each plot is the 95% confidence interval for each EC50 curve. Points on each curve are presented as the mean values ± standard deviation of biological triplicate measurements. MI773 is a nutlin-based, MDM2-P53 protein-protein interaction inhibitor. P-values in panels (B-E and G) were calculated for each protein within each treatment group relative to DMSO using a two-sided student’s t-test. False discovery rates (q-values) were estimated using the permutation-based method with 250 randomizations. Proteins with q > 0.05 are represented by light grey in each plot.
Extended Data Fig. 9 |
Extended Data Fig. 9 |. Proteome fingerprints can be maintained across a concentration range.
(a) Experimental design for a compound rescreen, which compares the proteome fingerprints of 8 tool compounds at two doses; 10 μM versus 500 nM or 1 μM, to those from the primary 875 compound MOA dataset (referred here as the reference dataset). **** There are no compounds with significant correlation (p > 0.38) to 500 nM Simvastatin (b) Study results depicting treatment concentration, identity of top correlated compounds from the reference dataset, and a heatmap of Pearson correlations (r) between proteome fingerprints from the indicated compound/concentration and the same compound from the reference dataset. (c) Table of the top six most similar compounds from the MOA reference dataset for the two treatment concentrations of JQ-1 from the rescreen experiment. (d) Scatterplots for a representative set of compounds from the rescreen experiment (y-axes) plotted against the indicated compound from the reference MOA dataset (x-axes). All values are Log2(fold change – compound vs. DMSO). The y = x line is shown on each plot to observe the relative trend in the relationship different concentrations and the reference proteome fingerprint. (e) Scatterplots for simvastatin, a HMGCR inhibitor, at two concentrations relative to the reference. This compound upregulates its target at both 500 nM and 10 μM.
Fig. 1 |
Fig. 1 |. A 96-well-plate-based platform for comprehensive proteome analysis of drug MOA.
a, Overview of screening scheme, starting with HCT116 cells growing in 96-well plates. Deep proteome analysis in duplicate is performed using TMT sample multiplexing after 24-h treatments. b, Clinical stage of compounds from the MOA library at time of annotation. c, Proteome depth for each of the 875 compounds in the dataset. d, Representative proteome fingerprint for the molecular glue pomalidomide showing replicate measurements for downregulated proteins—displayed as log2(FC) (pomalidomide versus DMSO).
Fig. 2 |
Fig. 2 |. Most of the proteome is accessible to regulation by small molecules.
a, Statistics for protein-level regulation using two significance thresholds: 5SD and twofold change (compound versus DMSO). Regulated proteins were perturbed by one or more compounds in the dataset. b, Breakdown of all regulated events by a 5SD change, a twofold change or both. Around 1.9% of all 7.6 million protein measurements were regulated events. c, Rate at which proteins increased by twofold (n = 97) versus decreased (n = 213) by twofold. Only proteins quantified in at least half of compounds are shown (n = 8,860). Change rate is calculated by taking the number of compounds affecting expression by twofold and dividing by the number of compounds where the protein was quantified. d, KEGG pathway enrichment analysis from c. e, Compound-level waterfall plot highlighting the number of regulated proteins (by 5SD and/or twofold change) for each compound. f, Activity of each compound measured by the number of proteins decreased (x axis) and increased (y axis) by 5SD 24 h after treatment.
Fig. 3 |
Fig. 3 |. Regulation of target proteins by small molecules informs compound MOA.
a, Proportion of primary targets identified in this dataset. b, Proportion of primary and first secondary, if applicable, targets regulated by 5SD or twofold, n = 541. c, Histogram of compounds that regulate their target protein (primary and one secondary target) by twofold versus DMSO. Annotations are ‘TargetGene_CmpdName,’. d, Expression of DHFR for all 875 compounds. Those that increase DHFR expression are highlighted. e, Protein expression of all quantified proteins for compounds highlighted in d. f, Expression of TNKS/TNKS2 for all compounds, colored by inhibitor class. g, CLK1, CLK2, CLK3 and CLK4 expression across the dataset. Reported P values were generated from unpaired, two-sided Wilcoxon test. For CLK1, n = 875; CLK2, n = 857; CLK3, n = 875; CLK4, n = 808. The center line represents the median, the upper and lower bounds of the box indicate the interquartile range (IQR, the range between the 25th and 75th percentiles) and whiskers extend to the highest and lowest values within 1.5 times the IQR.
Fig. 4 |
Fig. 4 |. Mechanism of action drives compound community organization.
a, Community plot built from a compound–compound correlation matrix. b, Subcommunity of MDM2 and CDK4/6 inhibitors. All subcommunities are filtered to only include edges with r > 0.6. c, Pairwise correlation plot of the MDM2 inhibitors Idasanutlin and Nutlin3a. d, Subcommunity of BRD4 and PLK1 inhibitors. e, Pairwise correlation plot of the PLK1 inhibitors BI-2536 and volasertib. f, Subcommunity of compounds correlated to the RAF inhibitor L-779450 containing many inhibitors of the MAP kinase family. g, Pairwise correlation plot of the MAP kinase pathway inhibitors MEK126 and AZ628. h, Subcommunity of proteasome inhibitors. i, Pairwise correlation plot of MG132 and ONX0914—two strongly correlated proteasome inhibitors. For all pairwise correlation plots (c, d, g, i), all x and y axes are represented as log2(FC) (compound versus DMSO) with Pearson (r) reported.
Fig. 5 |
Fig. 5 |. Protein–protein correlations highlight relationships between drug response pathways.
a, Community network of protein–protein correlations. Only positive correlations and communities larger than five members are included in this network. Open blue circles denote enriched GO molecular function GO categories for the proteins within the circle. Filled circles are annotated manually based on the composition of the proteins within the circle. bd, Pairwise correlation plot of: b, kinetochore proteins NUF2 and NDC80, c, lysosomal protein LAPTM4A and autophagy regulator TMEM59, d, acetyl CoA carboxylase 1 (ACACA) and 2 (ACACB), with select compounds highlighted that affect the expression of each pair of proteins. All x and y axes are represented as log2(FC) (compound versus DMSO). Each point represents one compound. e, Subcommunity of correlated proteins, including several NAD and succinate dehydrogenases. f, Heatmap of protein expression for each protein in e for all compounds that increase or decrease their expression by a median log2(FC) of greater than 0.5 or less than −0.5.
Fig. 6 |
Fig. 6 |. JP1302 blocks transcription through disruption of the FACT complex and histone H1.
a, Number of regulated events for each compound in this dataset, based on whether a target was identified. All 2,485 annotated targets were used. The P value is from unpaired, Wilcoxon test (n = 875). The center line represents the median, the upper and lower bounds of the box indicate the IQR (range between the 25th and 75th percentiles) and whiskers extend to the highest and lowest values within 1.5 times the IQR. b, Compound–compound community plot and structure of JP1302. Edge thickness denotes the degree of correlation (r = 0.6 to 0.8). c, Protein-level regression of p53 and p21 for all compounds in the dataset. Shading along the regression line represents the 95% confidence interval. d, Volcano plot of JP1302-treated (10 μM, 24 h) cells using repurchased compound. e, Correlation of proteome fingerprints from JP1302-treated (10 μM) cells versus THZ531-treated (1 μM) cells. f, Expression of proteins highlighted in e across the MOA dataset. g, Volcano plot of protein expression from HCT116 cells treated with JP1302 (10 μM, 4 h). h, Correlation of ligand-induced changes in proteome thermal stability for CBL0137 and JP1302-treated HCT116 cells. i, Western blot of various RNA pol II and DNA damage markers in HCT116 cells treated for 20 h with indicated compounds. Treatment concentration is 10 μM or 1 μM (THZ531) unless indicated. j, Table showing the number of up- and downregulated proteins (by twofold versus DMSO) in cells treated with the indicated concentrations of JP1302. KEGG pathways enriched from the list of proteins upregulated by twofold is shown for each concentration. Enriched pathways and their adjusted (using Benjamini–Hochberg) P values (PAdj.) were calculated using the enrichKEGG R package. k, Compound–compound community plot generated from the larger MOA dataset after including the JP1302 dose-dependent proteome fingerprints (red nodes). All JP1302 nodes and all network edges higher than 0.5 (Pearson r) are shown. P values in d and g are calculated as described in Methods. Measurements with Q > 0.05 are light gray.

Comment in

References

    1. Subramanian A et al. A next generation connectivity map: L1000 platform and the first 1,000,000 profiles. Cell 171, 1437–1452 e17 (2017). - PMC - PubMed
    1. Gygi SP et al. Correlation between protein and mRNA abundance in yeast. Mol. Cell. Biol. 19, 1720–1730 (1999). - PMC - PubMed
    1. Liu Y, Beyer A & Aebersold R On the dependency of cellular protein levels on mRNA abundance. Cell 165, 535–550 (2016). - PubMed
    1. Nusinow DP et al. Quantitative proteomics of the cancer cell line encyclopedia. Cell 180, 387–402 e16 (2020). - PMC - PubMed
    1. Litichevskiy L et al. A library of phosphoproteomic and chromatin signatures for characterizing cellular responses to drug perturbations. Cell Syst. 6, 424–443e7 (2018). - PMC - PubMed

Publication types