

doi: 10.1038/s41587-022-01536-3.
Epub 2023 Jan 2.
Integration of whole transcriptome spatial profiling with protein markers
Affiliations
- PMID: 36593397
- PMCID: PMC10272089
- DOI: 10.1038/s41587-022-01536-3
Item in Clipboard
Integration of whole transcriptome spatial profiling with protein markers
Nat Biotechnol.
2023 Jun.
Abstract
Spatial transcriptomics and proteomics provide complementary information that independently transformed our understanding of complex biological processes. However, experimental integration of these modalities is limited. To overcome this, we developed Spatial PrOtein and Transcriptome Sequencing (SPOTS) for high-throughput simultaneous spatial transcriptomics and protein profiling. Compared with unimodal measurements, SPOTS substantially improves signal resolution and cell clustering and enhances the discovery power in differential gene expression analysis across tissue regions.
© 2023. The Author(s), under exclusive licence to Springer Nature America, Inc.
Figures
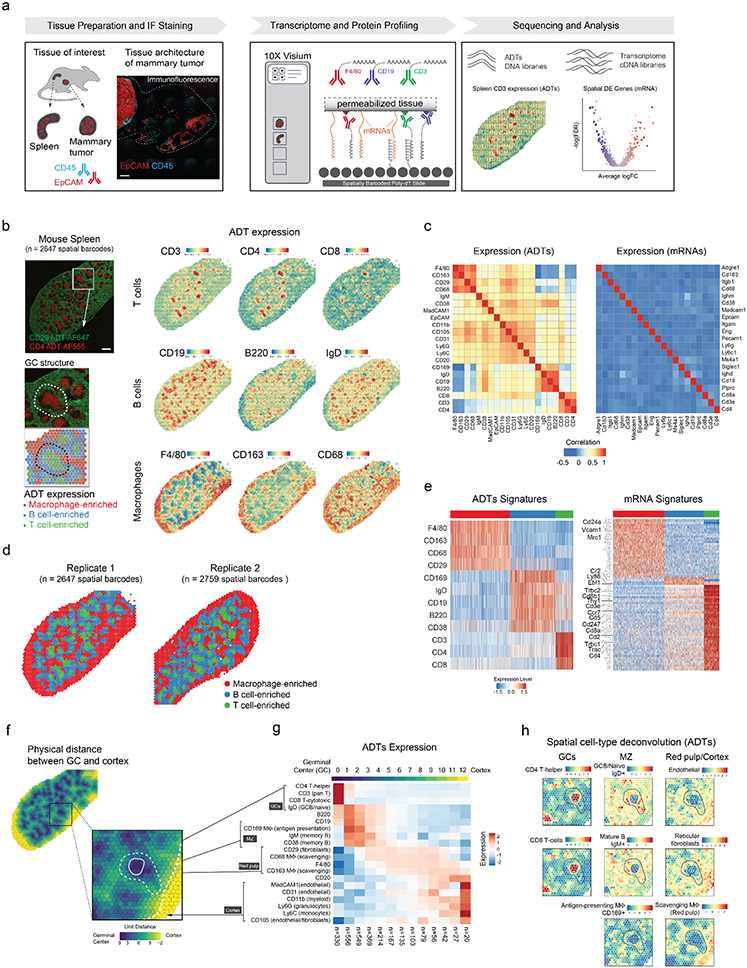
(a) Overview of SPOTS workflow outline. Fresh tissue samples were collected and embedded in OCT. Tissue sections (10μm) were processed following SPOTS protocol (including staining with fluorescent and ADT antibodies, permeabilization, mRNA capture, reverse transcription, and second-strand synthesis; Methods) and sequenced for downstream analysis. See Supplementary Figure 1 for detailed SPOTS schematic. Scale bar 200μm. (b) Normalized ADT levels of key surface markers for mouse spleen. Left panel: immunofluorescence (IF) staining for CD29 (green) and CD4 (red) with inset showing the germinal center (GC) architecture and its underlying spatial barcodes. Right panel: normalized ADT levels of marker genes for T cells (CD3, CD4, CD8), B cells (CD19, B220, IgD), and Macrophages (F4-80, CD163, CD68). (c) Correlation between the 21 ADTs and their corresponding mRNA expression levels across two biological replicates (Supplementary Table 1). (d) Spatial barcode clustering and major cell type enrichment (Macrophage, B cell, and T cell) based on ADTs of two biological replicates (Supplementary Table 2). (e) ADT and mRNA signatures for each cluster of spatial barcodes. Left panel: heatmap showing expression levels (Z-score) of differentially expressed ADTs for each cluster. Right panel: heatmap showing expression levels (Z-score) of differentially expressed mRNAs in 3,000 downsampled spatial barcodes. Key marker genes are highlighted (Supplementary Table 3). (f) Physical distance (color scale) from the center of GCs for each spatial barcode. (g) Spatial gene expression patterns of ADTs in the spleen. ADT Expression pattern (Z-score) from GC to spleen cortex and their anatomical definition (black boxes). The top color bar represents the physical distance as in the right panel. The number of spatial barcodes in each bin is labeled at the bottom. MZ, marginal zone. (h) Cell-type deconvolution based on ADTs expression (Z-score) of each spatial barcode overlaid onto the spleen tissue. Deconvolution values are provided in Supplementary Table 2.
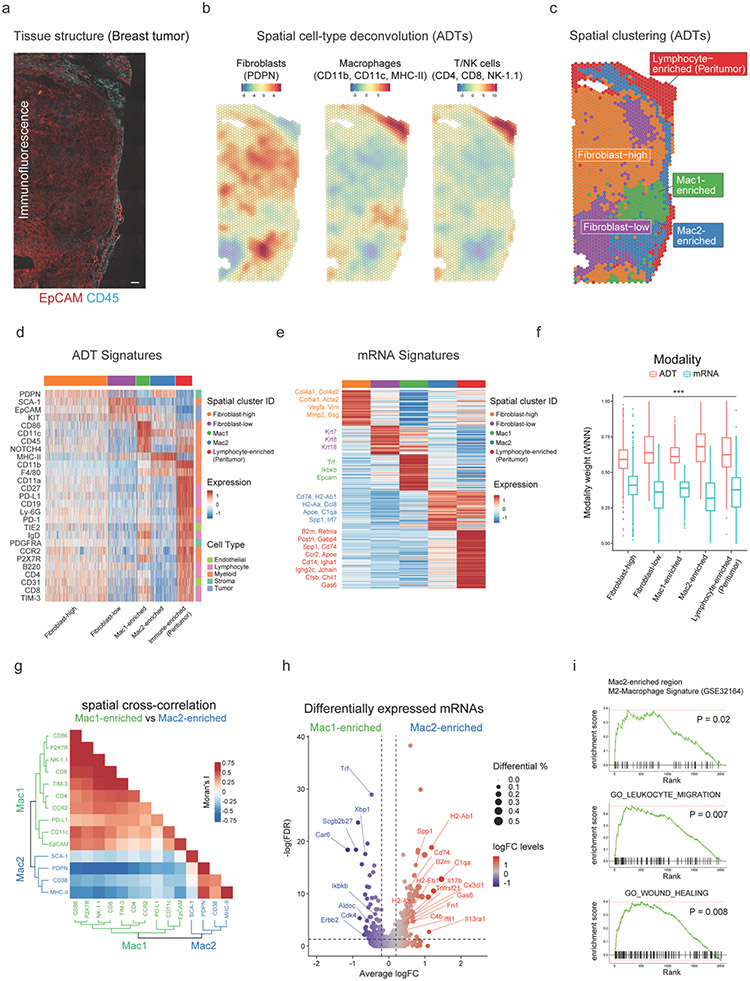
(a) IF staining of EpCAM (red) and CD45 (cyan) in breast cancer tissue. Scale bar 200μm. (b) Cell-type deconvolution based on ADTs (Z-score) of each spatial barcode overlaid onto the breast cancer tissue. Deconvolution values are provided in Supplementary Table 4. (c) Spatial barcode clustering results with annotation of major cell type enrichment based on ADTs (Supplementary Table 4). (d) Heatmap showing ADT signatures (Z-score) for each cluster (Supplementary Table 5). (e) Heatmap showing the average expression levels (Z-score) of differentially expressed mRNAs for each cluster. Key marker genes are colored and highlighted. The complete list of differentially expressed mRNAs is listed in Supplementary Table 5. (f) Boxplot showing relative contributions (WNN modality weights) to spatial clustering of mRNA and ADT modalities. Paired t-test, *p<0.05, **p<0.01, ***p<0.001, otherwise not significant (n.s). (g) Heatmap showing the spatial cross-correlation (bivariate Moran’s I) of ADTs in Mac1- and Mac2-enriched regions with dendrograms showing hierarchical clustering of ADTs. (h) Volcano plot showing log fold changes (logFC) of the top 5,000 most variable genes between Mac1- and Mac2-enriched spatial barcodes and their significance (y-axis; −log10 scale). Genes are dotted and colored by logFC levels (color scale). The size of the dot represents the difference in the fraction of detection between the two groups. Macrophage-related genes are annotated. P-values were determined by the Wilcoxon Rank Sum test. Vertical dotted lines represent ±0.2 logFC. Horizontal dotted lines represent false discovery rate (FDR) of 0.05 (−log10 scale). Raw and FDR corrected P-values and logFC values are listed in Supplementary Table 5. (i) Gene Set Enrichment Analysis (GSEA) of Mac2-enriched spatial barcodes based on mRNA expression.
References
Publication types
MeSH terms
Substances
Grants and funding
LinkOut - more resources
Full Text Sources
Other Literature Sources
Molecular Biology Databases
