. 2023 Jun;41(6):858-869.
doi: 10.1038/s41587-022-01546-1. Epub 2023 Jan 2.

Magnify is a universal molecular anchoring strategy for expansion microscopy

Affiliations

Magnify is a universal molecular anchoring strategy for expansion microscopy

Aleksandra Klimas et al. Nat Biotechnol. 2023 Jun.

Abstract

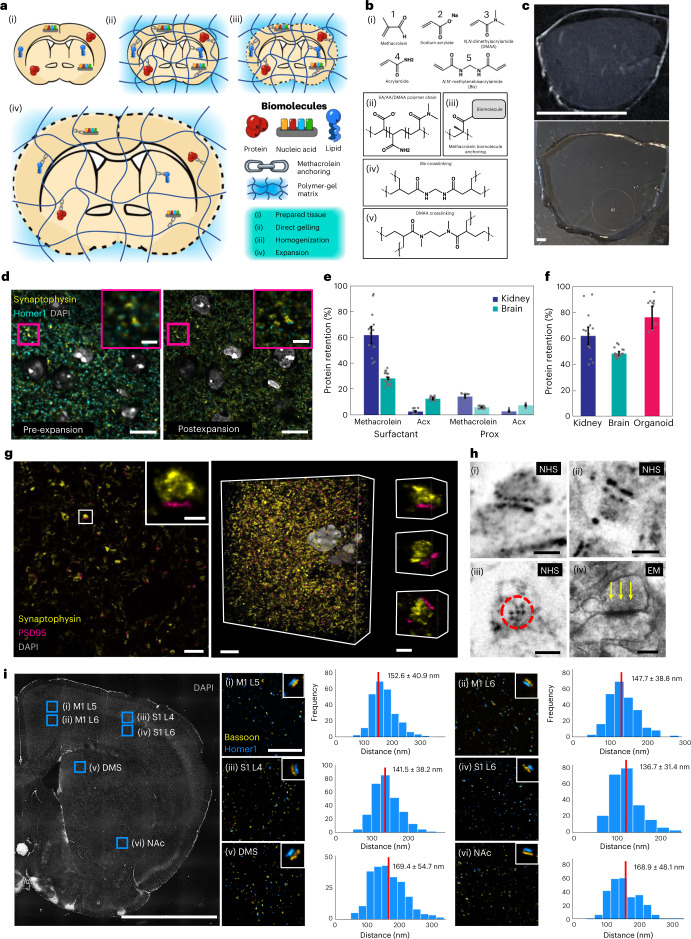
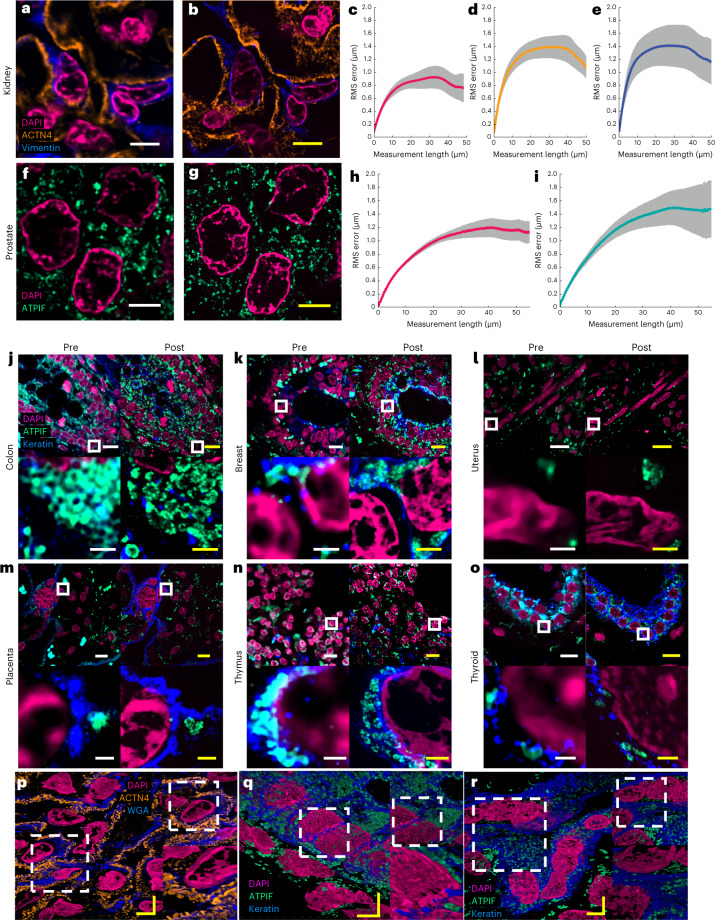
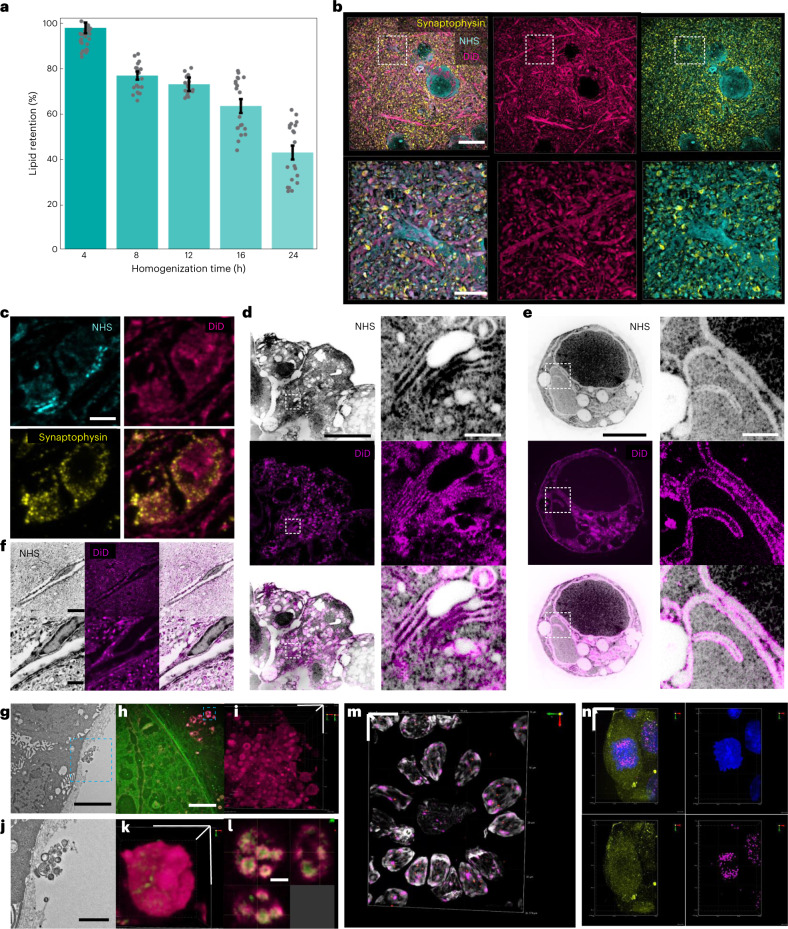
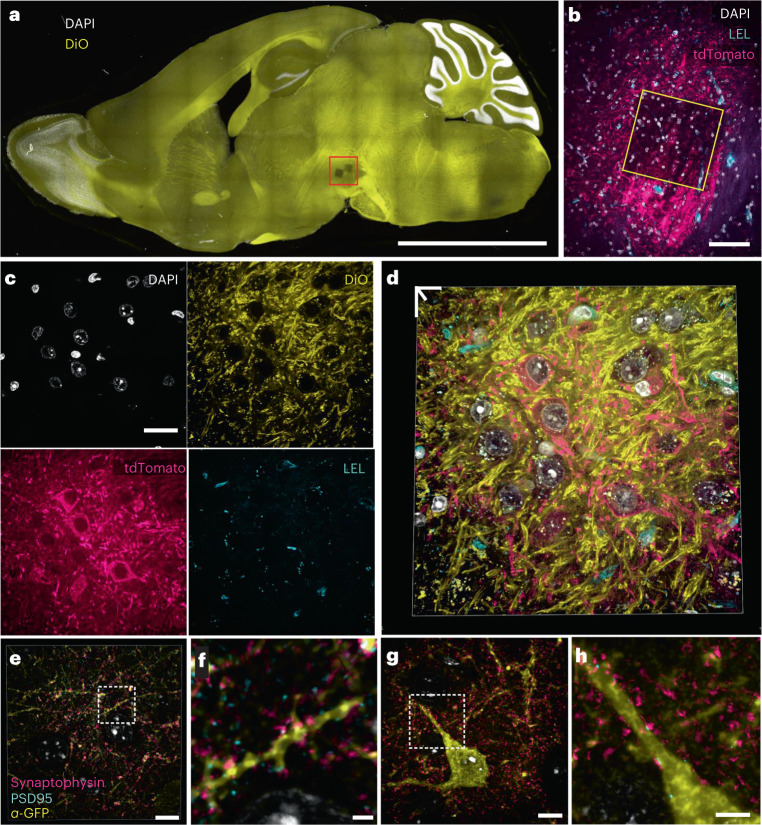
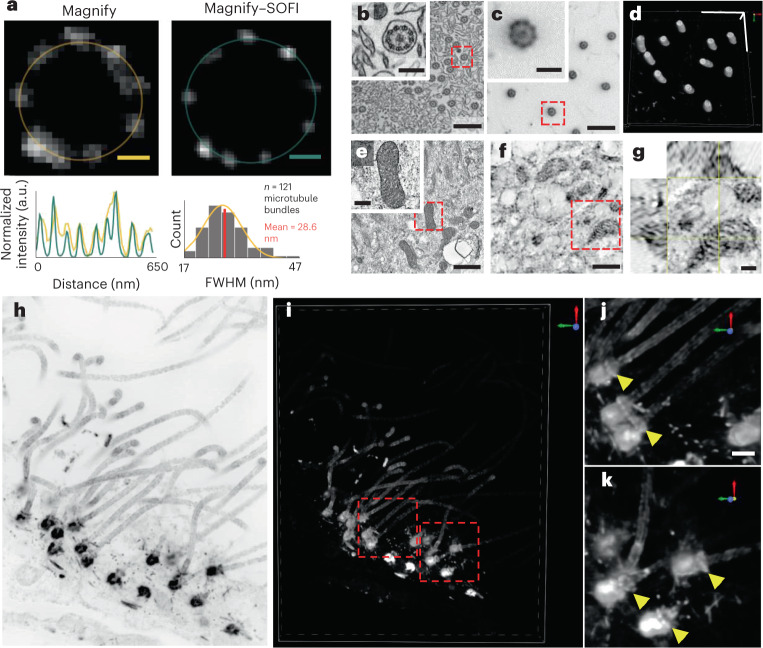
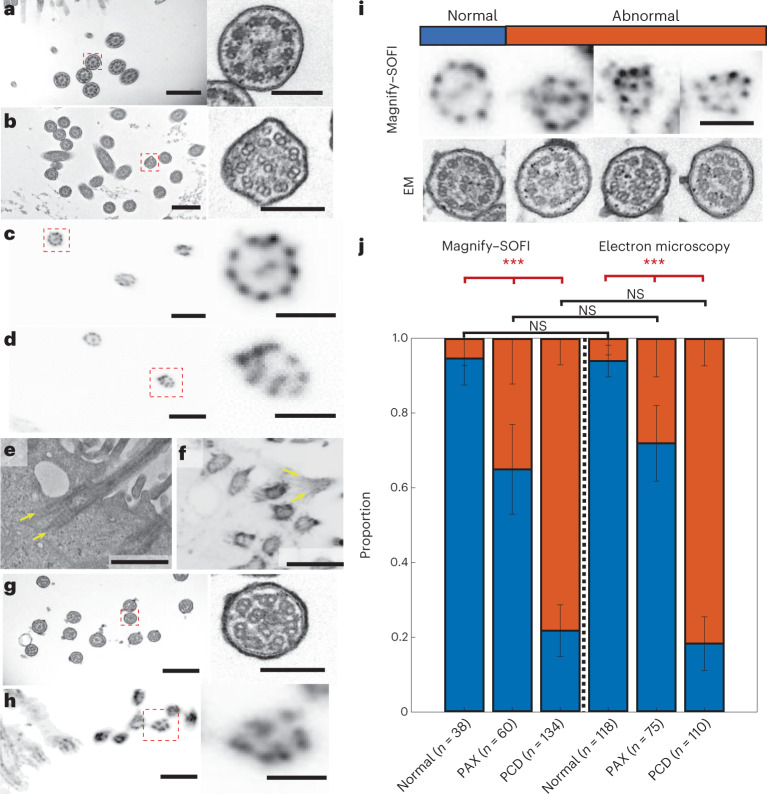
Expansion microscopy enables nanoimaging with conventional microscopes by physically and isotropically magnifying preserved biological specimens embedded in a crosslinked water-swellable hydrogel. Current expansion microscopy protocols require prior treatment with reactive anchoring chemicals to link specific labels and biomolecule classes to the gel. We describe a strategy called Magnify, which uses a mechanically sturdy gel that retains nucleic acids, proteins and lipids without the need for a separate anchoring step. Magnify expands biological specimens up to 11 times and facilitates imaging of cells and tissues with effectively around 25-nm resolution using a diffraction-limited objective lens of about 280 nm on conventional optical microscopes or with around 15 nm effective resolution if combined with super-resolution optical fluctuation imaging. We demonstrate Magnify on a broad range of biological specimens, providing insight into nanoscopic subcellular structures, including synaptic proteins from mouse brain, podocyte foot processes in formalin-fixed paraffin-embedded human kidney and defects in cilia and basal bodies in drug-treated human lung organoids.


Conflict of interest statement

The authors declare the following competing financial interest(s): Y.Z. and A.K. are inventors on several inventions related to ExM. The remaining authors declare no competing interests.

Figures

Fig. 1
Fig. 1. Design and validation of the Magnify protocol.
a, Magnify protocol. b, Magnify gel chemistry. (i), Species participating in free radical polymerization. (ii)–(v), Example interactions of gel monomers. c, Magnify expanded mouse brain section. Top, after incubation and polymerization (as in a, (ii)). Bottom, after hot surfactant homogenization and full expansion in ddH2O (as in a, (iv)). The tissue has expanded uniformly and without distortion; a small piece (top right of the gel) was lost during liquid transfer. EF = 10.5×. d, Fluorescent signal is retained after proteolytic digestion. Insets, zoom ins of boxed regions. EF = 3.1× in PBS. e, Comparison of protein retention in FFPE human kidney sections (blue) and PFA-fixed mouse brain sections (green) for different anchoring and homogenization strategies. f, Comparison of protein retention across tissue types for the Magnify framework. g, Postexpansion immunostaining with Magnify. Left, synapses in the mouse striatum immunostained after Magnify processing with homogenization in surfactant solution. Inset, a single synapse in boxed region. Middle, 3D reconstruction of the same FOV shown in the left panel. Right, 3D reconstructions of individual synapses EF = ~11× in ddH2O. h, Magnify enables visualization of nanoscopic synaptic architecture. (i),(ii), Synapses in the mouse brain labeled for total protein content with a fluorescent NHS ester dye. EF = ~10× in ddH2O. (iii), A hexagonal lattice of dense projections in mouse brain tissue expanded with Magnify. EF = ~11× in ddH2O. (iv), Electron micrograph of a synapse from a separate mouse brain sample with visible dense projections (arrows). i, Measurement of homer-bassoon synaptic pair distances across the mouse brain with Magnify. Left, regions marked with blue squares. (i),(ii), Primary motor cortex layers 5 (M1 L5) and 6 (M1 L6). (iii),(iv), Primary somatosensory cortex layers 4 (S1 L4) and 6 (S1 L6). (v), DMS. (vi), NAc. EF = 3.6× in 1× PBS. Right, (i)–(vi), zoom ins of boxed regions; insets, representative synapses. Pair distance (center to center) was measured in each region. Scale bars, c, 5 mm; d, 10 µm; inset, 2 µm; g, left, 1 µm, left inset, 250 nm, middle, 5 µm, right, 250 nm; h, (i),(ii), 200 nm, (iii), 100 nm, (iv), 200 nm; i, tissue overview, 2 mm, zoom ins, 5 µm. Scale bars are all in biological scale.
Fig. 2
Fig. 2. Validation of Magnify in several tissue types.
a,b, Example of pre-expansion images of human kidney imaged at ×60 and processed with SOFI (a) compared with the same FOV postexpansion with Magnify taken at ×40 (b). Postexpansion images are maximum intensity projected over 25 frames in z. ce, RMS length measurement error as a function of measurement length for pre-expansion versus postexpansion images for DAPI (c), ACTN4 (d) and Vimentin (e). Solid line, mean of channel; shaded area, s.e.m.; n = 5 technical replicates; average EF = 8.64× (s.e.m. 0.24). f,g, Example images of human prostate imaged as in a and b. Postexpansion images maximum intensity projected over three frames. h,i, RMS length measurement error as a function of measurement length for pre-expansion versus postexpansion images of DAPI (h) and ATPIF (i). Solid line, mean of channel; shaded area, s.e.m.; n = 4 technical replicates; average EF = 10.38× (s.e.m. 0.57). jo, Validation of Magnify across several human tissue types. FFPE samples of human tissue were imaged at ×40 (top left). Images were taken at ×60 and processed with SOFI (bottom left). The white box indicates the FOV of the higher magnification images. The samples were then processed with the Magnify protocol, and the same FOVs were imaged postexpansion in water at ×10 (top right) and ×40 (bottom right). Postexpansion images were projected over 4–17 z slices. EFs in water were colon 8.85× (j), breast 9× (k), uterus 8× (l), placenta 8.75× (m), thymus 10.00× (n) and thyroid 10.59× (o). pr, Example 3D images of human tissues: kidney (EF = 8.68×) (p), colon (EF = 9.67×) (q) and uterus (EF = 8×) (r). Dashed white boxes, zoomed in regions. Scale bars (yellow, postexpansion images). a, 5 μm; b, 5 μm (physical scale postexpansion, 40.75 μm; EF = 8.15×); f, 5 μm; g, 5 μm (physical scale postexpansion: 51.9 μm; EF = 10.38×); jo, top, 10 μm; bottom, 1 μm; pr, 5 μm. Scale bars are all in biological scale.
Fig. 3
Fig. 3. Imaging of proteins, nucleic acids and lipids in biological specimens with Magnify.
a, Dotted bar chart showing lipid retention rate as a function of homogenization time in hot denaturing buffer. Error bars, s.e.m. b, Visualization of lipids in fully expanded Magnify-processed mouse brain. Top row, fully expanded mouse cortical neuron. Bottom row, zoom in of boxed region in top row. c, Visualization of a mitochondrion in Magnify-processed mouse brain with the lipophilic dye DiD. EF = 11×. d, Lipophilic dye staining of Golgi membranes in HEK-293FT cells expanded by Magnify. Right column, zoom ins of boxed area highlighting the Golgi body. e, Similar Magnify image of HEK-293FT cells as in d, but showing nuclear membrane labeling by DiD. EF = 9.22×. f, Lipophilic dye staining of blood vessels in mouse brain expanded by Magnify. EF = 10× in ddH2O. g, Electron micrograph of extracellular vesicles in human stem-cell-derived lung organoid. h, Two-color Magnify image of extracellular vesicles in the fully expanded human lung organoid with inverted look-up table. EF = 10.2×. Stain, green, Alexa Fluor 488 NHS ester; magenta, DiD. i, 3D reconstruction of h. j, Zoomed in view of boxed region in g. k, 3D reconstruction of the selected extracellular vesicle in h as indicated by the dashed blue box. l, Orthogonal view of the extracellular vesicle in k, showing complex internal structure. m, 3D reconstruction of confocal images of expanded human lymph node tissue labeled with DNA FISH probes against AKT1, Telomere (TelC) and human satellite 2. EF = 3.5× in 1× PBS. Gray, DAPI; green, AKT1; red, TelC; magenta, human satellite 2. n, 3D reconstruction of confocal images of expanded HEK-293FT cells. EF = 2.8× in 1× PBS. Blue, DAPI; green, RNA FISH probe against GAPDH; magenta, DNA FISH probe against human satellite 2. Scale bars (in biological scale), b, top, 5 µm, bottom, 2 µm; c, 250 nm; d,e, left, 5 µm, right, 1 µm; f, top, 5 µm, bottom, 2 µm; g,h, 3 µm; i,j, 1 µm; k, 500 nm. l, 200 nm; m, x, y and z: 7 µm; n, x, y and z: 10 µm.
Fig. 4
Fig. 4. Visualization of endogenous fluorophores with Magnify.
a, Maximum intensity projection of a sagittal mouse brain section expanded with Magnify-ProK. Yellow, DiO; White, DAPI. EF = 4.5× in PBS. b, Zoom in of boxed region in a showing imaged field in subsequent panels. Endogenous tdTomato can be seen in dopaminergic neurons in the ventral tegmental area. Cyan, Lycopersicon esculentum Lectin; magenta, crimson-tdTomato; white, DAPI. c, Zoom in of boxed region in b showing individual channels. d, 3D reconstruction of merged panels from c. e, 3D reconstruction of an SST cell in a fully expanded mouse cortex expanded with Magnify and homogenized with hot surfactant solution. Endogenous SST–GFP signal was recovered with an anti-GFP antibody applied postexpansion. Yellow, anti-GFP; cyan, PSD95; magenta, synaptophysin; white, DAPI. Synaptic markers close to GFP signal have been highlighted. EF = 9× in ddH2O. f, Zoom in of boxed region in e showing synapses on dendritic spines. g, Single z plane of a fully expanded SST neuron in mouse cortex from the same sample as e. h, Zoom in of boxed region in e showing synapses onto SST dendrite. Scale bars, a, 2.5 mm; b, 50 µm; c, 20 µm; d, 13 µm; (e,g, 5 µm; f,h, 2 µm. Scale bars are all in biological scale.
Fig. 5
Fig. 5. Magnify–SOFI visualizes ultrafine structures of cellular components.
a, Comparison between Magnify and Magnify–SOFI. Top, Cross-section of a basal body in human bronchial basal stem-cell-derived lung organoid processed with Magnify (left) and Magnify–SOFI (right). Bottom left, radial intensity profiles of basal bodies indicated by yellow and green circles. Bottom right, histogram of microtubule bundle peak-to-peak distances. a.u., arbitrary units. b, Electron micrograph of cilia in human stem-cell-derived lung organoid; inset, zoom in view (red box). c, Confocal image of cilia from the same type of tissue as b, expanded by Magnify–SOFI and stained with Alexa Fluor 488-conjugated NHS ester. d, 3D reconstruction of cilia in c. e, Electron micrograph of mitochondria in the same organoid as in b. f, Confocal image of mitochondria from the same expanded organoid as in e. g, Orthogonal view of a mitochondria indicated by the red box in e. EF = 10× h, Maximum intensity projection of a Magnify–SOFI image stack of ependymal cilia and basal bodies from the ependymal cell lining in the adult mouse brain. i, 3D reconstruction of h. j,k, Zoomed in images of individual ependymal cilia in 3D as indicated by the dashed red boxes in i. Yellow arrows indicate distal appendages. EF = 10.5×. Scale bars, a, 50 nm; b,c, 800 nm, Inset, 200 nm; d, x,y, 1 µm, z, 410 nm; e,f, 800 nm, Inset, 200 nm; g, 200 nm; h,i, 500 nm; j,k, 250 nm; scale bars are all in biological scale.
Fig. 6
Fig. 6. Magnify–SOFI visualizes subtle nanoscale drug-induced changes.
a, Electron micrograph of cilia in normal human stem-cell-derived lung organoid. Right, zoomed in image as indicated by dashed red line boxes. b, similar to a, except the lung organoid was treated with Paclitaxel. c, Magnify–SOFI image of cilia from the same type of tissue as a, stained with Cy3-conjugated NHS ester. Right, zoomed in image as indicated by dashed red line boxes. d, Similar to c, except the lung organoid was treated with Paclitaxel. e, Electron micrograph of a basal body with prominent rootlets. f, Confocal image of corresponding basal body from the same type of tissue as e, expanded by Magnify and processed with SOFI. g, Electron micrograph of cilia in human stem-cell-derived lung organoid from CCDC39 mutation-bearing human bronchial basal stem-cell-derived lung organoids. Right, zoomed in image as indicated by dashed red line boxes. h, Magnify–SOFI image of cilia in similar tissue as g. i, Side-by-side comparison between Magnify–SOFI images (top) and electron micrographs (bottom) of cilia with and without defects. j, Stacked bar chart of proportions of normal and abnormal cilia in normal, taxol-treated (denoted as PAX samples), and CCDC39 mutation-bearing human bronchial basal stem-cell-derived lung organoids (denoted as PCD samples). Three bars on the left were based on Magnify–SOFI images while the three on the right were based on electron micrographs. Error bars, s.e.m. Scale bars, a, 600 nm; b,c, 100 nm; d, 800 nm; e,f, 100 nm; g,h, 800 nm; i, 200 nm; same for both Magnify–SOFI and EM images. Scale bars are all in biological scale.

Comment in

Similar articles

Cited by

References

    1. Chen F, Tillberg PW, Boyden ES. Expansion microscopy. Science. 2015;347:543–548. doi: 10.1126/science.1260088. - DOI - PMC - PubMed
    1. Wassie AT, Zhao Y, Boyden ES. Expansion microscopy: principles and uses in biological research. Nat. Methods. 2019;16:33–41. doi: 10.1038/s41592-018-0219-4. - DOI - PMC - PubMed
    1. Tillberg PW, et al. Protein-retention expansion microscopy of cells and tissues labeled using standard fluorescent proteins and antibodies. Nat. Biotechnol. 2016;34:987–992. doi: 10.1038/nbt.3625. - DOI - PMC - PubMed
    1. Chozinski TJ, et al. Expansion microscopy with conventional antibodies and fluorescent proteins. Nat. Methods. 2016;13:1–7. doi: 10.1038/nmeth.3833. - DOI - PMC - PubMed
    1. Ku T, et al. Multiplexed and scalable super-resolution imaging of three-dimensional protein localization in size-adjustable tissues. Nat. Biotechnol. 2016;34:973–981. doi: 10.1038/nbt.3641. - DOI - PMC - PubMed

Publication types

LinkOut - more resources