. 2023 Jul;41(7):980-992.
doi: 10.1038/s41587-022-01566-x. Epub 2023 Jan 2.

High-throughput, targeted MHC class I immunopeptidomics using a functional genetics screening platform

Affiliations

High-throughput, targeted MHC class I immunopeptidomics using a functional genetics screening platform

Peter M Bruno et al. Nat Biotechnol. 2023 Jul.

Abstract

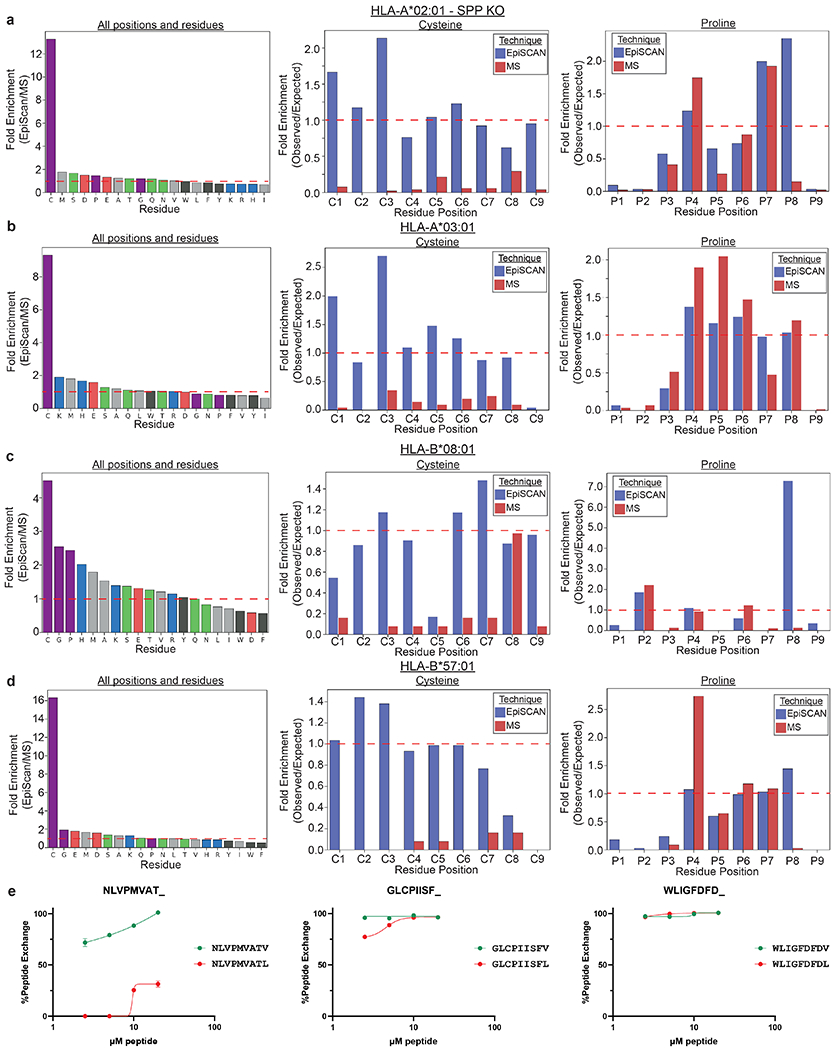
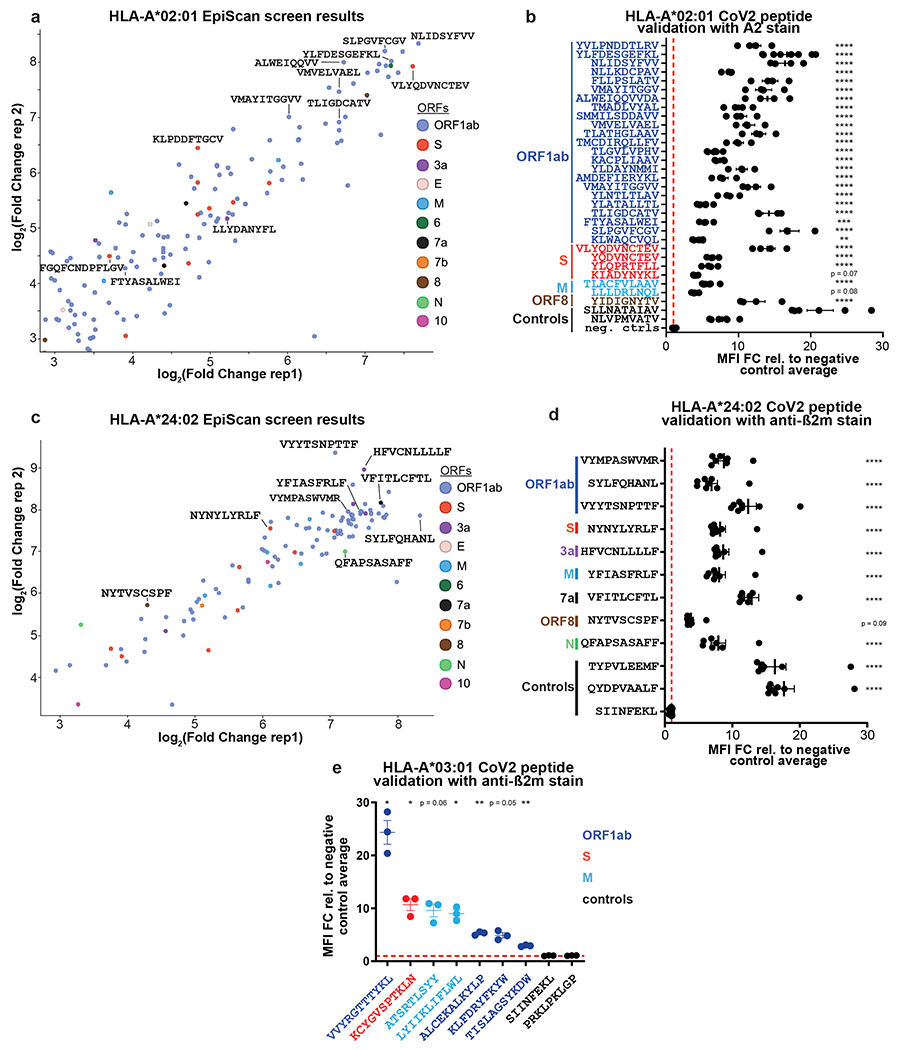
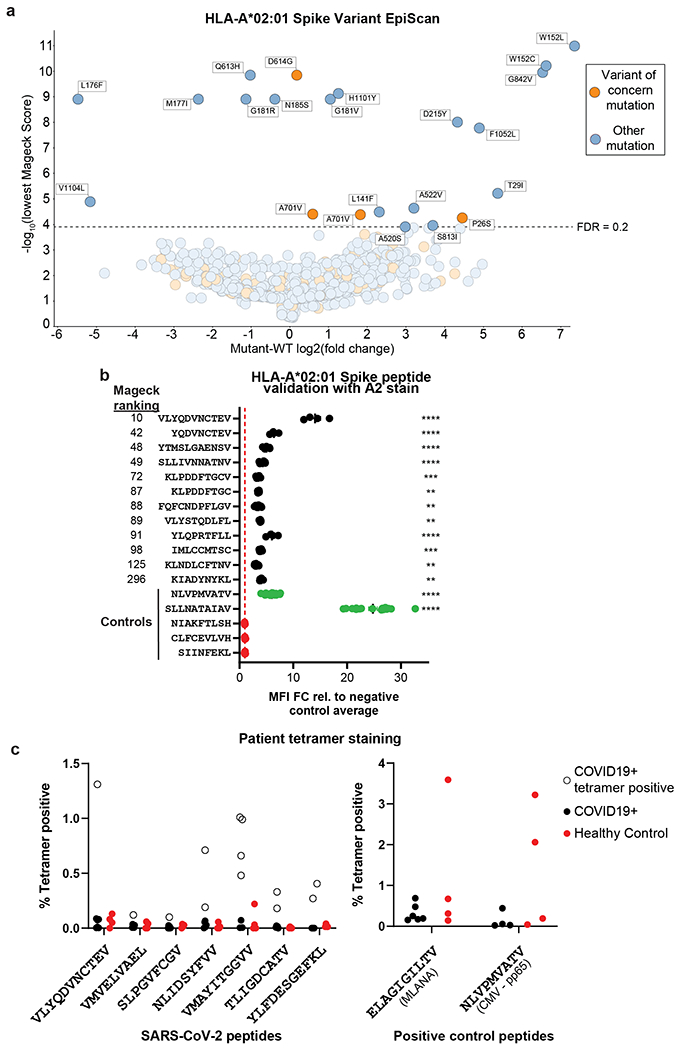
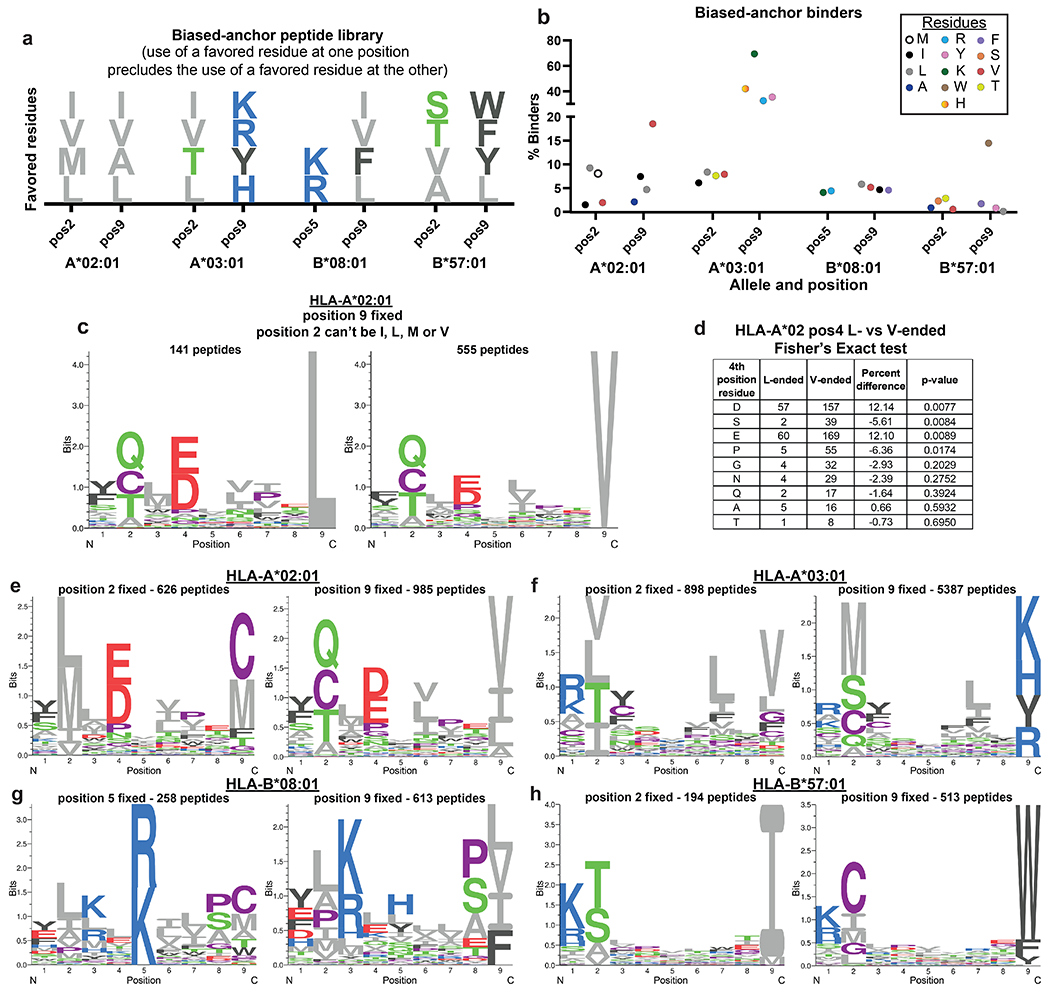
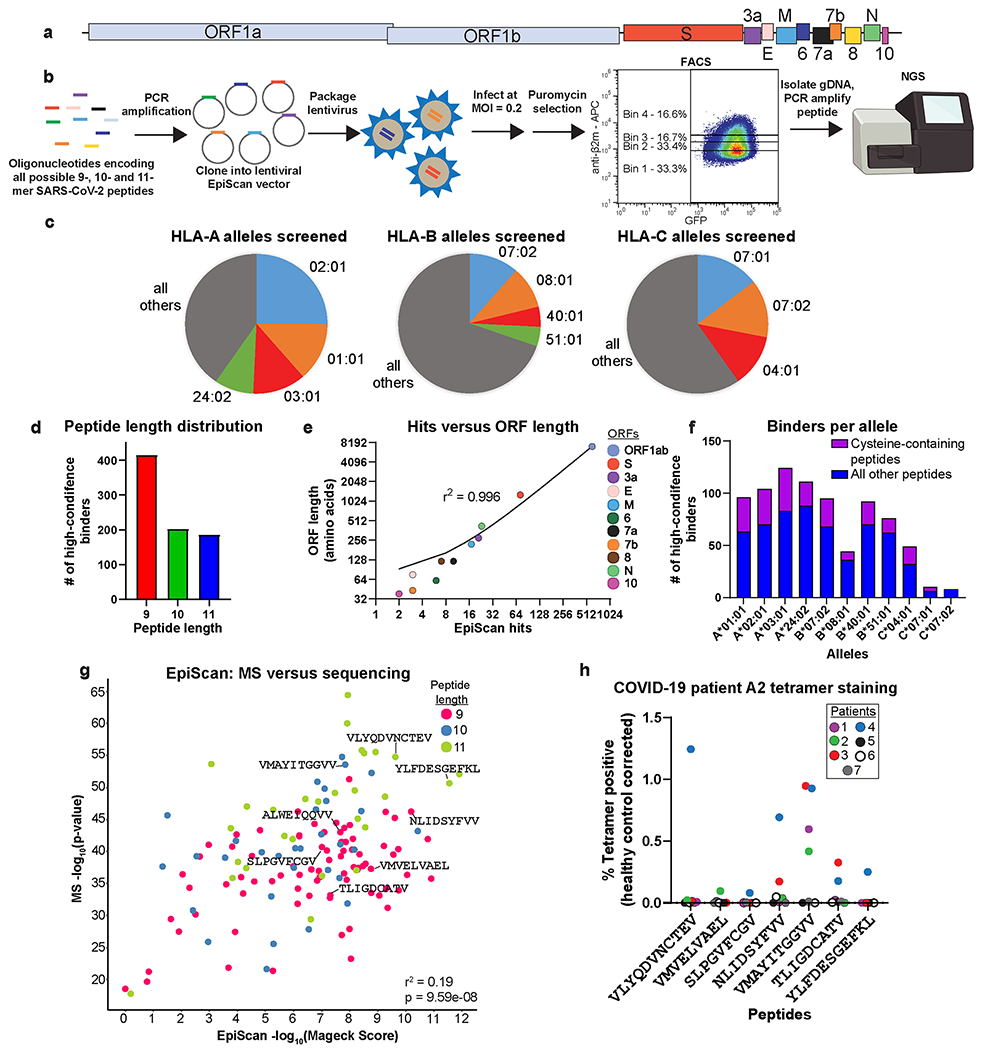
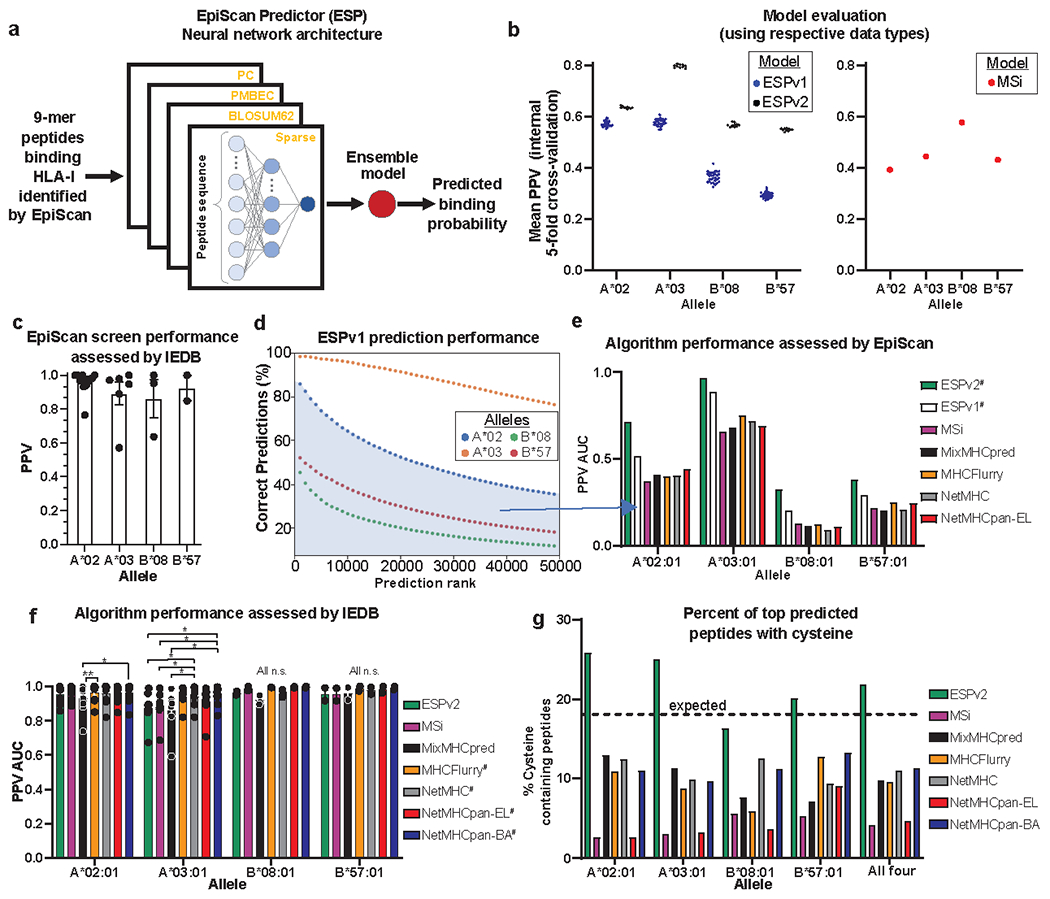
Identification of CD8+ T cell epitopes is critical for the development of immunotherapeutics. Existing methods for major histocompatibility complex class I (MHC class I) ligand discovery are time intensive, specialized and unable to interrogate specific proteins on a large scale. Here, we present EpiScan, which uses surface MHC class I levels as a readout for whether a genetically encoded peptide is an MHC class I ligand. Predetermined starting pools composed of >100,000 peptides can be designed using oligonucleotide synthesis, permitting large-scale MHC class I screening. We exploit this programmability of EpiScan to uncover an unappreciated role for cysteine that increases the number of predicted ligands by 9-21%, reveal affinity hierarchies by analysis of biased anchor peptide libraries and screen viral proteomes for MHC class I ligands. Using these data, we generate and iteratively refine peptide binding predictions to create EpiScan Predictor. EpiScan Predictor performs comparably to other state-of-the-art MHC class I peptide binding prediction algorithms without suffering from underrepresentation of cysteine-containing peptides. Thus, targeted immunopeptidomics using EpiScan will accelerate CD8+ T cell epitope discovery toward the goal of individual-specific immunotherapeutics.


Conflict of interest statement

Competing interests: S.J.E. is a founder of TSCAN Therapeutics, MAZE Therapeutics, ImmuneID and Mirimus, serves on the scientific advisory boards of Homology Medicines, ImmuneID, MAZE Therapeutics and TSCAN Therapeutics, and is an advisor for MPM Capital; none of which affect this work. P.M.B. and S.J.E. are inventors of and have submitted a patent on the EpiScan technology. The remaining authors have no competing interests to declare.

Figures

Extended Data Fig. 1
Extended Data Fig. 1. Generation and validation of EpiScan cells
(a) Histograms depicting the relative amounts of surface MHC class I, as determined by B2M staining, between parental 293T cells and the HLA-I KO clone. (b) Histogram depicting the relative amounts of surface MHC class I comparing parental HEK-293T cells, the TAP1/2 knockout clone and cells expressing the BoHV-1 UL49.5 gene, which inhibits the TAP complex. (c) Immunoblot validation of CRISPR-Cas9 mediated knockout of ERAP1; GAPDH was used as a loading control. This blot was conducted once. (d) Sanger sequencing of the ERAP2 locus targeted by CRISPR-Cas9. The locus was amplified by PCR and the products cloned into ZeroBlunt TOPO vectors and Sanger sequenced. ERAP2 KO clone 6 exhibited a 221 bp deletion in all 11 sequenced clones. (e) Testing signal peptides for the delivery of exogenous peptides to the ER. HEK-293T cells lacking TAP1/2 were infected with vectors expressing the indicated peptides fused to the following signal peptides: Env, signal peptide from the gp70 gene of mouse mammary tumor virus; mmIgK, modified murine Kappa Immunoglobulin signal peptide; and Azuro, signal peptide from the human Azurocidin preproprotein. Sequences highlighted in green indicate positive controls, while sequences highlighted in red indicate negative controls. Data are represented as mean ± SEM of the fold change in mean fluorescence intensity (MFI) relative to the average of the negative controls for that experiment. Each dot represents a different biological replicate. N = 13 for the four leftmost and n = 3 for the rest. ****p < 0.0001 for each group relative to RFP by one-way ANOVA with Dunnett’s multiple-comparison test. (f) Sanger sequencing of the HM13 locus targeted by CRISPR-Cas9. The locus was amplified by PCR and the products cloned into ZeroBlunt TOPO vectors and Sanger sequenced. This clone exhibited a 1 bp deletion in all 15 sequenced clones.
Extended Data Fig. 2
Extended Data Fig. 2. Validation of the EpiScan approach
(a) Peptide pulsing experiments in TAP-deficient cells expressing H2-Kb (left) or a humanized version of the murine H2-Kb wherein the B2M interacting domain was replaced with the human equivalent (right); a pan-H2 antibody was used for flow cytometry. Cells were plated into serum-free media and treated with the indicated peptides at the indicated concentration for 24 h, and then subjected to flow cytometry to measure cell surface MHC class I levels. N = 3 biological replicates. (b-c) EpiScan SPP-KO or SPP sufficient cells expressing either HLA-A*02 (b) or HLA-A*03 (c), respectively, were transduced with the EpiScan vector expressing the indicated peptides and cell surface MHC class I levels were measured by flow cytometry. N = 9 for A*02 and n = 3 for A*03. (d-f) Peptide pulsing experiments in TAP-deficient cells expressing the indicated alleles. (d) HLA-A*02-expressing cell lines were stained with A2 antibody. T2 cells endogenously express HLA-A*02 and are TAP1/2 deficient. UL49.5 is a viral gene whose product inhibits TAP1/2. (e) C1R cells are MHC class I deficient and TAP1/2 was knocked out. The indicated HLA-A*03-expressing cell lines were stained with a pan-HLA-I antibody. (f) The indicated HLA-A*03-expressing cell lines were stained with B2M antibody. For all panels, data are represented as mean ± SEM of the fold change in mean fluorescence intensity (MFI) relative to the average of the vehicle controls. *p < 0.05, **p < 0.01, ***p<0.001, ****p < 0.0001 for each group relative to vehicle control by one-way ANOVA with Dunnett’s multiple-comparison test. Each dot represents a different biological replicate for all panels. Unless otherwise stated, MHC class I null cells were used and then the indicated allele was re-introduced via lentiviral transduction.
Extended Data Fig. 3
Extended Data Fig. 3. EpiScan optimization.
(a-c) Examining the role of ERAP1 and ERAP2 in the processing of exogenous peptides delivered to the ER. EpiScan SPP WT cells, with or without exogenous ERAP1/2 complementation, expressing the indicated MHC class I alleles and EpiScan vectors expressing the indicated peptides and MHC class I levels assessed by flow cytometry using the indicated antibodies. Data are biological replicates, mean±SEM of the fold change (FC) in mean fluorescence intensity (MFI) relative to the average of negative control (NC) peptides, PRKLPKLGP and RDGCK. *p<0.05, **p<0.01, ***p<0.001, ****p<0.0001 for each group relative to RDGCK by one-way ANOVA with Dunnett’s test. (a) ERAP1/2 KO n=5, ERAP1 n=4, and ERAP2, ERAP1/2 n=3. (b) ERAP1/2 KO, ERAP1 n=6, and ERAP2 cDNA, ERAP1/2 n=3. For (c), n=7 for ERAP1/2 KO except for SIINFEKL and SLLNATAIAV which were n=15 and NLVPMVATC n=12, n=4 for ERAP1, ERAP2 and ERAP1/2. (d-f) EpiScan signal-to-noise with chaperone over-expression. Surface MHC class I flow cytometry of EpiScan SPP KO HLA-A*02 cells expressing SIINFEKL (d), SLLNATAIAV (e), and other peptides (f). (f) Data are biological replicates, mean±SEM of the FC in MFI relative to the average of NC peptides. For deadTAP1/2 and no cDNA n=6. For TAPBP and TAPBPR, n=10, except for NLVPMVATV and SLLNATAIAV n=6 and ELAGIGILTV n=14. **p<0.01, ****p<0.0001 by two-way ANOVA for the no cDNA cells relative to other conditions. Symbols indicate the highest p-value for the comparisons within a peptide. (g and h) Signal peptidase cleavage accuracy. (g) Schematic of potential signal peptidase cleavage events. (h) Flow cytometry for surface MHC class I was performed on EpiScan SPP KO HLA-A*02 cells expressing peptides as shown, with an additional glycine, or without the initial glycine. Data are biological replicates, n =6, mean±SEM of the FC in MFI relative to the NC peptide average. *p<0.05, **p<0.01, ***p<0.001, ****p<0.0001 by two-way ANOVA for the wild-type 9-mer peptides relative to either (-G) or (+G) peptides. (i) EpiScan A*03:01 compared to IEDB stability data, and Spearman correlation. Data are mean±SEM of the FC in MFI relative to the NC peptide average, n=3. Below, the average absolute correlation of the data shown relative to other IEDB datasets with the same peptides.
Extended Data Fig. 4
Extended Data Fig. 4. Digital droplet PCR, EpiScan sorting schematics, and shared allele peptide validation.
(a) Digital droplet PCR of EpiScan gDNA input libraries quantifying the average copy number of EpiScan vectors per cell. Data are represented as mean ± SEM puromycin resistance gene positive droplet number normalized relative to the positive drop number for a control genomic sequence, RPP30. N = 3 of technical replicates. (b-j) Sorting strategy for the random 9-mer EpiScan screens and HLA-B*57:01 abacavir comparison. EpiScan cells were infected with lentiviral vectors expressing the random 9-mer library and GFP, selected with puromycin and sorted into four bins. After five days in culture, the sorted cells were stained and analyzed by flow cytometry to assess enrichment elevated cell surface MHC class I. (b) First, cells are gated away from debris. (c) Doublets are excluded. (d) Dead cells (propidium iodide positive) are excluded. (e) Cells expressing the EpiScan vector (GFP positive) are selected. The alleles assayed were (f) HLA-A*02:01, (g) HLA-B*08:01, (h) HLA-A*03:01, (i) HLA-B*57:01, and (j) HLA-B*57:01 after 48 h abacavir treatment at 6 μM. Except for the HLA-B*57:01 screen in the presence of abacavir, all screens were performed in duplicate. (k and l) Logoplots summarize the composition of the peptide ligands identified in HLA-B*57:01-expressing cells, either untreated (j) or treated with abacavir for 48 h (k). (m) Cell sorting results for HLA-A*02:01 with SPP KO. (n) EpiScan validation of peptides that were found to be binders to multiple alleles via screens. Bar colors indicate which alleles was tested, and peptide text colors represent which screening library the hit was derived from. Data are represented as mean ± SEM of the fold change in mean fluorescence intensity (MFI) relative to the average of negative control peptides. Each dot represents a different biological replicate.
Extended Data Fig. 5
Extended Data Fig. 5. EpiScan systematic differences in amino acid representation of MHC class I ligands relative to mass spectrometry.
(a-d) The bar graphs on the left show the fold difference in amino acid representation across all positions and residues for the indicated allele. The bar graphs in the middle and left represent the fold enrichment of cysteine (middle) and proline (right) across each position of MHC class I peptide ligands, relative to the expected frequency based on the overall abundance of cysteine in the random 9-mer library (EpiScan data) or the human proteome (MS data). The MHC class I alleles assayed were (a) HLA-A*02:01, (b) HLA-A*03:01, (c) HLA-B*08:01 and (d) HLA-B*57:01. (e) Peptide tetramer exchange assays on L- versus V-ended 9mer peptides with HLA-A*02:01. Data are from three technical replicates represented as mean ± SEM and curves fit by four parameter nonlinear regression.
Extended Data Fig. 6
Extended Data Fig. 6. Validation of MHC class I ligands expressed by SARS-CoV-2.
(a) SARS-CoV-2 EpiScan SPP-KO screen results for HLA-A*02:01. Scatterplot showing HLA-A*02 peptide ligands concordantly identified across screen replicates. (b) Individual validation of HLA-A*02:01 screen hits in the EpiScan assay. HLA-A*02:01-expressing EpiScan cells were transduced with lentiviral EpiScan vectors expressing the indicated peptides were introduced into HLA-A*02:01-expressing EpiScan cells and cell surface MHC class I levels were measured by flow cytometry. Data are represented as mean ± SEM of the fold change in mean fluorescence intensity (MFI) relative to the average of negative control peptides. Each dot represents a different biological replicate, with n = 6 for the controls and n = 4 for the rest **p = 0.002, ***p = 0.0003, ****p < 0.0001 for each group relative to the SIINFEKL peptide by one-way ANOVA with Dunnett’s multiple-comparison test. (c) SARS-CoV-2 EpiScan screen results for HLA-A*02:01. Scatterplot showing HLA-A*024:02 peptide ligands concordantly identified across screen replicates. (d) Individual validation of HLA-A*24:02 screen hits in the EpiScan assay. Lentiviral vectors expressing the indicated peptides were introduced into HLA-A*24:02-expressing EpiScan cells and an increase in cell surface MHC class I was measured by flow cytometry. Data are represented as mean ± SEM of the fold change in mean fluorescence intensity (MFI) relative to the average of negative control peptides. Each dot represents a different biological replicate, with n = 7 for VYMPASWVMR, QFAPSASAFF, and YFIASFRLF, and n = 8 for the rest. ****p < 0.0001 for each group relative to the SIINFEKL peptide by one-way ANOVA with Dunnett’s multiple-comparison test. (e) Individual validation of HLA-A*03:01 screen hits with less common anchor residues in the EpiScan assay. Lentiviral vectors expressing the indicated peptides were introduced into HLA-A*03:01-expressing EpiScan cells and an increase in cell surface MHC class I was measured by flow cytometry. Data are represented as mean ± SEM of the fold change in mean fluorescence intensity (MFI) relative to the average of negative control peptides. Each dot represents a different biological replicate for n = 3. *p < 0.05, **p < 0.01, for each group relative to the negative control peptides by one-way ANOVA with Dunnett’s multiple-comparison test.
Extended Data Fig. 7
Extended Data Fig. 7. EpiScan of SARS-CoV-2 Spike variants and tetramer staining.
(a) SARS-CoV-2 Spike Variant EpiScan screen results for HLA-A*02:01. Scatterplot showing the difference between wildtype and mutant in EpiScan enrichment for SARS-CoV-2 Spike peptides. Negative log2(fold change) values were set to zero prior to subtraction, and peptide pairs with no difference in log2(fold change) are omitted. Orange circles represent peptides that contain a mutation present in a variant of concern. Circles are grayed out for the peptide pairs in which neither constituent was below the FDR threshold of 0.20. (b) Individual validation of HLA-A*02:01 Spike screen hits in the EpiScan assay. Data are represented as mean ± SEM of the fold change in mean fluorescence intensity (MFI) relative to the average of negative control peptides in red. Spike peptides are arranged from top to bottom by relative screen rank, with peptides on the top ranked higher by Mageck as shown on the right. Each dot represents a different biological replicate, with n = 19 for SLLNATAIAV and NLVPMVATV, n = 15 for SIINFEKL, n = 10 for FQFCNDPFLGV and KLNDLCFTNV, n = 4 for VLYQDVNCTEV, YQDVNCTEV, YLQPRTFLL, and KIADYNYKL, and n = 6 for the rest. **p < 0.01, ***p < 0.001, ****p < 0.0001 for each group relative to the SIINFEKL peptide by one-way ANOVA with Dunnett’s multiple-comparison test. (c) Tetramer staining of CD8 memory T cells. Dot plot values are the percent HLA-A*02:01 tetramer positive CD8+ T cells for convalescent COVID-19 samples (black solid or empty circle, n = 7) and healthy control samples (red, n = 4). On left, SARS-CoV-2 peptides are shown. On the right, ELAGIGILTV and NLPMVATV are positive control peptides derived from MLANA and CMV pp65 proteins, respectively. Dots on the y-axis are zero values that would otherwise not be displayed on a log2 axis.
Extended Data Fig. 8
Extended Data Fig. 8. SARS-CoV-2 EpiScan screen results are enriched for T cell epitopes.
Here, representative EpiScan GSEA plots of previously published SARS-CoV-2 T cell epitope sets are shown. For most of the EpiScan alleles, more than one peptide set from the same allele scored as significant, but only one is shown for demonstration purposes. Full GSEA statistical output from the top five enriched sets of each EpiScan allele are shown in Supplementary Table 6.
Extended Data Fig. 9
Extended Data Fig. 9. Examination of biased-anchor peptide ligands.
(a) Schematic representation of the library design used to examine biased-anchor peptide ligands. The favored residues at each anchor position are shown for the indicated MHC class I allele; peptides selected for characterization by EpiScan contained a favored residue at one of the critical anchor positions but an unfavored residue at the other. (b) Evaluation of biased-anchor binders by EpiScan. The percent of binders for the given fixed residues at each anchor position are shown. (c) Logoplots summarize the sequences of the MHC class I ligands identified by EpiScan for HLA-A*02:01 where the ninth position has been fixed with either leucine or valine and isoleucine, leucine, methionine and valine are excluded from the second position. (d) Statistical analysis of the residues at the fourth position of biased-anchor HLA-A*02:01 ligands identified by EpiScan that ended with either L or V. A positive percent difference indicates a larger fraction of that amino acid occurred in L-ended peptides relative to V-ended peptides. P-values were determined by a two-tailed Fisher’s exact test, comparing amino acids at the fourth position across the two conditions (only those seen at least seven times are shown). (e to h) Logoplots summarizing the composition of biased-anchor MHC class I ligands identified by EpiScan, wherein one anchor position contains a favored residue but the other anchor position does not: (c) HLA-A*02:01, with positions 2 and 9 as anchors, (d) HLA-A*03:01, with positions 2 and 9 as anchors, (e) HLA-B*08:01, with positions 5 and 9 as anchors, and (f) HLA-B*57:01 with positions 2 and 9 as anchors.
Extended Data Fig. 10
Extended Data Fig. 10. Evaluating the performance of the indicated algorithms by EpiScan.
These algorithms were used to predict the top 50,000 binders for each allele from the human (9-mer) proteome, and EpiScan screens were used to evaluate the accuracy of these predictions. Not all 50,000 top binders for MHCFlurry, NetMHCpan-BA, and MixMHCpred were present in the library and so the overlap between each algorithm’s top 50,000 and those present were used. Overlap for each algorithm/allele: MHCFlurry: A2 – 43973 A3 – 44218 B8 – 35212 B57 - 43746 mixMHCpred: A2 – 31605 A3 – 35217 B8 – 31624 B57 – 40400 NetMHCpan: A2 – 40711 A3 – 42199 B8 – 36766 B57 - 44541
Fig. 1.
Fig. 1.. Genetic identification of MHC class I ligands using the EpiScan platform.
(a-d) Schematic representation of the EpiScan approach. In wild-type cells (a), proteasome-derived peptides are imported into the ER by the TAP complex, trimmed by the N-terminal peptidases ERAP1 and ERAP2 and loaded onto MHC class I molecules for presentation on the cell surface. In the absence of TAP (b), however, MHC class I peptide loading is impaired; empty MHC class I molecules remain in the ER and cell surface MHC class I levels decrease. Under these conditions, delivery of exogenous peptide into the ER that binds MHC class I restores cell surface MHC class I levels (c). Exogenous peptides are targeted to the ER using the lentiviral EpiScan vector (d), which expresses a putative MHC class I ligand downstream of a signal peptide. (e-j) Validation of the EpiScan approach. EpiScan cells expressing either a humanized H-2Kb allele (e and f), HLA-A*02 (g and h) or HLA-A*03 (i and j) were transduced with the EpiScan vector expressing the indicated peptides and cell surface MHC class I levels were measured by flow cytometry. Representative histograms are shown in (e), (g) and (i); the data shown in (f), (h) and (j) represent the mean ± SEM of the fold change in mean fluorescence intensity (MFI) relative to the average of the negative controls for that experiment. Peptides shown in blue represent negative controls; peptides shown in red or orange represent positive controls. Peptides are color-coded such that histograms display representative data of the corresponding plot results. (f) Each dot represents a different biological replicate, n = 6. (****p < 0.0001 relative to the PRKLPKLGP negative control peptide, one-way ANOVA with Dunnett’s multiple-comparison test). (h and j) EpiScan data is compared to IEDB affinity data with the Spearman correlation shown on the graph. Below is the average absolute correlation of the affinity data shown relative to other IEDB datasets with the same peptides. For (h), n = 4 independent biological replicates. For (j), n = 3 independent biological replicates.
Fig. 2.
Fig. 2.. EpiScan pooled screening allows high-throughput MHC class I ligand discovery.
(a) Schematic representation of the screening procedure. A pool of random oligonucleotides encoding 9-mer peptides were cloned into the EpiScan lentiviral vector and introduced into EpiScan cells expressing a single HLA allele. Cells expressing exogenous peptides binding MHC class I that hence exhibited elevated cell surface MHC class I levels were isolated by FACS and the identity of the peptides revealed by next-generation sequencing. The left dot plot displays two separate samples; light blue dots represent negative control EpiScan cells prior to transduction, while red dots show EpiScan cells expressing the library of exogenous peptides. (b and c) EpiScan screens recapitulate known binding preferences for common MHC class I alleles. Logoplots summarize the sequences of the MHC class I ligands identified by EpiScan (b); for comparison, analogous logoplots based on MHC class I ligands identified by mass spectrometry are shown in (c). (d) Histograms show cell surface MHC class I levels on EpiScan cells expressing the indicated MHC class I alleles with (left) or without (right) SPP. (e) Logoplot summarizing the composition of the HLA-A*02:01 ligands identified by EpiScan screens using SPP-deficient EpiScan cells.
Fig. 3.
Fig. 3.. EpiScan and mass spectrometry represent complementary approaches for MHC class I ligand identification.
(a) EpiScan- and MS-identified peptides reveal similar MHC class I binding preferences. Clustergram represents the pairwise correlation coefficients comparing the MHC class I ligands identified by EpiScan (ES) and MS; correlations were calculated by linearizing a matrix of amino acid frequencies for each of the nine positions of the peptides after normalization for background amino acid frequency for the EpiScan random 9mer library or the human proteome. (b and c) Effective detection of cysteine-containing MHC class I ligands by EpiScan. (b) Cysteine is greatly enriched among MHC class I ligands identified by EpiScan compared to MS. (c) Cysteine is observed at approximately the expected frequency across MHC class I ligands identified by EpiScan, while it is depleted across all positions if MS-identified MHC class I ligands. (d) Individual EpiScan validation that cysteine-containing peptides bind HLA-A*03. The indicated peptides, that were not predicted to bind HLA-A*03 by NetMHC, were introduced into HLA-A*03-expressing EpiScan cells and cell surface MHC class I levels measured by flow cytometry. Positive and negative control peptides are shown in red and blue respectively. Data are represented as mean ± SEM of the fold change in mean fluorescence intensity (MFI) relative to the average of two negative control peptides, PRKLPKLGP and SIINFEKL. Each dot represents a different biological replicate, n = 3. ***p = 0.008, ****p < 0.0001 for each group relative to SIINFEKL by one-way ANOVA with Dunnett’s multiple-comparison test. (e-g) Comparison of the affinity of L- and V-ended 9mers for HLA-A*02. (e) Leucine is more frequently observed in the 9th position in MS data than in EpiScan data. V-ended 9mer peptides increase surface MHC class I levels in EpiScan cells expressing HLA-A*02 following either the exogenous peptide expression through lentiviral EpiScan vector transduction (f) or addition of synthesized peptides to the medium (g). Data are represented as mean ± SEM of the fold change in MFI of V-ended peptides over L-ended peptides. Dots represent different biological replicates, for (f) n = 5 except for NLVPMVAT_ n =3, and for (g) n = 4 except for GMLNYVDS_ n = 8. *q < 0.05, **q < 0.01 for V-ended versus L-ended peptides via Mann-Whitney U-test with two-stage step-up (Benjamini, Krieger, and Yekutieli) multi-hypothesis correction.
Fig. 4.
Fig. 4.. Comprehensive identification of MHC class I ligands expressed by SARS-CoV-2.
(a-f) EpiScan analysis of the SARS-CoV-2 immunopeptidome. All possible 9-, 10- and 11-mer peptides encoded by the SARS-CoV-2 genome (a) were synthesized via an oligonucleotide array, cloned into the lentiviral EpiScan vector, and MHC class I ligands identified by the EpiScan screening procedure described previously (b). In total, 11 alleles were screened; the proportion of the US population represented by these alleles is indicated in (c). (d) Peptide length distribution of hits from all alleles. (e) ORF length versus high-confidence binders per ORF. R-squared value is derived from the linear regression goodness of fit. (f) The number of high-confidence binders per allele; cysteine-containing peptides are highlighted in purple. (g) Comparison of HLA-A*02:01 SARS-CoV2 peptides identified by mass spectrometry of EpiScan cells sorted for high MHC class I levels to EpiScan screen results. R-squared value was derived from the linear regression goodness of fit. P-value was calculated via Spearman correlation. (h) Convalescent COVID-19 patients harbor CD8+ T cells specific for HLA-A*02 ligands identified by EpiScan. Dot plot values represent the percent tetramer positive CD8+ T cells from convalescent COVID-19 (n = 7) expressed relative to the mean value of the COVID-19 negative samples (n = 4). Each dot represents a different COVID-19 patient sample.
Fig. 5.
Fig. 5.. Computational prediction of MHC class I ligands from EpiScan data and assessment of performance.
(a) Schematic representation of the neural network architecture employed for the EpiScan Predictor (ESP) models (adapted from ref. ). (b) Predictive power of the ESP (left) and MSi (right) models. Each dot represents the PPV from a different cross-validation set and the bar represents the mean. ESP was evaluated on EpiScan data and MSi was evaluated on mass spectrometry data. For ESPv1 n = 30, for ESPv2 n = 10, for MSi n = 1. (c) Performance of EpiScan screens when predicting binders in IEDB datasets. Each dot represents the PPV of a distinct IEDB dataset and the bars represent mean ± SEM. N = 12 for A*02, n = 6 for A*03, n = 3 for B*08, and n = 2 for B*57. (d) The accuracy of the top 50,000 ESPv1 predictions from the human proteome as determined by EpiScan. (e) Comparison of algorithm performance for predicting binders as determined by EpiScan for the top 0.48% ranked 9mer peptides of the human proteome of each algorithm. # denotes algorithms that were trained on EpiScan screen data: ESPv1 was trained on the random 9mer library and ESPv2 was trained on the retraining library. (f) Performance of the indicated MHC class I ligand prediction algorithms when predicting binders in IEDB datasets. Each dot represents the PPV of a distinct IEDB dataset and the bars represent mean ± SEM. *p < 0.05, **p = 0.0066, for each group relative to one another by two-way Friedman’s test with Dunn’s multiple hypothesis test correction. # denotes algorithms that were trained partially, or exclusively, on IEDB binding affinity data. N = 11 for A*02, n = 7 for A*03, n = 3 for B*08, and n = 2 for B*57. (g) The percent of the top 50,000 predicted 9mer peptides of the human proteome that contain cysteine for the indicated algorithms. The dotted line indicates the percentage of 9mer peptides that should contain cysteine given its frequency in the proteome.

References

    1. Chaplin DD Overview of the immune response. J. Allergy Clin. Immunol 125, S3–23 (2010). - PMC - PubMed
    1. Rock KL et al. Inhibitors of the proteasome block the degradation of most cell proteins and the generation of peptides presented on MHC class I molecules. Cell 78, 761–771 (1994). - PubMed
    1. Neefjes J, Jongsma MLM, Paul P & Bakke O Towards a systems understanding of MHC class I and MHC class II antigen presentation. Nat. Rev. Immunol 11, (2011). - PubMed
    1. Shen L, Sigal LJ, Boes M & Rock KL Important role of cathepsin S in generating peptides for TAP-independent MHC class I crosspresentation in vivo. Immunity 21, 155–165 (2004). - PubMed
    1. Embgenbroich M & Burgdorf S Current concepts of antigen cross-presentation. Frontiers in Immunology vol. 9 1643 (2018). - PMC - PubMed

Methods-only References

    1. Martin M Cutadapt removes adapter sequences from high-throughput sequencing reads. EMBnet.journal 17, 10 (2011).
    1. Langmead B & Salzberg SL Fast gapped-read alignment with Bowtie 2. Nat. Methods 9, 357–359 (2012). - PMC - PubMed
    1. Kim Y, Sidney J, Pinilla C, Sette A & Peters B Derivation of an amino acid similarity matrix for peptide:MHC binding and its application as a Bayesian prior. BMC Bioinformatics 10, 394 (2009). - PMC - PubMed
    1. Bremel RD & Homan EJ An integrated approach to epitope analysis I: Dimensional reduction, visualization and prediction of MHC binding using amino acid principal components and regression approaches. Immunome Res. 6, 7 (2010). - PMC - PubMed
    1. Ashkenazy H, Erez E, Martz E, Pupko T & Ben-Tal N ConSurf 2010: Calculating evolutionary conservation in sequence and structure of proteins and nucleic acids. Nucleic Acids Res. 38, (2010). - PMC - PubMed

Publication types

MeSH terms