Review
. 2023 Jan 2;20(1):1.
doi: 10.1186/s12014-022-09388-4.

A proteomic profile of the healthy human placenta

Affiliations
Review

A proteomic profile of the healthy human placenta

Samprikta Manna et al. Clin Proteomics. .

Abstract

Background: The placenta remains one of the least studied organs within the human body. Yet, placental dysfunction has been associated with various pregnancy complications leading to both maternal and fetal death and long-term health consequences. The aim of this study was to characterise the protein networks of healthy term placental sub-anatomical regions using label free quantification mass spectrometry.

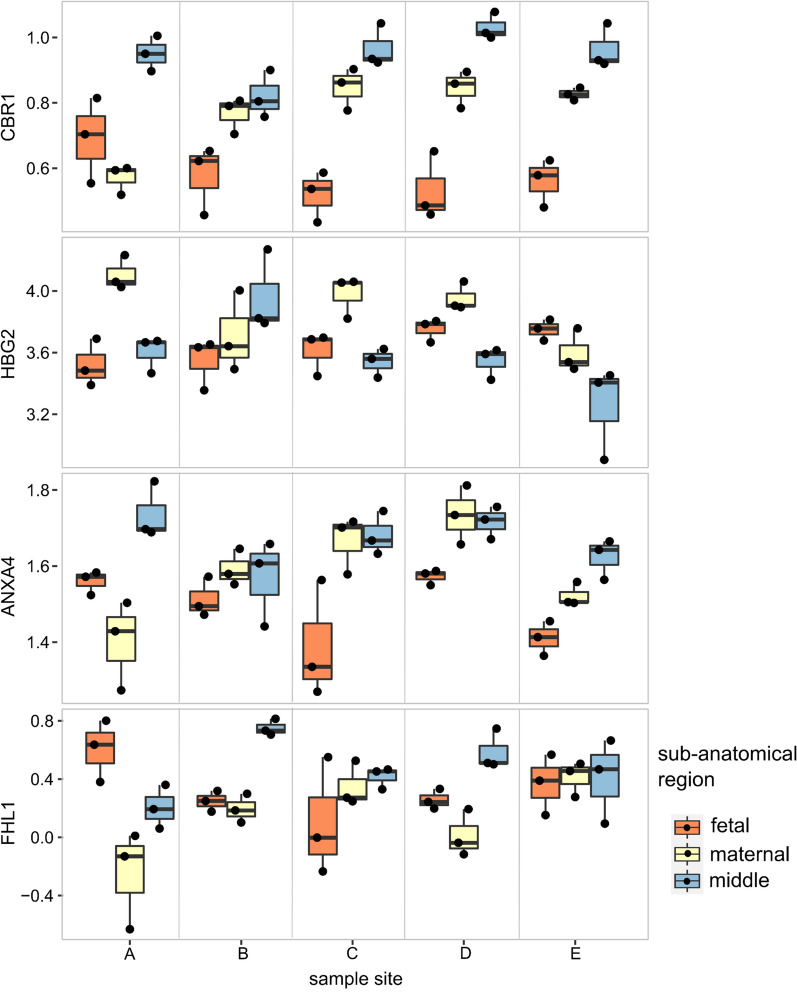
Methods: Three healthy placentae were sampled at five sample sites and each biopsy was dissected into maternal-, middle-, and fetal- sub-anatomical regions. Quadrupole-orbitrap mass spectrometer was used in data dependant analysis mode to identify 1859 unique proteins before detailed differential expression between regions.

Results: Protein profiling identified 1081, 1086, and 1101 proteins in maternal, middle, and fetal sub-anatomical regions respectively. Differentially expressed proteins were identified considering the effect between sample site location and sub-anatomical region on protein expression. Of these, 374 differentially expressed proteins (Two-way ANOVA adjusted p-value < 0.05, HSD Tukey adjusted p-value 0.05) were identified between sample site locations and sub-anatomical regions. The placenta specific disease map NaviCenta ( https://www.sbi.uni-rostock.de/minerva/index.xhtml?id=NaviCenta ) was used to focus functional analysis results to the placenta specific context. Subsequently, functional analysis with a focus on senescence, and mitochondrial function were performed. Significant differences were observed between sub-anatomical regions in protein intensity and composition. A decrease in anti-senescent proteins within the maternal sub-anatomical region, and an increase in proteins associated with a switch from ATP to fatty acid consumption as a source of energy between middle and fetal sub-anatomical regions were observed.

Conclusion: These results suggest that normal proteomic variations exist within the anatomical structure of the placenta, thus recommending serial sectioning methodology for consistent placental research.

Keywords: Bioinformatics; Disease map; Network analysis; Placenta; Proteomics; Systems biology.


Conflict of interest statement

Authors report no conflict of Interest.

Figures

Fig. 1
Fig. 1
Venn diagram of identified proteins in middle, fetal, and maternal regions. Proteins identified in exclusively one sub-anatomical region are listed next their respective sub-anatomical region
Fig. 2
Fig. 2
The top four proteins FHL1, ANXA4, HBG2, CBR1 show the strongest interaction between protein content in sub-anatomic regions and sample sites. Interaction was defined as two-way ANOVA adj p val < 0.05. Samples were sorted according to sample site and colour coded according to sub-anatomical region
Fig. 3
Fig. 3
ClueGO functional analysis of differentially expressed proteins (DEP) between maternal, middle, and fetal sub-anatomical regions. Significantly (adj. p < 0.05) overrepresented biological process (A) and molecular function (B). GO terms can be grouped by similarity, in which case only the group GO term is legible. The size of nodes indicates the number of proteins encoding genes falling into each term. Similarity or hierarchic relationship between GO terms is indicated by edges
Fig. 4
Fig. 4
Mitochondria associated DEPs and their functional analysis. A Venn diagram of DEPs of maternal vs fetal, maternal vs middle, middle vs fetal, and proteins and genes associated with mitochondrial functions and processes from the databases MitoXplorer, human protein atlas (HPA)—mitochondria specific, and MitoCarta V3.0. The section of proteins used for further analysis is within the red border. B GO biological processes included and figure legend to C. GOCircle plots of the 10 most significantly overrepresented mitochondria associated with GO biological process terms, including DEPs falling into each term. Regulation direction is colour coded: upregulated (red), downregulated (blue). Size of the inner segments is indicative of the number of proteins falling into each term. The colour of each inner segment indicates the z-score—general up or downregulation of the GO term considering the number up- and downregulated proteins. D Clustered heatmap of average normalized LFQ intensities of mitochondria associated DEPs. Proteins are grouped into samples from maternal, middle, fetal sub-anatomical regions
Fig. 5
Fig. 5
Senescence associated DEPs and their functional analysis. A Venn diagram of DEPs of maternal vs fetal, maternal vs middle, middle vs fetal, and proteins and genes associated with mitochondrial functions and processes from the databases CellAge, CSGene, and NCBI database results for the keyword senescence. The section of proteins used for further analysis is within the red border. B GOCircle plots of the 10 most significantly overrepresented GO biological process terms, including senescence associated DEPs falling into each term. Regulation direction is colour coded: upregulated (red), downregulated (blue). Size of the inner segments is indicative of the number of proteins falling into each term. The colour of each inner segment indicates the z-score—general up or downregulation of the GO term considering the number up- and downregulated proteins

References

    1. Mossman HW. Comparative morphogenesis of the fetal membranes and accessory uterine structures. Placenta. 1991;12(1):1–5. doi: 10.1016/0143-4004(91)90504-9. - DOI - PubMed
    1. Burton GJ, Fowden AL. The placenta: a multifaceted, transient organ. Philos Trans R Soc Biol Sci. 2015;370(1663):20140066. doi: 10.1098/rstb.2014.0066. - DOI - PMC - PubMed
    1. Khorami Sarvestani S, Shojaeian S, Vanaki N, Ghresi-Fard B, Amini M, Gilany K, et al. Proteome profiling of human placenta reveals developmental stage-dependent alterations in protein signature. Clin Proteomics. 2021;18(1):18. doi: 10.1186/s12014-021-09324-y. - DOI - PMC - PubMed
    1. Woods L, Perez-Garcia V, Hemberger M. Regulation of Placental Development and Its Impact on Fetal Growth—New Insights From Mouse Models. Front Endocrinol. 2018;9:570. doi: 10.3389/fendo.2018.00570. - DOI - PMC - PubMed
    1. Maltepe E, Penn AA. Development, Function, and Pathology of the Placenta. In: Gleason CA, Juul SE, editors. Avery's Diseases of the Newborn. 10. Philadelphia: Elsevier; 2018. pp. 40–60.e8.

LinkOut - more resources