. 2023 Jan 2;20(1):1.
doi: 10.1186/s12974-022-02688-4.

Extracellular vesicles from mesenchymal stem cells reduce neuroinflammation in hippocampus and restore cognitive function in hyperammonemic rats

Affiliations

Extracellular vesicles from mesenchymal stem cells reduce neuroinflammation in hippocampus and restore cognitive function in hyperammonemic rats

Paula Izquierdo-Altarejos et al. J Neuroinflammation. .

Abstract

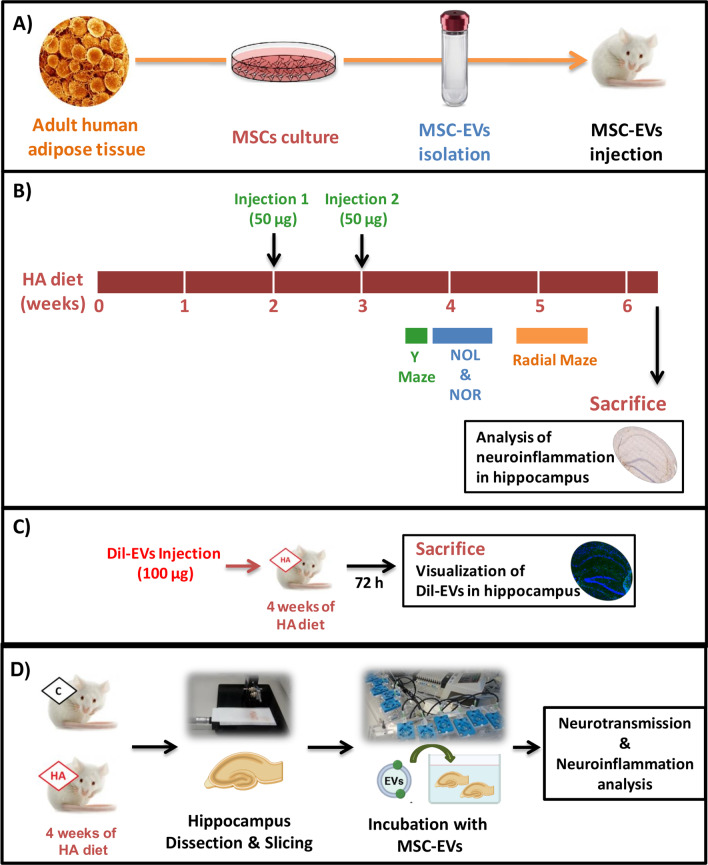
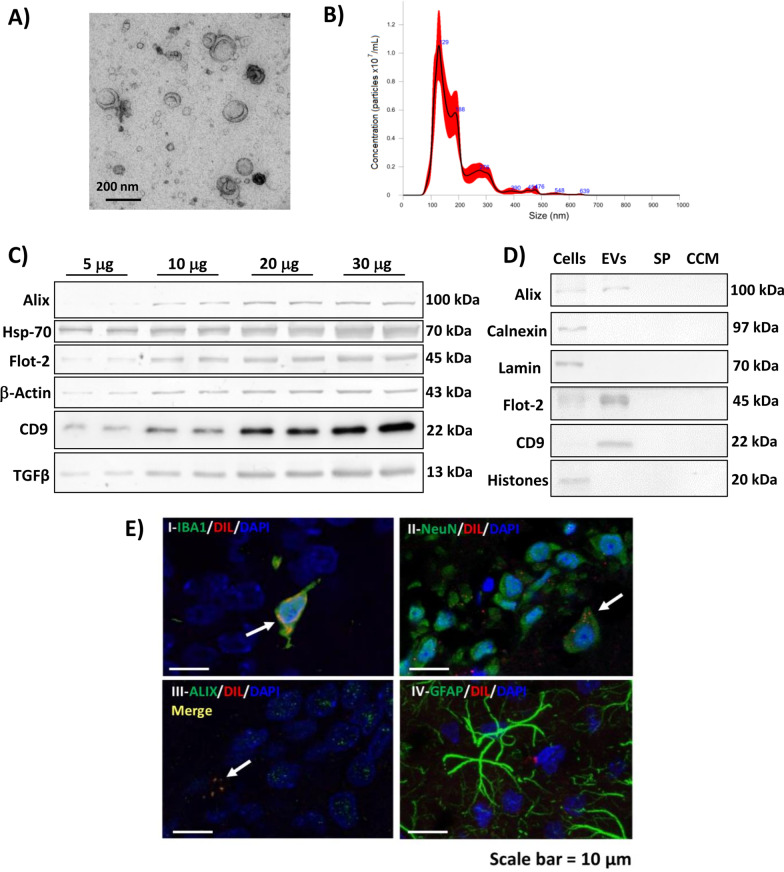
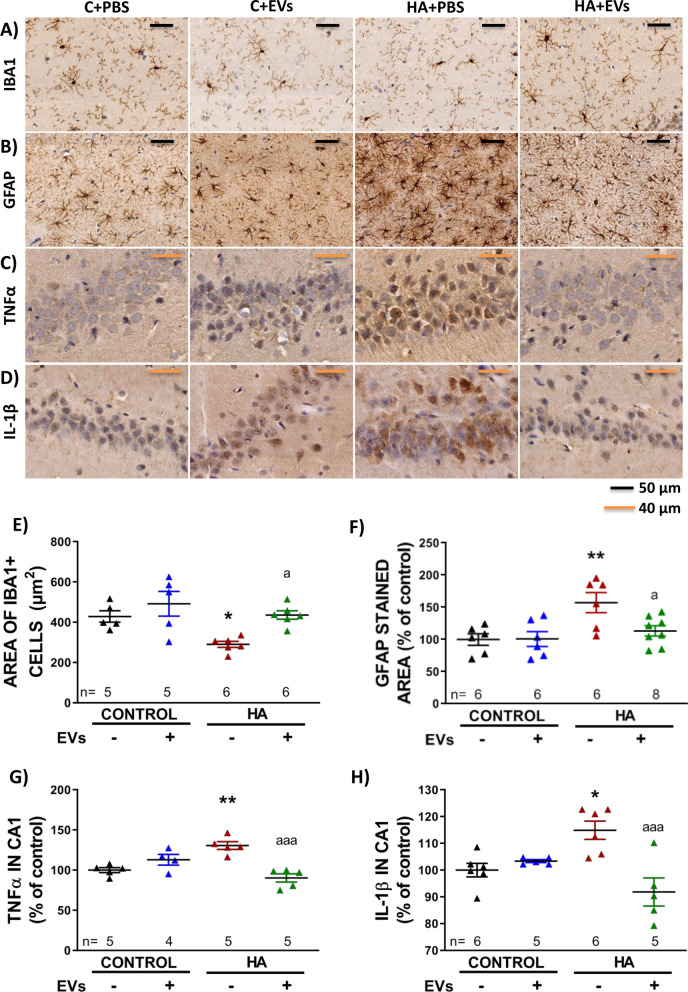
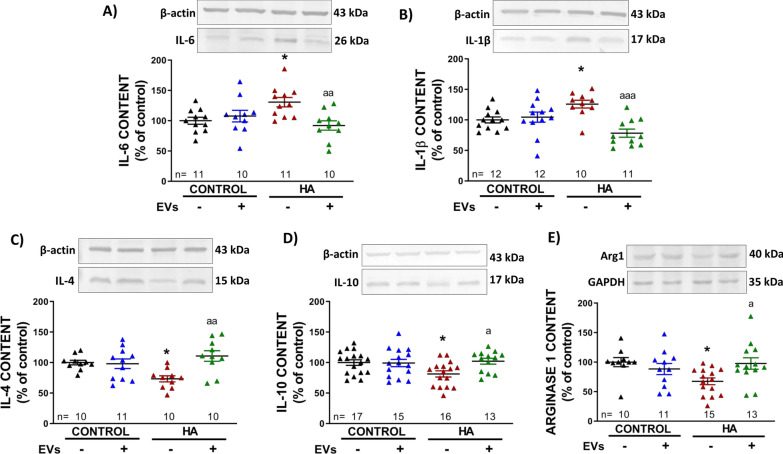
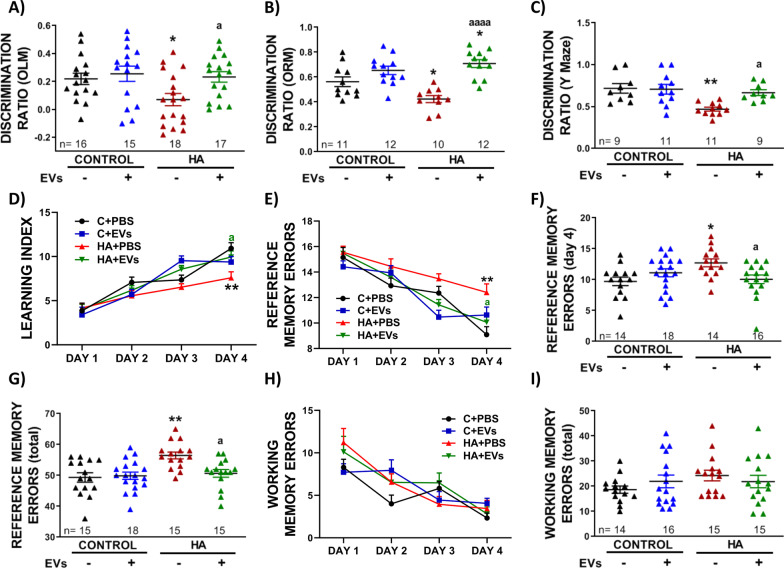
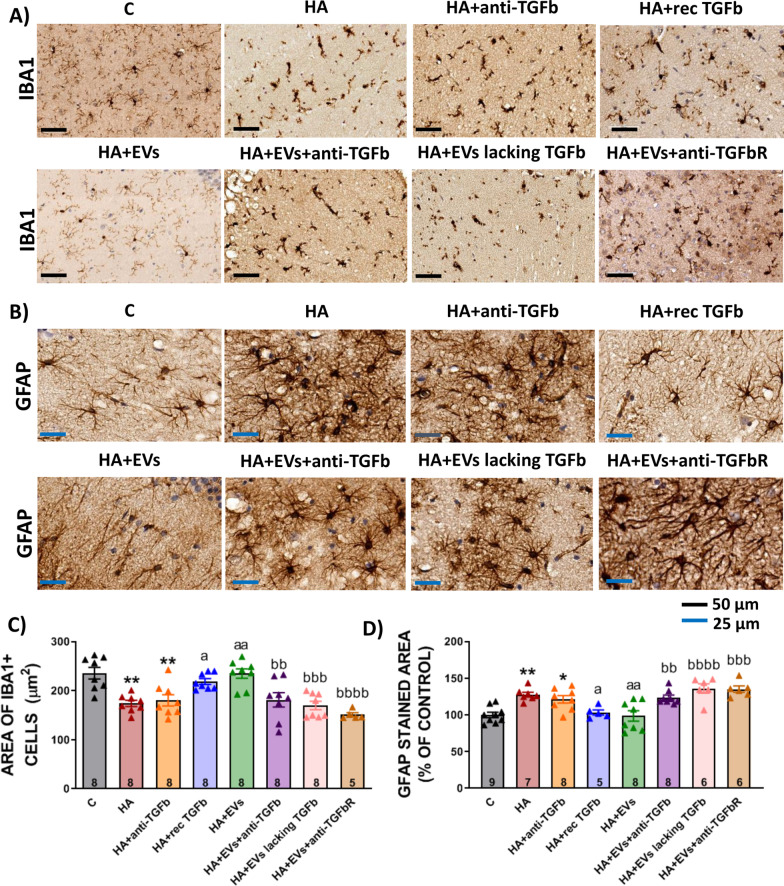
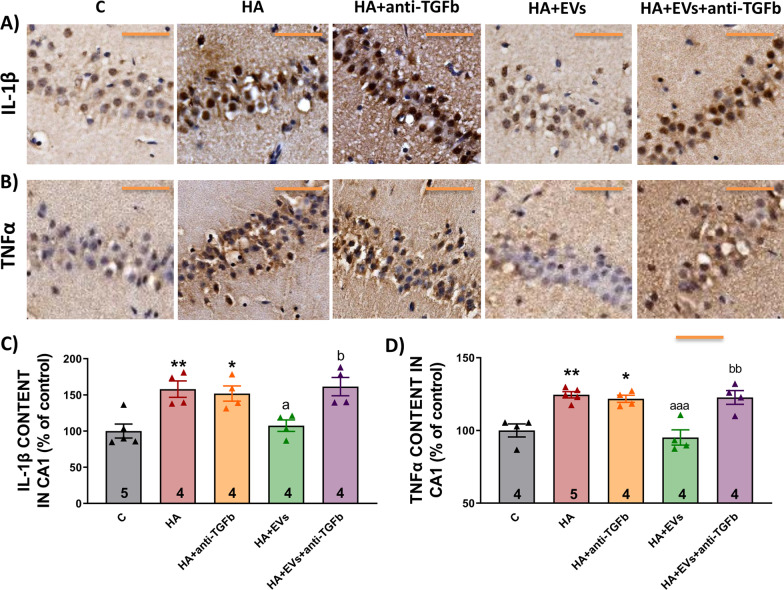
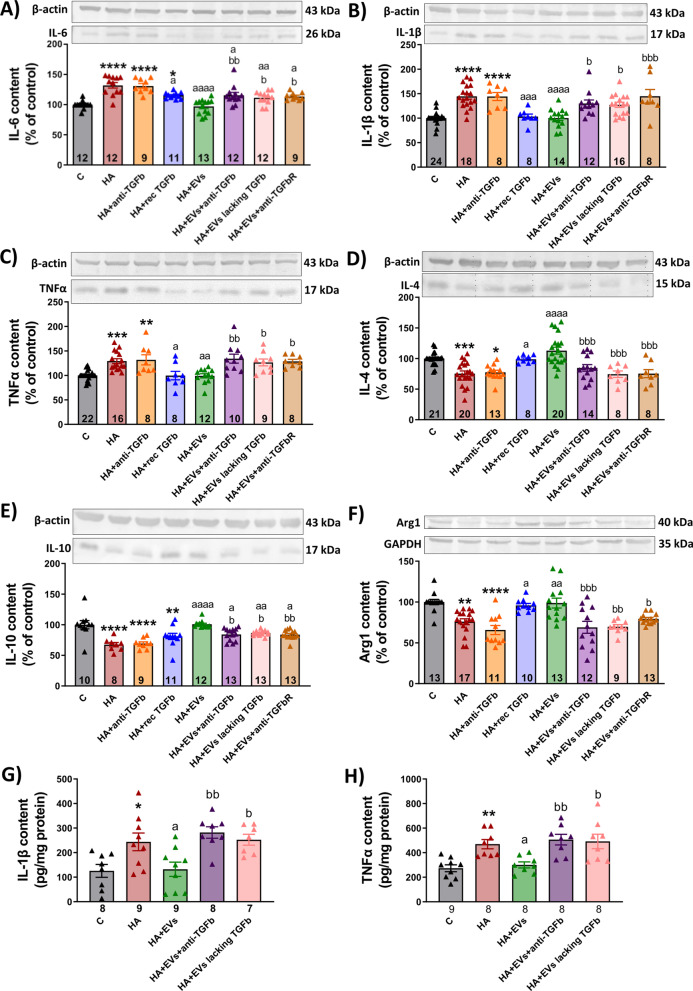
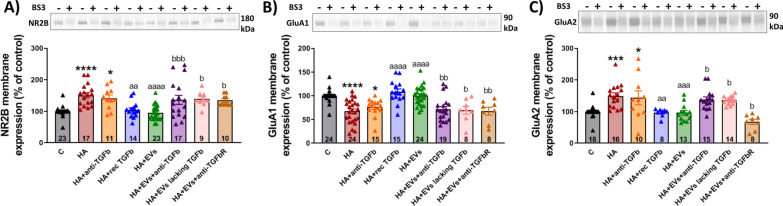
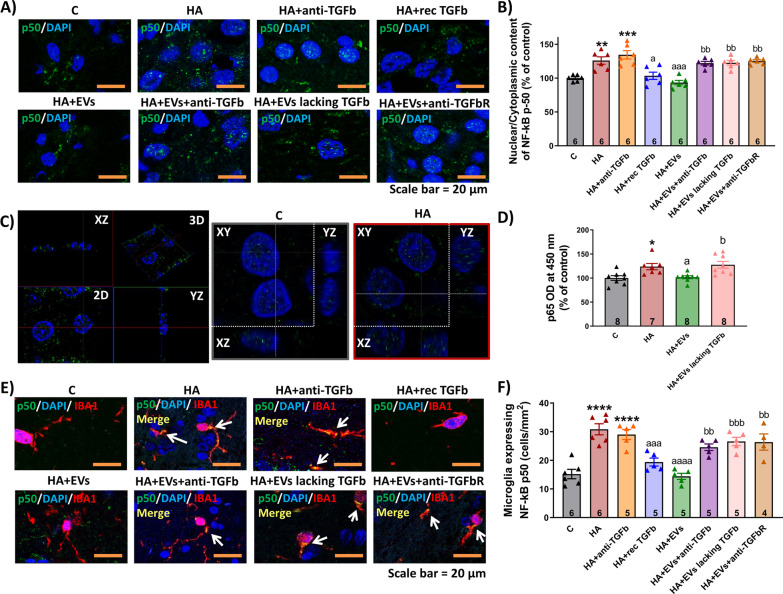
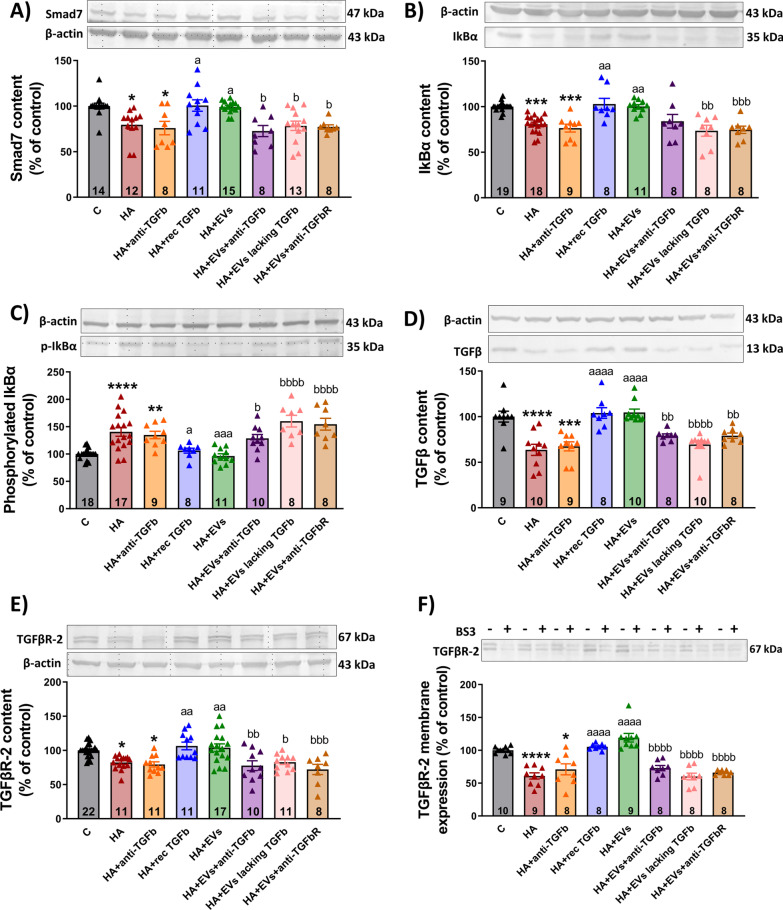
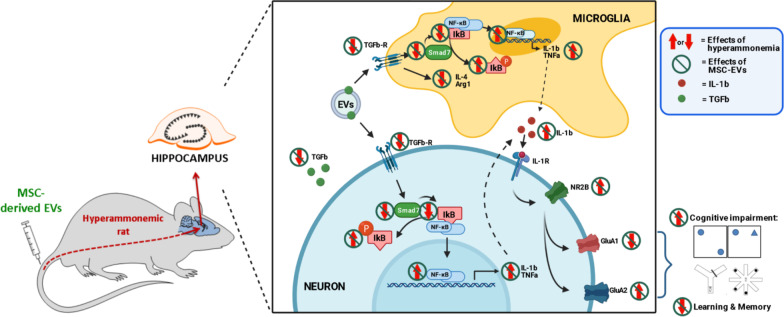
Chronic hyperammonemia, a main contributor to hepatic encephalopathy (HE), leads to neuroinflammation which alters neurotransmission leading to cognitive impairment. There are no specific treatments for the neurological alterations in HE. Extracellular vesicles (EVs) from mesenchymal stem cells (MSCs) reduce neuroinflammation in some pathological conditions. The aims were to assess if treatment of hyperammonemic rats with EVs from MSCs restores cognitive function and analyze the underlying mechanisms. EVs injected in vivo reach the hippocampus and restore performance of hyperammonemic rats in object location, object recognition, short-term memory in the Y-maze and reference memory in the radial maze. Hyperammonemic rats show reduced TGFβ levels and membrane expression of TGFβ receptors in hippocampus. This leads to microglia activation and reduced Smad7-IkB pathway, which induces NF-κB nuclear translocation in neurons, increasing IL-1β which alters AMPA and NMDA receptors membrane expression, leading to cognitive impairment. These effects are reversed by TGFβ in the EVs from MSCs, which activates TGFβ receptors, reducing microglia activation and NF-κB nuclear translocation in neurons by normalizing the Smad7-IkB pathway. This normalizes IL-1β, AMPA and NMDA receptors membrane expression and, therefore, cognitive function. EVs from MSCs may be useful to improve cognitive function in patients with hyperammonemia and minimal HE.

Keywords: Cognitive impairment; Extracellular vesicles; Hyperammonemia; Mesenchymal stem cells; Neuroinflammation.


Conflict of interest statement

All authors declare that they have no competing interests.

Figures

Fig. 1
Fig. 1
Study design. A Human adipocyte derived mesenchymal stem cells (MSCs) were cultured and extracellular vesicles were isolated from the culture media. B After 2 weeks of starting the hyperammonemic diet, HA and control rats were intravenously injected in the tail vein either with 50 µg of protein of isolated vesicles from MSCs or PBS as vehicle. A second injection was performed one week later. Behavioral tests (Y-maze, novel object location, novel object recognition and 8-radial maze) were performed 10–20 days after first injection to assess cognitive function. Rats were killed during week 6 of hyperammonemia to extract the brain for neuroinflammation analysis. C We injected fluorescently labeled EVs into different rats with 4 weeks of HA (n = 2). Rats were killed after 3 days and hippocampi were extracted to assess whether fluorescent EVs reach this area. D Ex vivo experiments were performed to investigate the molecular pathways involved: control and HA rats were killed and the hippocampi were dissected and sliced. Hippocampal slices from HA rats were incubated with EVs derived from MSCs during 30 min. Control and HA slices without EVs incubation were included as reference. Additional pre-treatments of the MSC-EVs and controls were included (see “Materials and methods” section). After the incubation, slices were processed for neurotransmission and neuroinflammation analysis
Fig. 2
Fig. 2
Characterization of extracellular vesicles isolated from human adipocyte derived mesenchymal stem cells. A Representative image of EVs obtained by transmission electron microscopy after negative staining. B Representative size profile of EVs obtained by Nanoparticle tracking analysis. C Representative image of EV markers (Alix, Hsp70, Flotillin-2, CD9), β-actin and TGFβ measured by western blot with different quantities of initial protein. D Western blot bands of EV markers (Alix, Flotillin-2 and CD9) and non-EV markers (calnexin, lamin and histones) in origin cell lysates, EVs, supernatant discarded in the last ultracentrifugation step of the EVs isolation procedure (SP) and cell culture medium (CCM). E Intravenously injected Dil-labeled extracellular vesicles (red) reach the hippocampus of HA rats after 72 h. Co-localization was found with I microglia and II neurons in the pyramidal layer. III Red fluorescence signal co-localizes with Alix, a marker of extracellular vesicles. IV No clear co-localization was found with astrocytes. Scale bar = 10 µm
Fig. 3
Fig. 3
Injected EVs reverse microglial and astrocytic activation and expression of pro-inflammatory markers TNFα and IL-1β in hippocampus. Representative images of A immunohistochemistry against Iba-1 and B GFAP in hippocampus and C TNFα and D IL-1β in CA1 region. E Area of Iba1-stained cells (n = 5–6) and F percentage of area stained with GFAP (n = 6–8) in hippocampus. G Content of TNFα (n = 4–5) and H IL-1β (n = 5–6) in CA1 region of hippocampus, expressed as percentage of controls. One-way ANOVA with Tukey post hoc test was performed to compare all groups. Values are the mean ± SEM. Values significantly different from controls are indicated by asterisk (*p < 0.05; **p < 0.01) and values significantly different between HA + PBS and HA + EVs groups are indicated by a (a = p < 0.05; aaa = p < 0.001). Sample size of each group is indicated at the bottom of the bars
Fig. 4
Fig. 4
Analysis of neuroinflammation in hippocampus of injected rats analyzed by Western blot. Content of A IL-6 (n = 10–11), B IL-1β (n = 10–12), C IL-4 (n = 10–11), D IL-10 (n = 13–17) and E Arginase1 (n = 10–15) in hippocampi homogenates. Representative images of the blots of each protein and the load control (β-actin or GAPDH for Arginase1) are shown. One-way ANOVA with Tukey post hoc test was performed to compare all groups. Values are expressed as percentage of protein content in PBS-injected control rats and are the mean ± SEM. Values significantly different from controls are indicated by asterisk (*p < 0.05) and values significantly different between HA + PBS and HA + EVs groups are indicated by a (a = p < 0.05; aa = p < 0.01; aaa = p < 0.001). Sample size of each group is indicated at the bottom of the bars
Fig. 5
Fig. 5
Injection of MSC-EVs restores memory and learning impairments found in HA rats. Discrimination ratio in A novel object location (n = 15–18), B novel object recognition (n = 10–12) and C Y-maze test (n = 9–11). The following panels correspond to radial maze (n = 14–18): evolution of D learning index and E number of reference memory errors, F number of reference memory errors at day 4 of the test, G total number of reference memory errors, H evolution of working memory errors and I total number of working memory errors. Values are the mean ± SEM. For sections AC, F, G and I one-way ANOVA with Tukey post hoc test was performed to compare all groups. Values significantly different from control group are indicated by asterisk (*p < 0.05; **p < 0.01) and values significantly different between HA + PBS and HA + EVs groups are indicated by a (a = p < 0.05; aaaa = p < 0.0001). For sections D, E and H two-way ANOVA with Tukey post hoc test was performed to compare all groups. Values significantly different from control group are indicated by asterisk (**p < 0.01) and values significantly different between HA + PBS and HA + EVs groups are indicated by a (a = p < 0.05). Sample size of each group is indicated at the bottom of the bars
Fig. 6
Fig. 6
Incubation with EVs from MSCs reverses microglial and astrocytic activation in hippocampal slices from hyperammonemic rats. Representative images of A immunohistochemistry against Iba-1 and B GFAP in hippocampus. C Area of Iba1 stained cells (n = 5–8) and D percentage of area stained with GFAP, expressed as percentage of controls, (n = 5–9) in hippocampus. One-way ANOVA with Tukey post hoc test was performed to compare all groups. Values are the mean ± SEM. Values significantly different from controls are indicated by asterisk (*p < 0.05, **p < 0.01), values significantly different from HA group are indicated by a (a = p < 0.05, aa = p < 0.01) and values significantly different from HA + EVs group are indicated by b (bb = p < 0.01; bbb = p < 0.001; bbbb = p < 0.0001). Sample size of each group is indicated at the bottom of the bars
Fig. 7
Fig. 7
Incubation with MSC-EVs reduces the expression of pro-inflammatory markers IL-1β and TNFα in hippocampal slices from hyperammonemic rats. Representative images of A IL-1β and B TNFα in CA1 region. C Content of IL-1β (n = 4–5) and D TNFα (n = 4–5) in CA1 region of hippocampus, expressed as percentage of controls. One-way ANOVA with Tukey post hoc test was performed to compare all groups. Values are the mean ± SEM. Values significantly different from controls are indicated by asterisk (*p < 0.05; **p < 0.01), values significantly different from HA group are indicated by a (a = p < 0.05, aa = p < 0.01, aaa = p < 0.001) and values significantly different from HA + EVs group are indicated by b (b = p < 0.05; bb = p < 0.01). Sample size of each group is indicated at the bottom of the bars
Fig. 8
Fig. 8
Incubation with MSC-EVs reduces the content of pro-inflammatory markers and restores the content of anti-inflammatory markers in hippocampal slices from hyperammonemic rats as measured by western blot. Content of A IL-6 (n = 9–13), B IL-1β (n = 8–24), C TNFα (n = 8–22), D IL-4 (n = 8–21), E IL-10 (n = 8–13) and F Arginase1 (n = 9–17) in homogenates from hippocampal slices measured by western blot. Representative images of the blots of each protein and the loading control (β-actin or GAPDH in case of Arginase1) are shown. Content of G IL-1β (n = 7–9) and H TNFα (n = 8–9) in homogenates from hippocampal slices measured by ELISA and expressed as pg per mg of total protein. One-way ANOVA with Tukey post hoc test was performed to compare all groups. Values are expressed as percentage of protein content in controls and are the mean ± SEM. Values significantly different from controls are indicated by asterisk (*p < 0.05; **p < 0.01; ***p < 0.001; ****p < 0.0001), values significantly different from HA group are indicated by a (a = p < 0.05; aa = p < 0.01; aaa = p < 0.001; aaaa = p < 0.0001) and values significantly different from HA + EVs group are indicated by b (b = p < 0.05; bb = p < 0.01; bbb = p < 0.001; bbbb = p < 0.0001). Sample size of each group is indicated at the bottom of the bars
Fig. 9
Fig. 9
Incubation with MSC-EVs normalizes the membrane expression of NR2B subunit of NMDA receptors and GluA1 and GluA2 subunits of AMPA receptors in hippocampal slices from hyperammonemic rats. Membrane expression of A NR2B (n = 9–23), B GluA1 (n = 8–24) and C GluA2 (n = 8–18) in homogenates from hippocampal slices incubated in the presence (+) or absence (−) of the cross-linker BS3, measured by western blot. Samples in the absence of BS3 represent the total amount of each protein, while samples incubated in the presence of BS3 represent the non-membrane fraction of each protein. Representative images of the blots of each protein are shown. One-way ANOVA with Tukey post hoc test was performed to compare all groups. Values are expressed as percentage of membrane expression of controls and are the mean ± SEM. Values significantly different from controls are indicated by asterisk (*p < 0.05; ***p < 0.001; ****p < 0.0001), values significantly different from HA group are indicated by a (aa = p < 0.01; aaa = p < 0.001; aaaa = p < 0.0001) and values significantly different from HA + EVs group are indicated by b (b = p < 0.05; bb = p < 0.01; bbb = p < 0.001). Sample size of each group is indicated at the bottom of the bars
Fig. 10
Fig. 10
Incubation with MSC-EVs reduces NF-κB activation in hippocampal slices from hyperammonemic rats. A Representative images of immunofluorescence against p50 subunit of NF-κB (green) in hippocampal slices. Nuclei are stained with DAPI (blue). B Ratio of nuclear/cytoplasmic NF-κB p50 subunit in neurons of CA1 region of hippocampus, measured by immunofluorescence and expressed as percentage of control (n = 5–6). C Axial projections of z-stack to confirm p-50 nuclear localization: a representative image showing 3D and 2D projections with its corresponding XZ and YZ planes is shown on the left. Representative images of control and HA samples showing 2D projections with their corresponding XZ and YZ planes are shown on the right. D p65 transcriptional activity in nuclear extracts measured by DNA-binding activity kit. Data of optical density were measured at 450 nm and are expressed as percentage of controls. E Double-immunofluorescence against p50 subunit of NF-kB (green) and Iba1 (staining microglia, in red). Nuclei are stained with DAPI (blue). F Number of microglial cells expressing NF-κB p50 subunit, measured by double immunofluorescence and expressed as cells/mm2 (n = 4–6). One-way ANOVA with Tukey post hoc test was performed to compare all groups. Values are the mean ± SEM. Values significantly different from controls are indicated by asterisk (*p < 0.05; **p < 0.01; ***p < 0.001; ****p < 0.0001), values significantly different from HA group are indicated by a (a = p < 0.05; aaa = p < 0.001; aaaa = p < 0.0001) and values significantly different from HA + EVs group are indicated by b (b = p < 0.05; bb = p < 0.01; bbb = p < 0.001). Sample size of each group is indicated at the bottom of the bars
Fig. 11
Fig. 11
Incubation with MSC-EVs reduces NF-κB activation in hippocampal slices from hyperammonemic rats through the TGFβ–TGFβR2–Smad7–IkBα pathway. Content of A Smad7 (n = 8–15), B IkBα (n = 8–19), C phosphorylated IkBα (n = 8–18), D TGFβ (n = 8–10) and E TGFβR2 (n = 8–22) in homogenates from hippocampal slices, measured by western blot and expressed as percentage of protein content in controls. Representative images of the blots of each protein and the load control (β-actin) are shown. F Membrane expression of TGFβR2 (n = 8–10) in homogenates from hippocampal slices incubated in the presence (+) or absence (−) of the cross-linker BS3, measured by western blot. Samples in the absence of BS3 represent the total amount of each protein, while samples incubated in the presence of BS3 represent the non-membrane fraction of each protein. Representative images of the blots are shown. One-way ANOVA with Tukey post hoc test was performed to compare all groups. Values are the mean ± SEM. Values significantly different from controls are indicated by asterisk (*p < 0.05; **p < 0.01; ***p < 0.001; ****p < 0.0001), values significantly different from HA group are indicated by a (a = p < 0.05; aa = p < 0.01; aaa = p < 0.001; aaaa = p < 0.0001) and values significantly different from HA + EVs group are indicated by b (b = p < 0.05; bb = p < 0.01; bbb = p < 0.001; bbbb = p < 0.0001). Sample size of each group is indicated at the bottom of the bars
Fig. 12
Fig. 12
Summary of the main effects of MSC-EVs in hippocampus of hyperammonemic rats: underlying mechanisms. Hyperammonemia induces neuroinflammation in hippocampus, with microglial activation, increasing pro-inflammatory factors (IL-1β, TNFα) and reducing anti-inflammatory factors (IL-4, Arg1). Increased IL-1β and activation of its receptor alters membrane expression of NR2B, GluA1 and GluA2 subunits of NMDA and AMPA receptors, leading to impairment of cognitive function, and to learning and memory deficits. Extracellular vesicles derived from mesenchymal stem cells (MSCs) injected to hyperammonemic rats reach the hippocampus, reduce the expression of pro-inflammatory factors and increase the expression of anti-inflammatory factors, reverse neuroinflammation in hippocampus and restore different forms of learning and memory. The results reported indicate that these beneficial effects are mediated by the TGFβ–TGFβR2–Smad7–IkBα–NF-κB pathway. The content of TGFβ, its receptor TGFβR2 and Smad7 are reduced in hyperammonemia, leading to reduced IkBα protein and increased NF-κB activation, which induces the expression of pro-inflammatory markers such as IL-1β and TNFα, leading to cognitive impairment. EVs from MSCs contain TGFβ, which normalizes the TGFβ–TGFβR2–Smad7–IkBα–NF-κB pathway in hyperammonemic rats. This normalizes IL-1β levels and, subsequently the membrane expression of NR2B, GluA1 and GluA2 subunits, restoring cognitive function. Created with Biorender

Similar articles

Cited by

References

    1. Agusti A, Cauli O, Rodrigo R, Llansola M, Hernández-Rabaza V, Felipo V. p38 MAP kinase is a therapeutic target for hepatic encephalopathy in rats with portacaval shunts. Gut. 2011;60(11):1572–1579. doi: 10.1136/gut.2010.236083. - DOI - PubMed
    1. Arenas YM, Cabrera-Pastor A, Juciute N, Mora-Navarro E, Felipo V. Blocking glycine receptors reduces neuroinflammation and restores neurotransmission in cerebellum through ADAM17-TNFR1-NF-κβ pathway. J Neuroinflammation. 2020;17(1):269. doi: 10.1186/s12974-020-01941-y. - DOI - PMC - PubMed
    1. Augello A, Tasso R, Negrini SM, Cancedda R, Pennesi G. Cell therapy using allogeneic bone marrow mesenchymal stem cells prevents tissue damage in collagen induced arthritis. Arthritis Rheum. 2007;56(4):1175–1186. doi: 10.1002/art.22511. - DOI - PubMed
    1. Azorín I, Miñana MD, Felipo V, Grisolía S. A simple animal model of hyperammonemia. Hepatology. 1989;10(3):311–314. doi: 10.1002/hep.1840100310. - DOI - PubMed
    1. Baek G, Choi H, Kim Y, Lee HC, Choi C. Mesenchymal stem cell-derived extracellular vesicles as therapeutics and as a drug delivery platform. Stem Cells Transl Med. 2019;8(9):880–886. doi: 10.1002/sctm.18-0226. - DOI - PMC - PubMed

MeSH terms

Substances