. 2022 Dec 7;26(1):105755.
doi: 10.1016/j.isci.2022.105755. eCollection 2023 Jan 20.

Visualization of erythrocyte stasis in the living human eye in health and disease

Affiliations

Visualization of erythrocyte stasis in the living human eye in health and disease

Joanne Li et al. iScience. .

Abstract

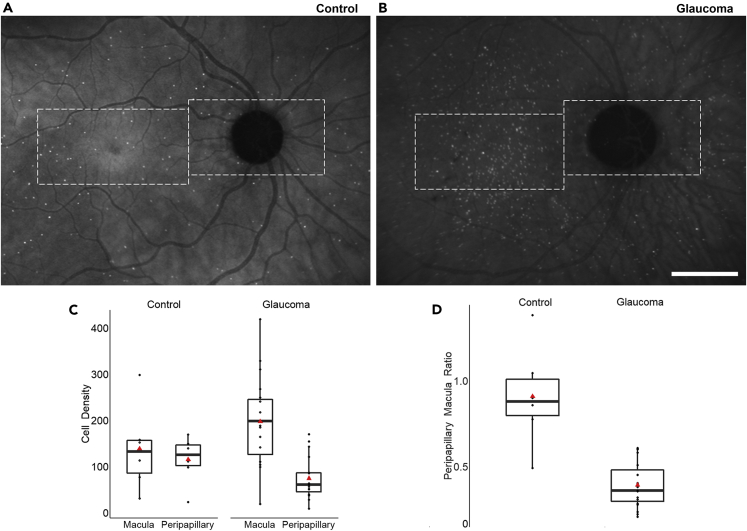
Blood cells trapped in stasis have been reported within the microcirculation, but their relevance to health and disease has not been established. In this study, we introduce an in vivo imaging approach that reveals the presence of a previously-unknown pool of erythrocytes in stasis, located within capillary segments of the CNS, and present in 100% of subjects imaged. These results provide a key insight that blood cells pause as they travel through the choroidal microvasculature, a vascular structure that boasts the highest blood flow of any tissue in the body. Demonstration of clinical utility using deep learning reveals that erythrocyte stasis is altered in glaucoma, indicating the possibility of more widespread changes in choroidal microvascular than previously realized. The ability to monitor the choroidal microvasculature at the single cell level may lead to novel strategies for tracking microvascular health in glaucoma, age-related macular degeneration, and other neurodegenerative diseases.

Keywords: Health sciences; Ocular aberrometry; Optometry.


Conflict of interest statement

OJ Saeedi received financial and nonfinancial support from Heidelberg Engineering. The other authors declare no competing interests.

Figures

None
Graphical abstract
Figure 1
Figure 1
Time course of erythrocytes in stasis following erythrocyte-mediated angiography (EMA) injection Heidelberg scanning laser ophthalmoscopy (SLO) images of the retina at time points (A) before and (B–F) after the EMA procedure. (A) Pre-injection image shows that no ICG signal was observed in the eye (the faint, background infrared autofluorescence signal can be seen). (B–F) SLO image acquired after the EMA procedure (in dashed box in [A]) shows the locations of erythrocytes in stasis changing over time. (B) 15 min after the injection, many stasis events with varying levels of brightness can be seen. (C) After 2 h, stasis events were observed in various locations across the retina but with slightly less cells than earlier. There was a decrease in the number of stasis events (D) after 4 h, with a further decrease observed (E) one day afterward. (F) No ICG signal was observed in the eye two weeks post procedure. Scale bar: 200 μm.
Figure 2
Figure 2
Erythrocytes in stasis were observed within the foveal avascular zone (FAZ) in majority of the eyes Erythrocyte mediated angiography (EMA) was performed in which indocyanine green (ICG)-loaded erythrocytes are autologously injected and imaged. Optical coherence tomography angiography (OCTA) images demarcate the location of the FAZ (central black area), a region that lacks retinal vasculature. Images of fluorescently-labeled erythrocytes (white circular dots), captured using SLO and overlaid on the OCTA images, reveal the presence of erythrocytes in stasis within the FAZ. Similar results were observed in both non-human primate (NHP) eyes and human eyes (enclosed in green box). In human eyes, erythrocytes in stasis were present in control, glaucoma suspect, and glaucoma eyes, establishing that stasis is a robust physiological phenomenon. Scale bar: 1 mm.
Figure 3
Figure 3
Erythrocytes in stasis were located within the choriocapillaris layer of the human eye (A) SLO image showing the distribution of erythrocytes in stasis across the eye. (B) Higher resolution AO-ICG images of the white dashed region in (A) showing a subset of the erythrocytes in stasis, acquired 30 to 40 min after the image in (A). here, the focal plane is set at the choriocapillaris layer. The fluorescently-labeled blood cells all appear to be in focus across the AO images (yellow dashed line: foveal avascular zone [FAZ] boundary). (C) Full width at half maximum (FWHM) measurements of seven of the cells imaged using AO-ICG across different focal planes confirm that the cells are in best focus near the choriocapillaris focal plane. Each color in (C) corresponds to one cell in (A and B) identified by the color matched arrows. These plots also confirmed that erythrocytes in stasis were not located in the retinal vasculature. Plots from individual cells are vertically displaced for visualization purposes. (D) A series of AO-ICG images of an erythrocyte in stasis (dark blue arrow in [A and B]) across different focal planes, showing that the cell is in best focus when the focal plane is set near the choriocapillaris (0.00 mm). Scale bars: (A) 1 mm; (B) 100 μm; (D) 70 μm.
Figure 4
Figure 4
Erythrocyte stasis occurred within the short vessel segments of the choroidal microvasculature Only standard EMA was performed in year 1, and both standard EMA and AO-EMA were performed in years 2 and 3. (A and B) Higher resolution AO images of erythrocyte in stasis (white circular dots imaged using AO-ICG; [A]: year 2, [B]: year 3) co-registered to AO images of the inner retinal microvasculature (yellow, imaged using AO non-confocal split detection). (C) In this segmentation map of the choriocapillaris (Figure S2), the images of the retinal vessels were acquired at a focal plane that was anterior to the erythrocytes in stasis. Erythrocyte stasis marked from multiple timepoints associated with three separate EMA procedures across three years. Cells recorded from different years and procedures are categorized by different markers (filled markers: imaged using SLO; unfilled markers: imaged using AO). The colormap indicates the time points at which these cells in stasis were captured by imaging. All of the cells in stasis that could be identified within this region were located within the choriocapillaris vessel segments. Scale bar: 200 μm.
Figure 5
Figure 5
EMA was performed on human using ICG-loaded erythrocytes, allowing for the characterization of the retinal distribution of cells in stasis in both healthy and diseased eyes (A and B) Averaged, wide field-of-view SLO images from control and glaucoma subjects show the distribution of stationary cells in the macula and peripapillary regions (white dashed area). (C) Boxplot showing the absolute number of erythrocytes in stasis density (cell density) in the macula and peripapillary regions were similar for control subjects, while in glaucoma subjects, the macula cell densities were higher than peripapillary cell densities (center line: median, red triangle: mean, box limits: upper/lower quartiles, whiskers: 1.5x interquartile range, black dots: individual data points). (D) The decreased peripapillary to macula ratio (PMR) value for glaucoma subjects compared to controls indicates less cells in stasis in glaucomatous eyes around the optic nerve, a region known to be affected by glaucoma pathogenesis. Scale bar: 2 mm.

References

    1. Wangsa-Wirawan N.D., Linsenmeier R.A. Retinal oxygen: fundamental and clinical aspects. Arch. Ophthalmol. 2003;121:547–557. doi: 10.1001/archopht.121.4.547. - DOI - PubMed
    1. Fryczkowski A.W., Sherman M.D. Scanning electron microscopy of human ocular vascular casts: the submacular choriocapillaris. Acta Anat. 1988;132:265–269. doi: 10.1159/000146586. - DOI - PubMed
    1. Lejoyeux R., Benillouche J., Ong J., Errera M.-H., Rossi E.A., Singh S.R., Dansingani K.K., da Silva S., Sinha D., Sahel J.-A., et al. Choriocapillaris: fundamentals and advancements. Prog. Retin. Eye Res. 2022;87:100997. doi: 10.1016/j.preteyeres.2021.100997. - DOI - PubMed
    1. Zouache M.A., Eames I., Klettner C.A., Luthert P.J. Form, shape and function: segmented blood flow in the choriocapillaris. Sci. Rep. 2016;6:35754. doi: 10.1038/srep35754. - DOI - PMC - PubMed
    1. Olver J.M. Functional anatomy of the choroidal circulation: methyl methacrylate casting of human choroid. Eye. 1990;4:262–272. doi: 10.1038/eye.1990.38. - DOI - PubMed

LinkOut - more resources