. 2023 Jan 1;19(1):242-257.
doi: 10.7150/ijbs.77304. eCollection 2023.

TREM-1 governs NLRP3 inflammasome activation of macrophages by firing up glycolysis in acute lung injury

Affiliations

TREM-1 governs NLRP3 inflammasome activation of macrophages by firing up glycolysis in acute lung injury

Wen-Jing Zhong et al. Int J Biol Sci. .

Abstract

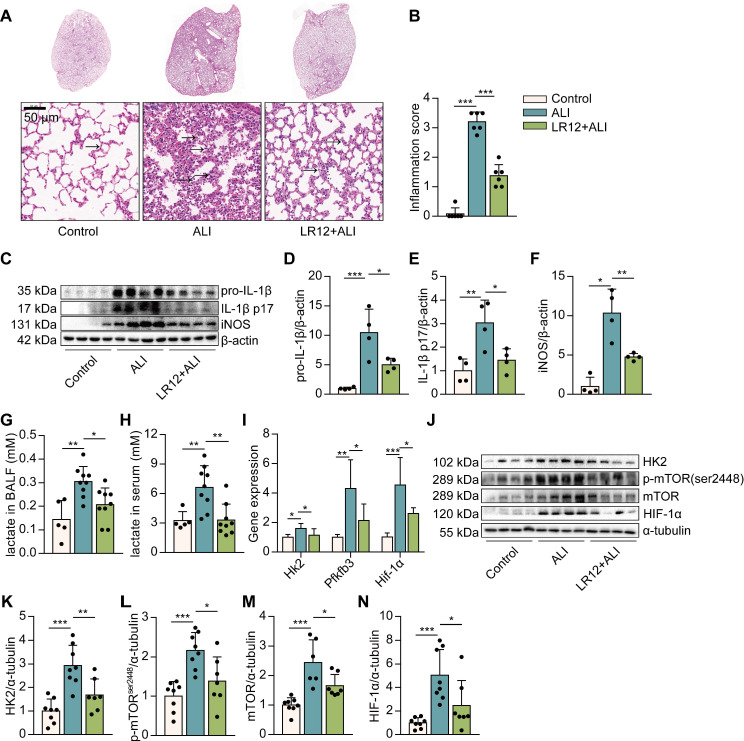
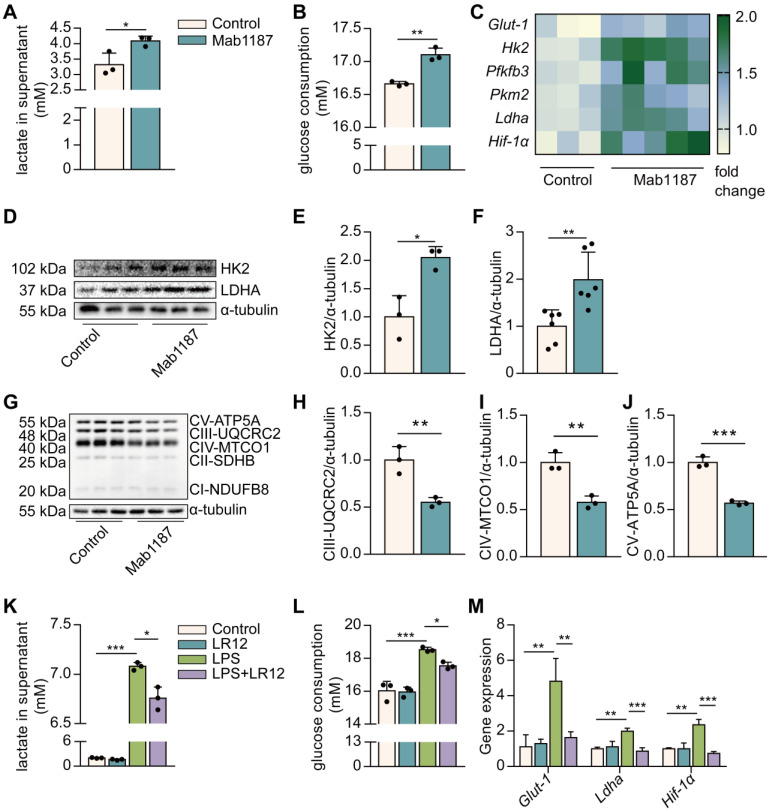
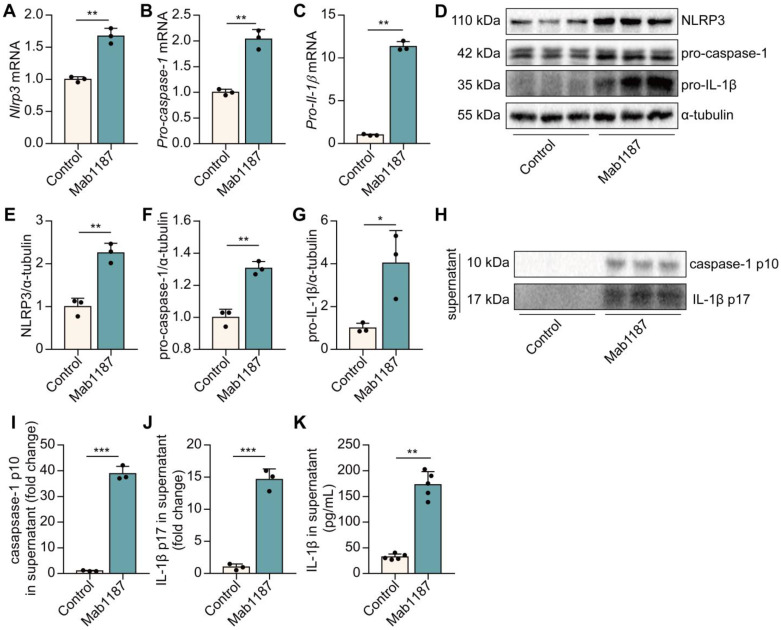
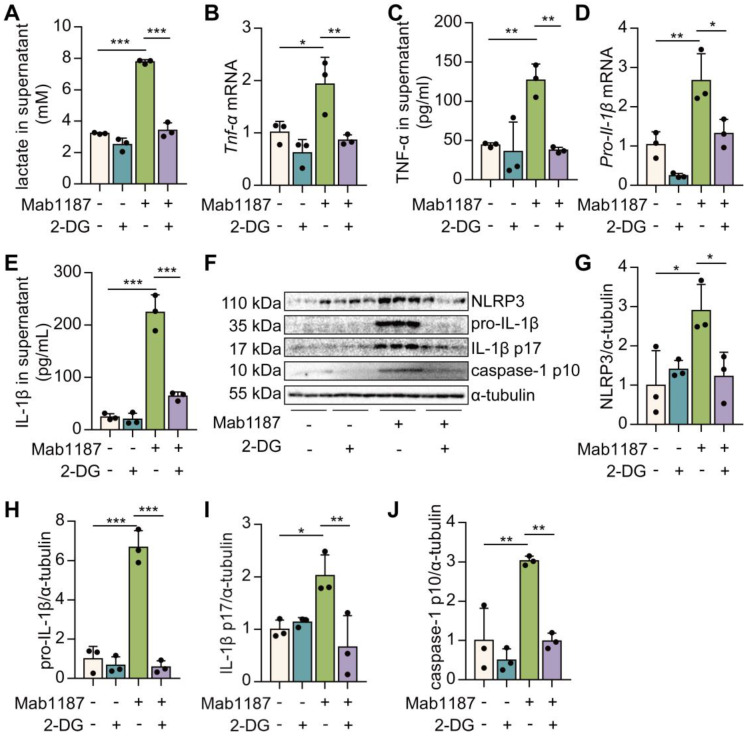
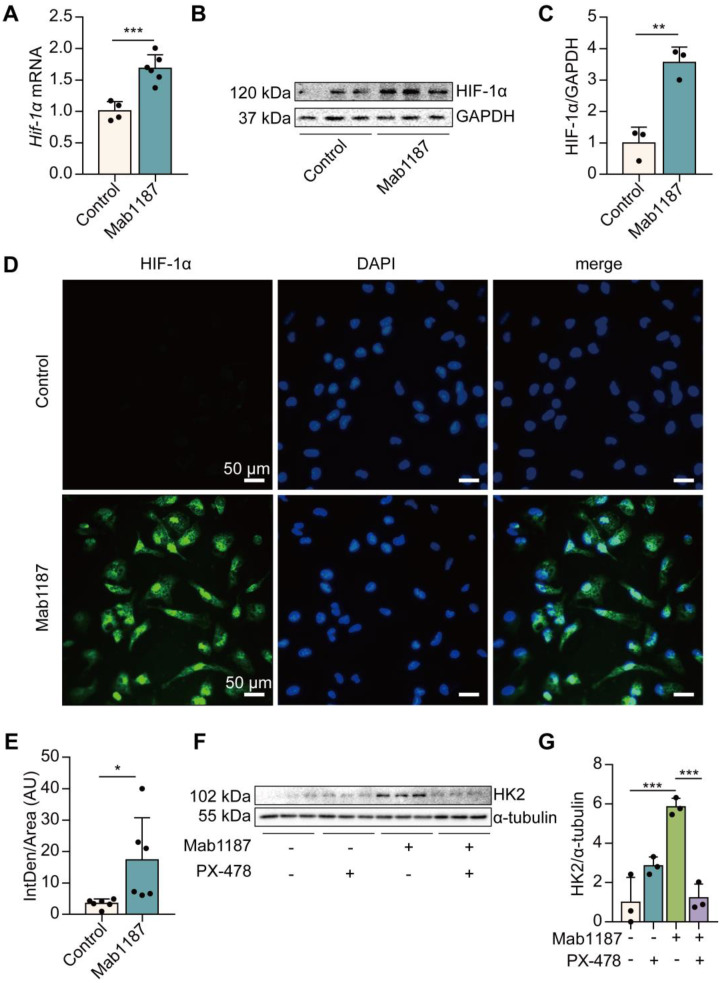
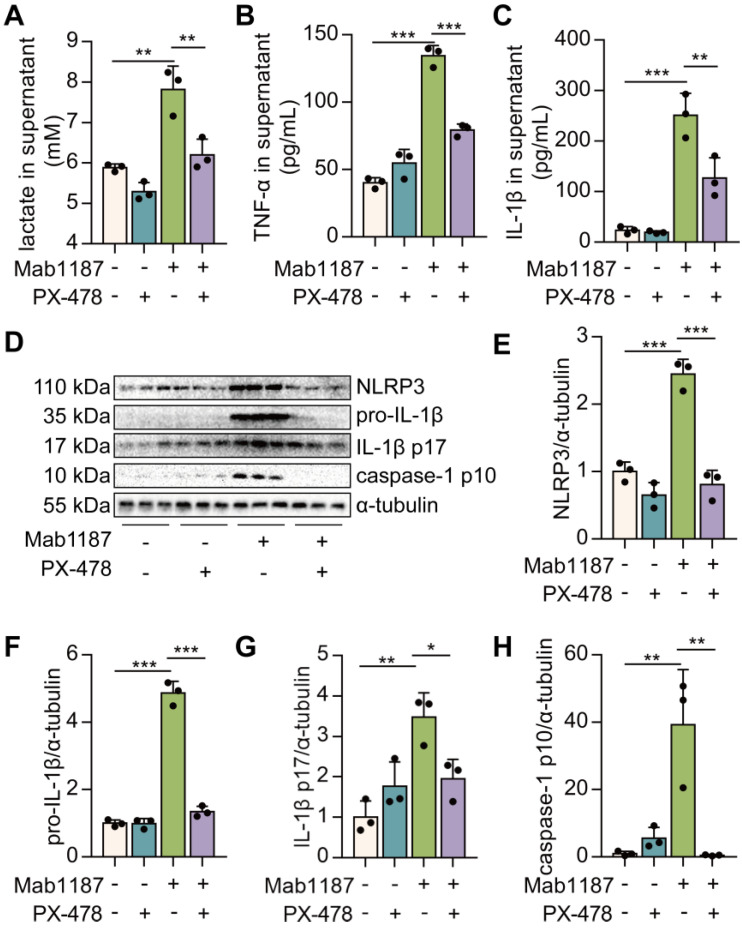
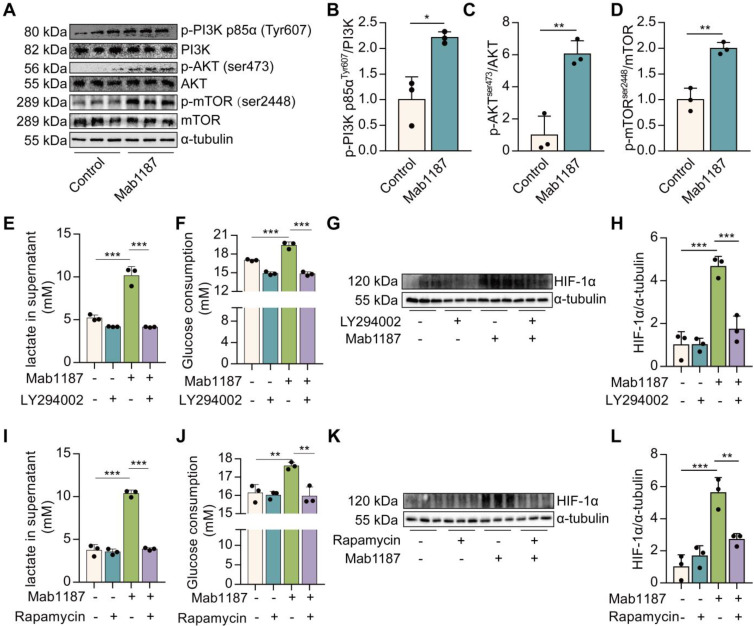
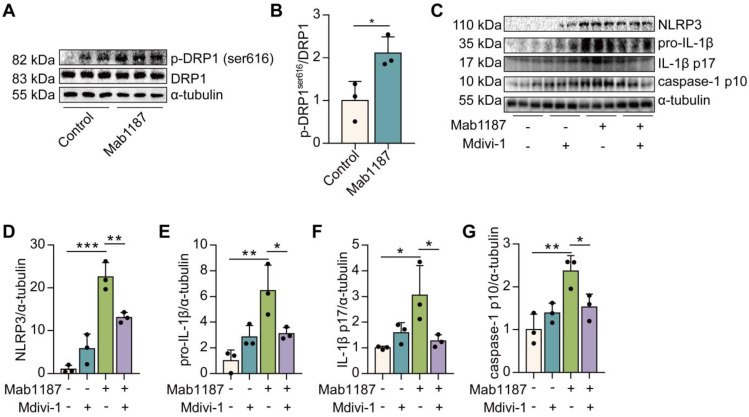
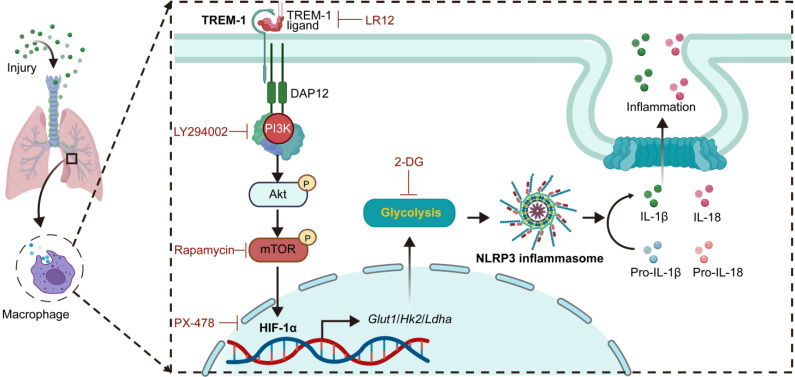
The triggering receptor expressed on myeloid cells-1 (TREM-1) is a pro-inflammatory immune receptor potentiating acute lung injury (ALI). However, the mechanism of TREM-1-triggered inflammation response remains poorly understood. Here, we showed that TREM-1 blocking attenuated NOD-, LRR- and pyrin domain-containing 3 (NLRP3) inflammasome activation and glycolysis in LPS-induced ALI mice. Then, we observed that TREM-1 activation enhanced glucose consumption, induced glycolysis, and inhibited oxidative phosphorylation in macrophages. Specifically, inhibition of glycolysis with 2-deoxyglucose diminished NLRP3 inflammasome activation of macrophages triggered by TREM-1. Hypoxia-inducible factor-1α (HIF-1α) is a critical transcriptional regulator of glycolysis. We further found that TREM-1 activation facilitated HIF-1α accumulation and translocation to the nucleus via the phosphoinositide 3-kinase (PI3K)/AKT/mammalian target of rapamycin (mTOR) pathway. Inhibiting mTOR or HIF-1α also suppressed TREM-1-induced metabolic reprogramming and NLRP3/caspase-1 activation. Overall, the mTOR/HIF-1α/glycolysis pathway is a novel mechanism underlying TREM-1-governed NLRP3 inflammasome activation. Therapeutic targeting of the mTOR/HIF-1α/glycolysis pathway in TREM-1-activated macrophages could be beneficial for treating or preventing inflammatory diseases, such as ALI.

Keywords: Acute lung injury; HIF-1α; NLRP3 inflammasome; TREM-1; glycolysis; macrophages.


Conflict of interest statement

Competing Interests: The authors have declared that no competing interest exists.

Figures

Figure 1
Figure 1
Blockade of TREM-1 reduced intrapulmonary inflammation and limited glycolysis in LPS-induced ALI mice. C57BL/6J mice were intravenously injected with LR12 (5 mg/kg) 2 h before the LPS administration (5 mg/kg, i.t.). (A) Six hours later, mouse lungs were excised, and lung histopathology was performed with H&E staining. One representative picture of six mice in each group is shown. (B) Inflammation score was measured, n=6 mice/group. (C) Pro-IL-1β, IL-1β p17, and iNOS in the lung lysates were assessed by western blot with β-actin as a loading control. (D-F) The western blot results were quantitated using Image Lab, n=8 mice per group. (G-H) Lactate concentration in BALF and serum was assayed, n=4-9 mice/group. (I) Expression of Hk2, Pfkfb3, and Hif-1α mRNA in the lungs was detected by real-time PCR. Data was normalized to housekeeping gene β-actin, n=5-10 mice/group. (J) Glycolysis-associated proteins of HK2, p-mTOR, mTOR, and HIF-1α in the lung lysates were assessed by western blot with α-tubulin as a loading control. (K-N) Quantification of indicated protein levels in (J), n=6-8 mice/group. In all cases, the experiment was repeated twice. Dots represent individual animal values. Statistical analysis was performed using One-way ANOVA adjusted by Tukey's multiple comparison test for Control vs. ALI or ALI vs. LR12+ALI. Error bars indicate mean ± SD. * P < 0.05, ** P < 0.01, and *** P < 0.001. Original western blots represented in graphs are available in Figure 1-source data.
Figure 2
Figure 2
TREM-1 activation instigated glucose metabolic reprogramming in macrophages. Macrophages were stimulated with 10 μg/mL of an agonist anti-TREM-1 mAb. (A) Six hours later, the lactate in the supernatant was assayed, n=3. (B) Glucose consumption in the supernatant in control or 24 h TREM-1-activated macrophages, n=3. (C) Glut-1, Hk2, Pfkfb3, Pkm2, Ldha, and Hif-1α mRNA in control or 6 h TREM-1-activated macrophages. Data was normalized to housekeeping gene β-actin, n=3-5. (D-F) Western blot and quantification of the glycolytic enzymes (HK2 and LDHA) in the control or 24 h TREM-1-activated macrophages, n=3. (G) OXPHOS-related proteins: ATP5A, MTCO1, UQCRC2, SDHB, and NDUFB8, in the macrophages were detected by western blot. (H-J) Quantification of indicated protein levels in (G), n=3. Macrophages were administrated with LR12 (25 μg/mL) 30 min before the LPS stimulation (1 ng/mL). Twenty-four hours later, (K) the lactate and (L) relative glucose consumption in the supernatant were assayed, n=3. (M) Expression of Glut-1, Ldha, and Hif-1α mRNA in macrophages was detected by real-time PCR, n=3. n represents experiments performed on different macrophages from separate mice. Bar graphs represent mean ± SD. Student's t-test (two-tailed, unpaired) was used to compare Mab1187 and Control in (A-J): * P < 0.05, ** P < 0.01, and *** P < 0.001. One-way ANOVA adjusted by Tukey's multiple comparison test was used in (K-M): * P < 0.05, ** P < 0.01, and *** P < 0.001.
Figure 3
Figure 3
TREM-1 triggered the NLRP3 inflammasome activation in macrophages. Macrophages were incubated with plate-bound isotype-matched control or plate-bound anti-TREM-1 mAb (10 μg/mL). (A-C) Six hours later, Nlrp3, Pro-caspase-1, and Pro-il-1β mRNA expressions in macrophages were measured using qPCR. Data was normalized to housekeeping gene β-actin, n=3. (D) Twenty-four hours later, protein expression of NLRP3, pro-caspase-1, and pro-IL-1β in the cell lysate was detected by western blot with α-tubulin as a loading control. (E-G) Quantification of indicated protein levels in (D), n=3. (H-J) Caspase-1 p10 and IL-1β p17 in the supernatant were detected by western blot, n=3. (K) IL-1β contents in the supernatants were analyzed with ELISA, n=5. n represents experiments performed on different macrophages from separate mice. Bar graphs represent mean ± SD. Student's t-test (two-tailed, unpaired) was used to compare Control and Mab1187: * P < 0.05, ** P < 0.01, and *** P < 0.001.
Figure 4
Figure 4
Blockade of glycolysis partially inhibited TREM-1-mediated NLRP3 inflammasome activation in macrophages. (A) Macrophages (1×10⁶ cells/well) were premixed with PBS control or 2-DG (5 mM) and then plated into 12-well plates with agonist anti-TREM-1 mAb (10 μg/mL). After 24 h, supernatants were analyzed for lactate production, n=3. (B, D) Macrophages were treated as in (A), and 6 h later, Tnf‐α and Pro-il-1β mRNA levels in macrophages were measured using qPCR, n=3. (C, E) Macrophages were treated as in (A). Twenty-four hours later, TNF‐α and IL-1β production in the supernatant was measured by ELISA, n=3. (F) NLRP3, pro-IL-1β, IL-1β p17, and caspase-1 p10 protein in cell lysate were detected by western blot, n=3. (G-J) Quantification of indicated protein levels in (F). n=3 biological replicates. Data are expressed as the mean ± SD. One-way ANOVA adjusted by Tukey's multiple comparison test was used. * P < 0.05, ** P < 0.01, and *** P < 0.001.
Figure 5
Figure 5
TREM-1 activation induced HIF-1α accumulation and translocation to the nucleus in macrophages. Macrophages were incubated with anti-TREM-1 mAb (10 μg/mL) in a normoxia condition. (A) Six hours later, Hif‐1α gene levels were measured using qPCR, n=4-6. (B-C) Twenty-four hours later, the protein of HIF‐1α was performed by western blot with GAPDH as a loading control, n=3. (D) Macrophages were cultured on anti-TREM-1 for 24 h and then subjected to immunofluorescence examination to analyze the HIF-1α accumulation and translocation to the nucleus (scale bar, 50 μm). (E) Average fluorescent intensity was calculated by HIF-1α+ fluorescence intensity (IntDen)/area of the region (Area) using ImageJ, n=6. (F-G) 1×10⁶ cells/well were premixed with PBS control or PX-478 (25 μM) for 30 min, then plated into 12-well plates with agonist anti-TREM-1 mAb (10 μg/mL). HK2 protein levels were measured after an additional incubation for 24 h, n=3. n represents experiments performed on different macrophages from separate mice. Data are expressed as the mean ± SD. Student's t-test (two-tailed, unpaired) was used to compare Mab1187 and Control in (A-E): * P < 0.05, ** P < 0.01, and *** P < 0.001. One-way ANOVA adjusted by Tukey's multiple comparison test was used in G: *** P < 0.001.
Figure 6
Figure 6
HIF-1α droves TREM-1-mediated NLRP3 inflammasome activation. Macrophages were premixed with PBS control or PX-478 (25 μM) before incubating with plate-bound agonistic anti-TREM-1 mAb (10 μg/mL). (A) Twenty-four hours later, lactate level in supernatant was assayed, n=3. (B-C) The concentration of TNF‐α and IL-1β in the supernatant was assayed using ELISA, n=3. (D) Protein expression of NLRP3, pro-IL-1β, IL-1β p17, and caspase-1 p10 in macrophage lysate was detected by western blot. (E-H) Quantification of indicated protein levels in (D), n=3 biological replicates. Statistical analysis was performed using One-way ANOVA adjusted by Tukey's multiple comparison test. Data are expressed as the mean ± SD. * P < 0.05, ** P < 0.01, and *** P < 0.001.
Figure 7
Figure 7
TREM-1 activation stimulated HIF-1α accumulation via PI3K/AKT/mTOR signaling. 1×10⁶ macrophages/well were plated into 12-well plates with agonist anti-TREM-1 mAb (10 μg/mL). (A) p-PI3K p85αT607, total PI3K, p-AKTs473, AKT, p-mTORs2448, and mTOR protein levels in control or 24 h TREM-1-activated macrophages. (B-D) Quantification of p-PI3K p85αT607, p-AKTs473 and p-mTORs2448 in (A), n=3 biological replicates. Statistical analysis was performed using Student's t-test (two-tailed, unpaired). (E) Lactate secretion, (F) glucose consumption in the supernatant, and (G-H) HIF-1α protein levels in control or 24 h TREM-1-activated macrophages co-treated with or without LY294002 (25 μM). n=3 biological replicates. Statistical analysis was performed using One-way ANOVA. (I) Lactate secretion, (J) glucose consumption in the supernatant, and (K-L) HIF-1α protein levels in control or 24 h TREM-1-activated macrophages co-treated with or without Rapamycin (100 nM). n=3 biological replicates. Statistical analysis was performed using One-way ANOVA adjusted by Tukey's multiple comparison test. Data were expressed as the mean ± SD. * P < 0.05, ** P < 0.01, and *** P < 0.001.
Figure 8
Figure 8
TREM-1 triggered the NLRP3 inflammasome activation by enhancing mitochondrial fission in macrophages. Macrophages were stimulated with 10 μg/mL of an agonist anti-TREM-1 mAb. (A-B) Western blot and quantification of p-DRP1ser616 and DRP1 in control or 24 h TREM-1-activated macrophages. n=3 biological replicates. Statistical analysis was performed using Student's t-test (two-tailed, unpaired). Macrophages were premixed with PBS control or Mdivi-1 (100 nM) before incubating with plate-bound agonistic anti-TREM-1 mAb for 24 h. (C) Protein levels of NLRP3, pro-IL-1β, IL-1β p17, and caspase-1 p10 in macrophages were detected by western blot. (D-G) Quantification of NLRP3, pro-IL-1β, IL-1β p17, and caspase-1 p10 (C), n=3 biological replicates. Statistical analysis was performed using One-way ANOVA. Data were expressed as the mean ± SD. * P < 0.05, ** P < 0.01, and *** P < 0.001.
Figure 9
Figure 9
Schematic illustration. TREM-1 activation stimulates HIF-1α induced glucose metabolic reprogramming via PI3K/AKT/mTOR pathway. HIF-1α-induced glycolysis promotes TREM-1-governed NLRP3 inflammasome activation, facilitating intrapulmonary inflammation in ALI.

References

    1. Matthay MA, Zemans RL, Zimmerman GA, Arabi YM, Beitler JR, Mercat A. et al. Acute respiratory distress syndrome. Nat Rev Dis Primers. 2019;5:18. - PMC - PubMed
    1. Fan E, Brodie D, Slutsky AS. Acute Respiratory Distress Syndrome: Advances in Diagnosis and Treatment. JAMA. 2018;319:698–710. - PubMed
    1. Yang HH, Duan JX, Liu SK, Xiong JB, Guan XX, Zhong WJ. et al. A COX-2/sEH dual inhibitor PTUPB alleviates lipopolysaccharide-induced acute lung injury in mice by inhibiting NLRP3 inflammasome activation. Theranostics. 2020;10:4749–61. - PMC - PubMed
    1. Neupane AS, Willson M, Chojnacki AK, Vargas ESCF, Morehouse C, Carestia A. et al. Patrolling Alveolar Macrophages Conceal Bacteria from the Immune System to Maintain Homeostasis. Cell. 2020;183:110–25. e11. - PubMed
    1. Matos AO, Dantas P, Silva-Sales M, Sales-Campos H. TREM-1 isoforms in bacterial infections: to immune modulation and beyond. Crit Rev Microbiol. 2021;47:290–306. - PubMed

Publication types

MeSH terms

Substances

LinkOut - more resources