

Targeting gut dysbiosis against inflammation and impaired autophagy in Duchenne muscular dystrophy
- PMID: 36594243
- PMCID: PMC9994484
- DOI: 10.15252/emmm.202216225
Targeting gut dysbiosis against inflammation and impaired autophagy in Duchenne muscular dystrophy
Abstract
Nothing is known about the potential implication of gut microbiota in skeletal muscle disorders. Here, we provide evidence that fecal microbiota composition along with circulating levels of short-chain fatty acids (SCFAs) and related metabolites are altered in the mdx mouse model of Duchenne muscular dystrophy (DMD) compared with healthy controls. Supplementation with sodium butyrate (NaB) in mdx mice rescued muscle strength and autophagy, and prevented inflammation associated with excessive endocannabinoid signaling at CB1 receptors to the same extent as deflazacort (DFZ), the standard palliative care for DMD. In LPS-stimulated C2C12 myoblasts, NaB reduces inflammation, promotes autophagy, and prevents dysregulation of microRNAs targeting the endocannabinoid CB1 receptor gene, in a manner depending on the activation of GPR109A and PPARγ receptors. In sum, we propose a novel disease-modifying approach in DMD that may have benefits also in other muscular dystrophies.
Keywords: autophagy; duchenne muscular dystrophy; endocannabinoid system; gut microbiota; short-chain fatty acids.
© 2023 The Authors. Published under the terms of the CC BY 4.0 license.
Figures
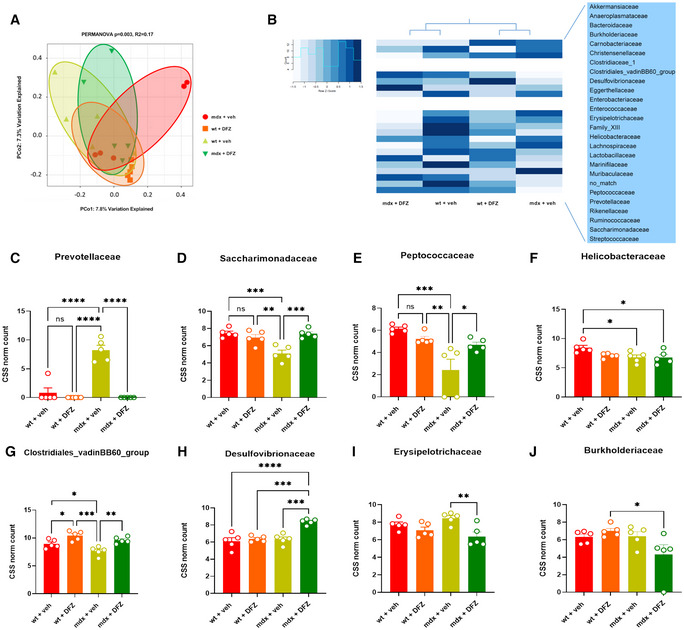
- A
Principal coordinate analysis (PCoA) displays differences in gut microbiota composition diversity among the four animal groups. Bray–Curtis dissimilarity indexes were used to estimate B‐diversity. PERMANOVA P values (Adonis R function) are displayed above PCoA.
- B
Heat map and hierarchical clustering of family composition using cumulative sum scaled (CSS) normalized bacterial counts.
- C–J
Bar Chart with data points showing the abundance of indicated bacterial families in the indicated group of mice. Data are expressed as CSS‐normalized bacterial counts.

- A–C
Bar chart with individual points showing the levels of propionate, acetate and butyrate in wt and mdx mice receiving DFZ or vehicle, measured by NMR or GC/MS. Data are expressed as μg/ml or bin intensity (arbitrary unit—a.u.)
- D–F
Bar chart with individual points showing the levels of pyruvate, succinate, and lactate in wt and mdx mice receiving vehicle or DFZ, measured by NMR.
- G
Correlation map based on Pearson correlation coefficients between butyrate, propionate, and acetate, and bacterial families changing in mdx mice. Rows and columns are rearranged according to the WARD‐based correlation matrix‐based hierarchical clustering (CMBHC).
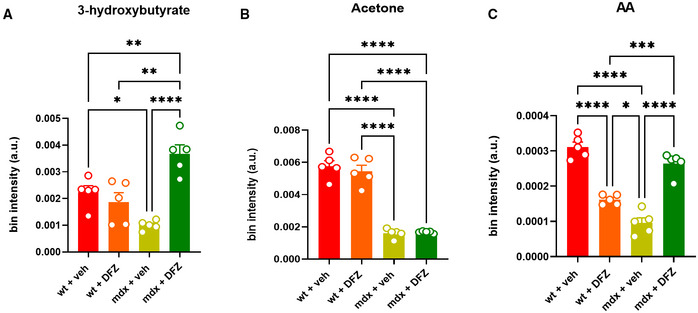
- A–C
Bar chart with individual points showing the levels of the indicated metabolites detected in the plasma of wt and mdx mice treated ± DFZ. Data are expressed as bin intensity (a. u., arbitrary unit).
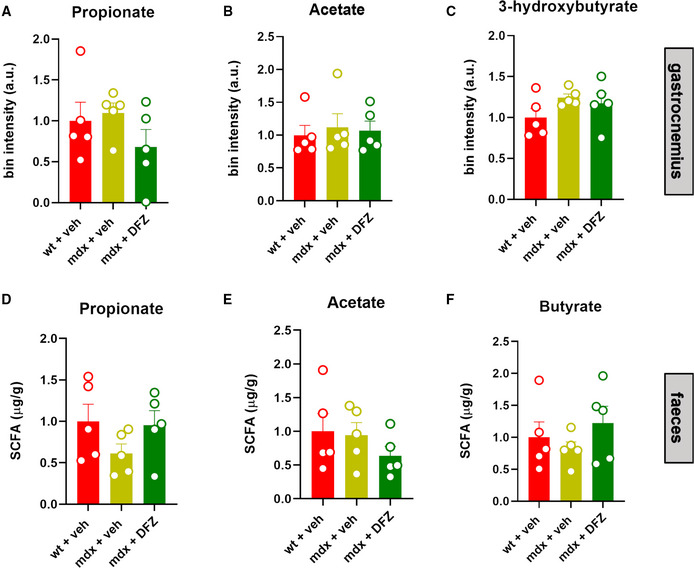
- A–F
Bar chart with individual points showing the levels of the indicated metabolites detected in the gastrocnemius and/or fecal samples of wt and mdx mice treated ± DFZ. Data are expressed as bin intensity (a. u., arbitrary unit).
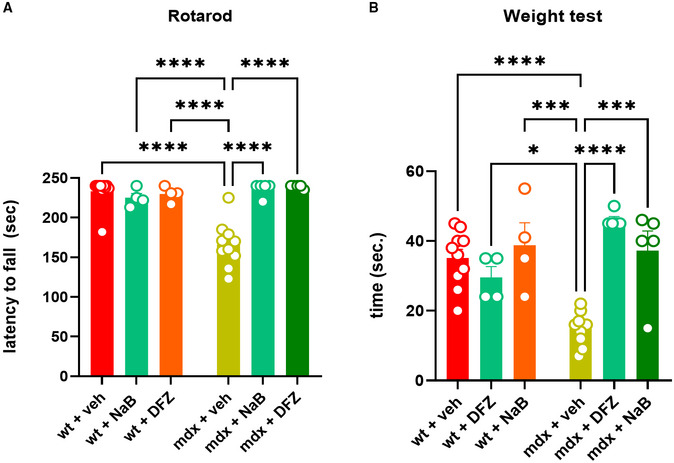
- A, B
Muscle coordination and strength were measured in 19‐week‐old control and mdx mice treated with vehicle (DMSO), NaB (100 mg/kg/daily), or DFZ (1.2 mg/kg/daily) for 3 weeks using the rotarod and weight test. Bar charts show the latency to fall or drop the weight of wt and dystrophic mice.
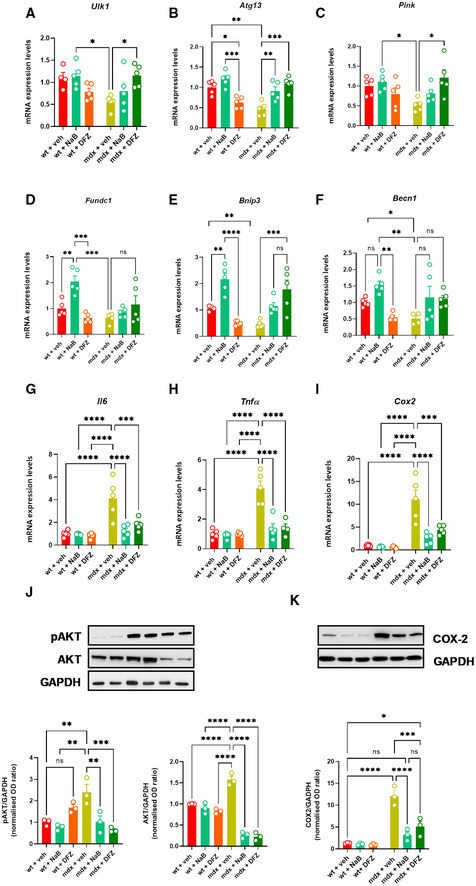
- A–I
Bar chart with individual points showing the mRNA expression levels of the indicated genes measured in the gastrocnemius of control and mdx mice treated with or without NaB and DFZ.
- J, K
Representative blotting and bar chart with individual points showing the expression and/or phosphorylation of pAKT/AKT and COX2 in the gastrocnemius of the indicated six groups of mice.

- A, B
Levels of AEA and 2‐AG in plasma samples of wt and mdx mice expressed as pmol/mg of wet tissue weight.
- C, D
Bar charts with individual points showing the mRNA expression levels of CB1 and CB2 measured in the gastrocnemius of the indicated groups of mice.
- E
Representative blots showing the expression levels of CB1 and CB2 proteins in the gastrocnemius of the indicated groups of mice.
- F
Quantification of CB1 and CB2 proteins to the housekeeping protein GAPDH.
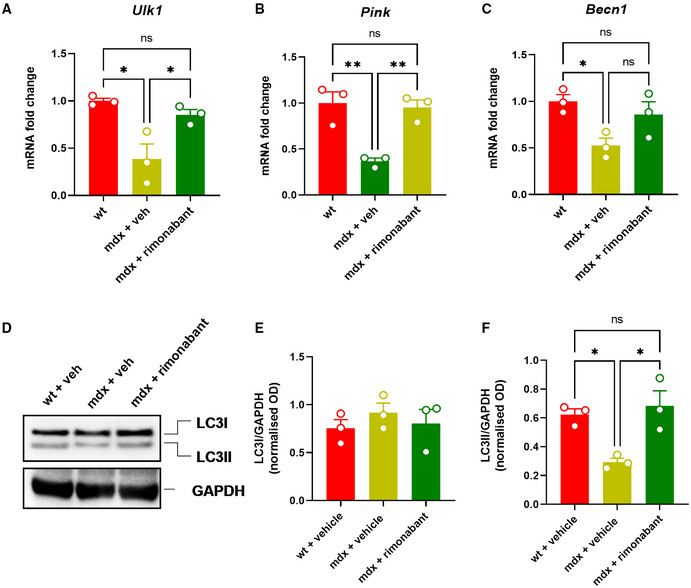
- A–C
Bar charts with individual points showing the mRNA expression levels of Ulk, Pink, and Becn1 measured in control and mdx mice treated with rimonabant (0.5 mg/kg).
- D
Representative blots showing the expression levels of LC3I and LC3II proteins in the gastrocnemius of the indicated groups of mice.
- E, F
Quantification of LC3I and LC3II proteins to the housekeeping protein GAPDH.

- A–D
Bar charts with individual points showing the mRNA expression levels of Bnip, Becn1, Ulk1, and Pink measured in control and mdx mice treated with ACEA 2.5 mg/kg.
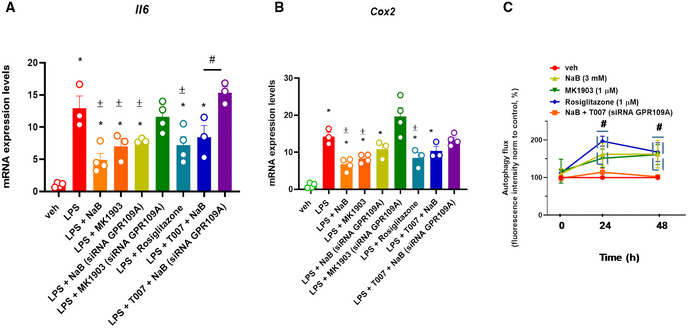
- A, B
Bar chart with individual points showing the mRNA expression levels of Il6 and Cox2 in control (vehicle, DMSO) and/or GPR109A‐silenced C2C12 myoblasts exposed to LPS (1 μg/ml) in the presence or absence of either MK1903 (1 μM), rosiglitazone (1 μM), or T007 (1 μM).
- C
Time‐dependent effect of NaB (3 mM), MK1903 (1 μM), and rosiglitazone (1 μM) on autophagosome formation measured in C2C12 myoblasts. Data are expressed as fluorescence intensity normalized to controls (%).
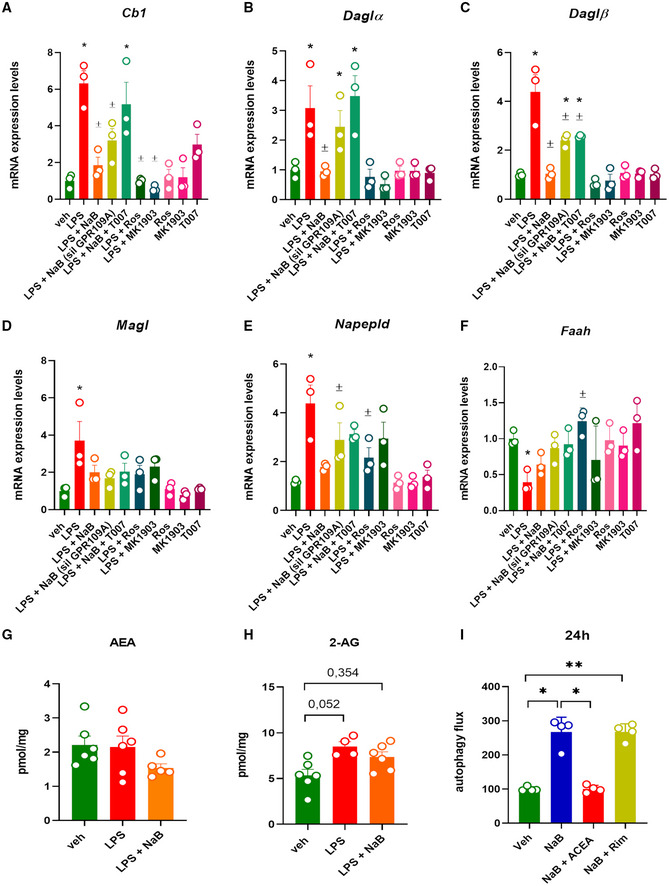
- A–F
Bar chart with individual points showing the mRNA expression levels of Cb1, Daglα, Daglβ, Magl, Napepld, and Faah in control (vehicle, DMSO) and/or GPR109A‐silenced C2C12 myoblasts exposed to LPS (1 μg/ml) in the presence or absence of either MK1903 (1 μM), rosiglitazone (1 μM), or T007 (1 μM).
- G, H
Levels of AEA and 2‐AG were measured in C2C12 cells exposed to LPS (1 μg/ml) or NaB (3 mM) for 24 h.
- I
Effect of ACEA (1 μM) and rimonabant (1 μM) on autophagosome formation measured in C2C12 cells.
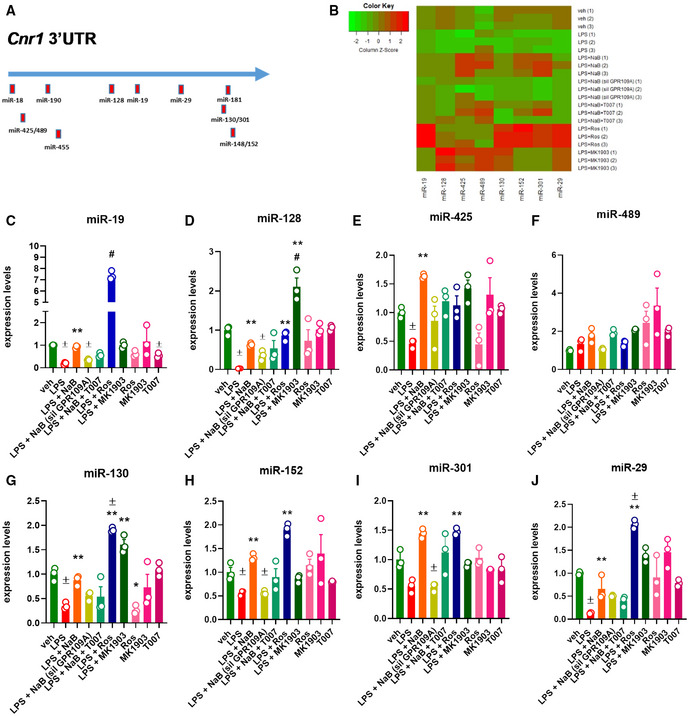
- A
Schematic representation of miRNAs targeting the 3′‐UTR region of both murine and human CB1 gene.
- B
Heatmap representation of the expression of selected miRNAs in the indicated biological replicates. Red—up‐regulated; green—down‐regulated.
- C–J
Bar chart with individual points showing the expression of selected miRNAs in control and Gpr109A‐silenced C2C12 myoblasts exposed to LPS (1 μg/ml) in the presence or absence of either NaB (3 mM), MK1903 (1 μM), or rosiglitazone (1 μM). NaB was also tested in the presence or absence of either rosiglitazone (1 μM) or T007 (1 μM).
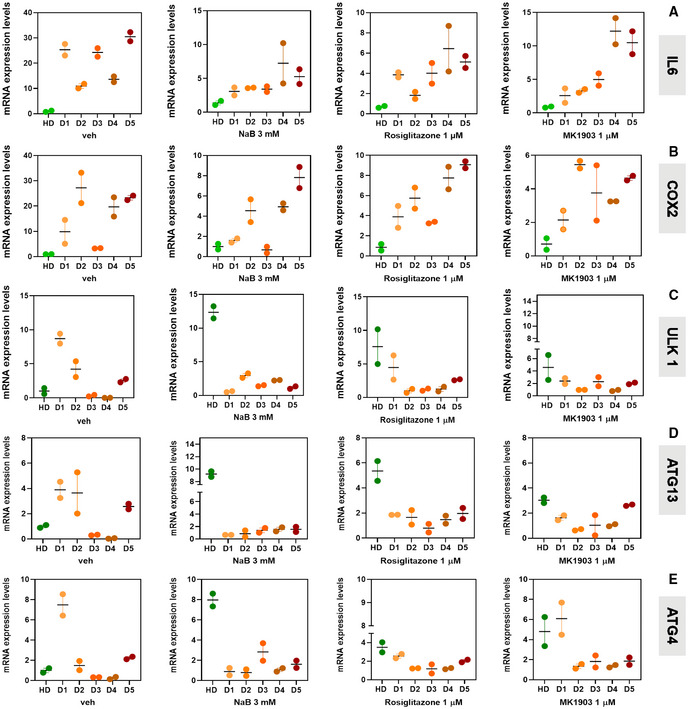
- A–E
Bar chart showing the mRNA expression levels of IL6, COX2, ULK 1, ATG13, and ATG4 mRNA in primary human myoblasts isolated from one healthy donor (HD) and five DMD donors (D1–D5).
Comment in
-
When dysbiosis meets dystrophy: an unwanted gut-muscle connection.EMBO Mol Med. 2023 Mar 8;15(3):e17324. doi: 10.15252/emmm.202217324. Epub 2023 Feb 27. EMBO Mol Med. 2023. PMID: 36843560 Free PMC article.
References
-
- Annuzzi G, Piscitelli F, Di Marino L, Patti L, Giacco R, Costabile G, Bozzetto L, Riccardi G, Verde R, Petrosino S et al (2010) Differential alterations of the concentrations of endocannabinoids and related lipids in the subcutaneous adipose tissue of obese diabetic patients. Lipids Health Dis 9: 43 - PMC - PubMed
-
- den Besten G, Bleeker A, Gerding A, van Eunen K, Havinga R, van Dijk TH, Oosterveer MH, Jonker JW, Groen AK, Reijngoud D‐J et al (2015) Short‐chain fatty acids protect against high‐fat diet‐induced obesity via a PPARγ‐dependent switch from lipogenesis to fat oxidation. Diabetes 64: 2398–2408 - PubMed
Publication types
MeSH terms
Substances
LinkOut - more resources
Full Text Sources
