Plasma membrane topography governs the 3D dynamic localization of IgM B cell antigen receptor clusters
- PMID: 36594262
- PMCID: PMC9929642
- DOI: 10.15252/embj.2022112030
Plasma membrane topography governs the 3D dynamic localization of IgM B cell antigen receptor clusters
Abstract
B lymphocytes recognize bacterial or viral antigens via different classes of the B cell antigen receptor (BCR). Protrusive structures termed microvilli cover lymphocyte surfaces, and are thought to perform sensory functions in screening antigen-bearing surfaces. Here, we have used lattice light-sheet microscopy in combination with tailored custom-built 4D image analysis to study the cell-surface topography of B cells of the Ramos Burkitt's Lymphoma line and the spatiotemporal organization of the IgM-BCR. Ramos B-cell surfaces were found to form dynamic networks of elevated ridges bridging individual microvilli. A fraction of membrane-localized IgM-BCR was found in clusters, which were mainly associated with the ridges and the microvilli. The dynamic ridge-network organization and the IgM-BCR cluster mobility were linked, and both were controlled by Arp2/3 complex activity. Our results suggest that dynamic topographical features of the cell surface govern the localization and transport of IgM-BCR clusters to facilitate antigen screening by B cells.
Keywords: 4D bioimage analysis; B cell antigen receptor (BCR); B lymphocyte; cytoskeleton; lattice light sheet microscopy.
© 2023 The Authors. Published under the terms of the CC BY NC ND 4.0 license.
Figures

3D image of an EGFP‐CaaX‐expressing Ramos B cell embedded in Matrigel (left), segmentation of the inner dome (center) using our own script based on Watershed segmentation and segmentation of the cell surface (right) using an nnU‐Net model that we trained based on our self‐generated ground truth. Scale bar = 5 μm.
Cross‐sectional raw intensity images of a SNAP‐IgM‐BCR/EGFP‐CaaX and a SNAP‐CD40/EGFP‐CaaX (only the DY549P1 channel shown) co‐expressing Ramos B cell embedded within a Matrigel and imaged by LLSM in two channels (EGFP, DY549P1). Scale bar = 5 μm.
Maximum intensity projection of surface‐masked image stacks of the cells shown in (B).
Cluster masks generated by a custom cluster detection algorithm based on local contrast.
Cluster granularity score.
Total voxel intensity in segmented clusters (Σci) in comparison with the total voxel intensity within the cell surface mask (Σti).
Enrichment of intensity within the clusters. Average voxel intensity in segmented clusters (μci) in comparison with the average voxel intensity of the non‐clustered (“diffuse”) signal within the cell surface mask (μdi).
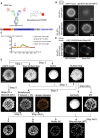
Model of the NIP‐specific SNAP‐tagged mIgM molecule expressed on H/L‐KO Ramos B cells via a retroviral expression vector carrying the cDNA sequence of a SNAP‐tagged μ H‐chain separated by a P2A element from the sequence encoding the λ L‐Chain. The N‐terminal SNAP‐tag is preceded by a leader sequence (LS) and separated from the start of the VH sequence by a 17 amino acid long linker with the sequence A(EAAAK)3A. To visualize the receptors specifically at the B cell surface, the membrane‐impermeable benyzlguanine‐DY549P1 (BG‐DY549P1) was covalently attached to the SNAP‐tag prior to imaging.
Cross‐sectional widefield images of only EGFP‐CaaX‐ and EGFP‐CaaX/SNAP‐IgM‐BCR‐transduced H/L‐KO Ramos B cells at the midline. SNAP‐IgM‐BCR is visualized with the BG‐DY594P1 SNAP‐tag substrate.
Calcium influx response of SNAP‐IgM‐BCR‐expressing H/L‐KO Ramos B cells loaded with Indo1. Cells are stimulated with the indicated reagents.
Cross‐sectional widefield images of SNAP‐IgM‐BCR‐expressing H/L‐KO Ramos B cells stimulated with Streptavidin‐649 pre‐incubated NIP‐15‐BSA‐biotin (50 ng/ml) followed by PBS wash.
Overview of the segmentation protocol for the whole cell surface (introduced in Fig 1) and cell surface features (introduced in Figs 2 and 3). Steps are numbered as explained in the Materials and Methods section.

Color code of shapes according to the shape index metric.
Application of the shape index to the triangular surface mesh to highlight surface structures on a Matrigel‐embedded Ramos B cell. The zoomed area reveals individual microvilli (mv) connecting to each other via positively curved ridges (r) and saddles, surrounding negatively curved cups (c) in a patterned way. Scale bar whole cell = 5 μm, inset = 1 μm.
Extraction of the ridge network on the B cell surface. Ridges were extracted from raw EGFP‐CaaX images (left) using a Hessian‐based algorithm and superimposed on the raw image (right). Scale bar = 5 μm.
The skeletonized ridge network including the microvilli protrusions superimposed on the mesh representation of the cell surface. The ridges, their connecting nodes and the microvilli tips are indicated by the yellow, blue and red color, respectively.
Node degree analysis of the skeletonized ridge network. Bars and error bars represent mean ± SD (n = 4, 30‐time frames/cell).
Enlarged images of (D) displaying exemplary 3‐ and 4‐degree nodes with or without microvillus association.
Percentage of the nodes without or with microvillus association. Bars and error bars represent mean ± SD (n = 4, 30‐time frames/cell).

- A
Topographical features of the B cell surface. The cell body is separated from the microvilli (MV) protrusions using mathematical morphology. On the cell body, the ridge (R) network (yellow) is computed and its nodes (N; blue) are annotated. The remaining surface area is termed shallow invaginations (SI, dark green). Individual microvilli are split into their shaft (MS, purple) and tip (MT, red) and all features are combined in one image. Scale bar = 5 μm.
- B
Segmented IgM‐BCR clusters (black) are superimposed onto the extracted surface features. Cluster‐surface feature overlay reveals the accumulation of IgM‐BCR clusters on ridges and their nodes. The zoomed‐in microvillus displays a cluster density at its root (corresponding to a node) and tip. Scale bar inset = 1 μm.
- C
Cluster density at surface features. IgM‐BCR cluster density within different topographical features quantified as cluster count per surface feature volume.
- D
Normalized cluster density. Comparison of mean cluster densities computed in (C) as normalized to the value of shallow invaginations. The black squares indicate the SI‐normalized cluster density of randomly assigned cluster centroids on the cell surface. Bars and error bars represent mean ± SD.
- E
IgM‐BCR intensity enrichment within the segmented clusters at different surface features, calculated for the cells quantified in (C). Intensity enrichment was measured by dividing the average voxel intensity in the IgM‐BCR clusters (μci) by the average voxel intensity of the non‐clustered IgM‐BCR residing within the surface feature mask (μdi). Data points and error bars represent mean ± SD.
- F–H
Continuous analysis of IgM‐BCR cluster density using geodesic distance maps initiated from (F) microvilli tips towards microvilli roots, (G) centerline of ridges towards cell body surface, and (H) nodes towards cell body surface. Data points and the dotted lines represent mean ± SD. Scale bars = 5 μm.

- A
Volume distribution of the different surface features as a fraction of the total surface, computed from the surface mask of untreated cells.
- B–D
Fold change in the mean intensity of EGFP‐CaaX (B), IgM‐BCR (C), and CD40 (D) within the ridge plus node (R + N) and microvilli (MV) feature masks normalized to the mean intensity at the shallow invaginations (SI) feature mask.
- E–G
Continuous analysis of CD40 cluster density using geodesic distance maps initiated from (E) microvilli tips (MT) towards microvilli (MV) roots, (F) centerline of ridges (R) towards cell body surface and (G) nodes (N) towards cell body surface.
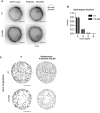
Phalloidin‐Alexa Fluor 555 staining of fixed and permeabilized Ramos B cells expressing EGFP‐CaaX and IgM‐BCR with or without 30 min 100 μM CK‐666 treatment. Scale bar = 5 μm.
Node degree analysis of the skeletonized ridge network in untreated and 100 μM CK‐666‐treated cells for up to 30 min. Mean ± SD (n = 4 for untreated and n = 5 for CK‐666).
Sum projections of nodes and skeletonized ridge network (excluding the microvilli) in an untreated and 100 μM CK‐666‐treated cell for 15 consecutive time frames (duration: 37.5 s). Scale bar = 5 μm.
- A, B
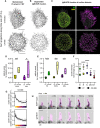
Sum projections of the skeletonized ridge network and microvilli (A) and segmented IgM‐BCR clusters (B) in an untreated and 100 μM CK‐666‐treated cell for 15 consecutive time frames amounting to 37.5 s. Scale bars = 5 μm.
- C
Color coding of the segmented IgM‐BCR clusters in (B) according to their assigned surface feature. Green clusters correspond to shallow invaginations (SI), yellow to ridge plus nodes (R + N), purple to microvilli (MV) and microvilli tips (MT).
- D, E
Staticity scores for different surface features (R + N, MV; D) and for segmented IgM‐BCR clusters assigned to different surface features (E) in untreated and 15–30 min 100 μM CK‐666‐treated cells. Violin plot solid lines represent the median and dotted lines represent the quartiles.
- F
IgM‐BCR intensity enrichment within the segmented clusters at different surface features. Intensity enrichment was measured by dividing the average voxel intensity in the IgM‐BCR clusters (μci) by the average voxel intensity of the non‐clustered (“diffuse”) IgM‐BCR residing within the surface feature mask (μdi). Data points and the error bars represent mean ± SD.
- G
Continuous analysis of IgM‐BCR cluster density in 15–30 min 100 μM CK‐666‐treated cells using geodesic distance maps initiating from distinct surface features (centerline of ridges, nodes and microvilli tips; to compare with untreated in Fig 3F). Data points and the dotted lines represent mean ± SD.
- H
Time‐course images of EGFP‐CaaX and IgM‐BCR intensity in an elongating microvillus in an untreated cell (purple, microvilli mask). Scale bar = 1 μm.
- A
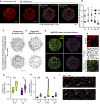
IgM‐BCR cluster distribution upon Ag stimulation. Ramos B cells in the Matrigel were stimulated with 50 ng/ml NIP‐15‐BSA Ag. Ag‐MC on the B cell surface were segmented and overlaid with the ridge network (including microvilli) with a 1.25× and 3.0× local intensity cut‐off for cluster detection. Scale bar = 5 μm.
- B
IgM‐BCR intensity enrichment within the segmented clusters at different surface features for unstimulated (US) and Ag‐stimulated cells. Intensity enrichment was measured by dividing the average voxel intensity in the IgM‐BCR clusters (μci) by the average voxel intensity of the non‐clustered (“diffuse”) IgM‐BCR residing within the different surface feature masks (μdi). Data points and the error bars represent mean ± SD.
- C, D
Sum projections of the skeletonized ridge network and microvilli (C) and segmented IgM‐BCR clusters (D) in Ag‐stimulated cells with a low and high staticity score (duration: 37.5 s). Scale bar = 5 μm.
- E
Color coding of the segmented IgM‐BCR clusters in (D) according to their assigned surface feature. Green clusters correspond to shallow invaginations (SI), yellow to ridges plus nodes (R + N), purple to microvilli (MV) and microvilli tips (MT).
- F
Close‐up of the encircled region in (E) displaying IgM‐BCR localization, sum projections of the ridge network and segmented clusters. Ridge network lacking Ag‐MC are not stabilized. Scale bar = 1 μm.
- G, H
Staticity scores for different surface features (R + N, MV; G) and for segmented IgM‐BCR clusters assigned to different surface features (H) in unstimulated and Ag‐stimulated cells. Violin plot solid lines represent the median and dotted lines represent the quartiles.
- I
Time course images of an Ag‐MC undergoing displacement on ridges. Scale bar = 1 μm.
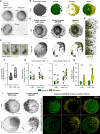
Phalloidin‐Alexa555 staining of fixed and permeabilized Ramos B cells expressing EGFP‐CaaX and IgM‐BCR with or without 2 μM LatA treatment for 30 min. Scale bar = 5 μm.
Topographical features of the Ramos B cell surface in a cell treated with 2 μM LatA for 15–30 min. LatA‐treated cells display disorganized and polarized elevations. The cell is morphologically separated into smooth (green) and elevated (yellow) regions. Scale bar = 5 μm.
Time frames from a LatA‐treated cell in which stable elevations undergo merging. Scale bar = 1 μm.
Surface‐masked EGFP‐CaaX and IgM‐BCR signal and overlay of segmented elevations (yellow) with the surface‐masked IgM‐BCR signal in cells treated with LatA and LatA+Ag (50 ng/ml NIP‐15‐BSA). Scale bars = 5 μm.
Time frames from a LatA+Ag cell showing directed movement of Ag‐MC towards the elevations (yellow). Each Ag‐MC shown with a different colored arrow. Scale bar = 1 μm.
IgM‐BCR intensity enrichment within all the segmented clusters in LatA and Lat + Ag cells.
Cluster density at surface features. Quantification of the IgM‐BCR cluster density in terms of cluster count per surface feature volume for all segmented IgM‐BCR clusters (left panel, local contrast cutoff = 1×) and for Ag‐MC (right panel, local contrast cutoff = 3×).
Staticity scores for segmented IgM‐BCR clusters on smooth and elevated regions in LatA and LatA+Ag cells.
Surface‐masked EGFP‐CaaX and IgM‐BCR signal for a LatA and LatA+Ag cell and the sum projections of their segmented IgM‐BCR clusters (duration: 37.5 s). IgM‐BCR clusters are color‐coded (green and yellow) according to their assigned surface region. Scale bar = 5 μm.
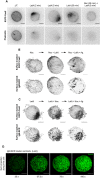
Maximum intensity projections of widefield microscopy stacks of fixed and permeabilized Ramos B cells stained with Phalloidin‐Alexa Fluor 555. Accumulation of EGFP‐CaaX corresponds to the large protrusive structure formed by 2 μM LatA treatment. Cells treated with the indicated drugs and time. Scale bar = 5 μm.
Surface‐masked EGFP‐CaaX and IgM‐BCR in cells treated incrementally with 20 μM Noc (30 min), 2 μM LatA (30 min) and 50 ng/ml NIP‐15‐BSA (Ag). Representative cells from two independent experiments shown. Scale bar = 5 μm.
Surface‐masked EGFP‐CaaX and IgM‐BCR in cells treated incrementally with 2 μM LatA (30 min), 20 μM Noc (30 min) and 50 ng/ml NIP‐15‐BSA (Ag). Representative cells from two independent experiments shown. Scale bar = 5 μm.
Iterative sum projections of the segmented cluster centroids assigned to the smooth regions of a LatA‐treated cell to display their collective trajectory after 25, 37.5, 75 and 100 s. Scale bar = 5 μm.
References
Publication types
MeSH terms
Substances
Grants and funding
LinkOut - more resources
Full Text Sources

