

Jacob-induced transcriptional inactivation of CREB promotes Aβ-induced synapse loss in Alzheimer's disease
- PMID: 36594364
- PMCID: PMC9929644
- DOI: 10.15252/embj.2022112453
Jacob-induced transcriptional inactivation of CREB promotes Aβ-induced synapse loss in Alzheimer's disease
Abstract
Synaptic dysfunction caused by soluble β-amyloid peptide (Aβ) is a hallmark of early-stage Alzheimer's disease (AD), and is tightly linked to cognitive decline. By yet unknown mechanisms, Aβ suppresses the transcriptional activity of cAMP-responsive element-binding protein (CREB), a master regulator of cell survival and plasticity-related gene expression. Here, we report that Aβ elicits nucleocytoplasmic trafficking of Jacob, a protein that connects a NMDA-receptor-derived signalosome to CREB, in AD patient brains and mouse hippocampal neurons. Aβ-regulated trafficking of Jacob induces transcriptional inactivation of CREB leading to impairment and loss of synapses in mouse models of AD. The small chemical compound Nitarsone selectively hinders the assembly of a Jacob/LIM-only 4 (LMO4)/ Protein phosphatase 1 (PP1) signalosome and thereby restores CREB transcriptional activity. Nitarsone prevents impairment of synaptic plasticity as well as cognitive decline in mouse models of AD. Collectively, the data suggest targeting Jacob protein-induced CREB shutoff as a therapeutic avenue against early synaptic dysfunction in AD.
Keywords: Alzheimer's disease; Amyloid pathology; CREB; Jacob; early synaptic dysfunction.
© 2023 The Authors. Published under the terms of the CC BY NC ND 4.0 license.
Figures
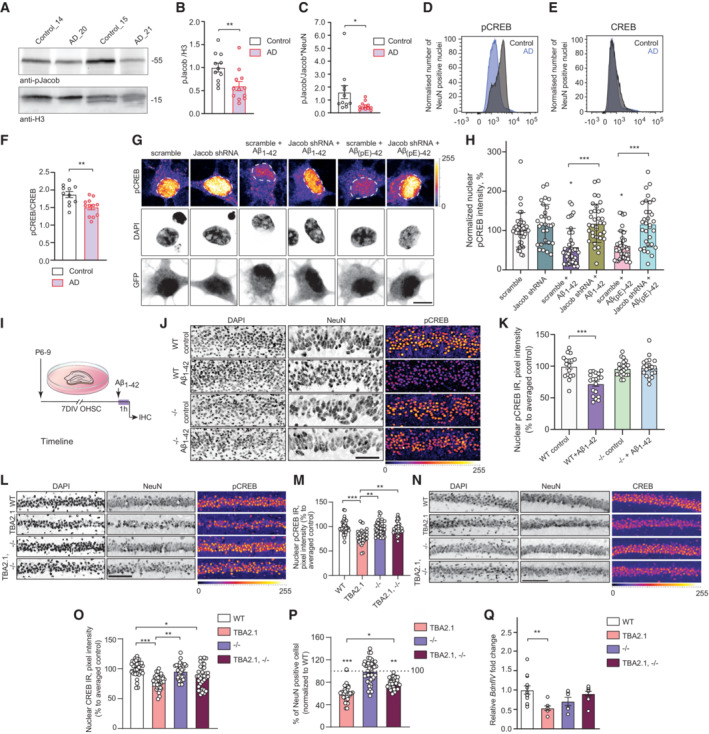
- A–C
Jacob and CREB expression in human AD. (A, B) Total pJacob protein levels and (C) The ratio of normalized levels of pJacob/Jacob (panel B and EV1C) corrected by NeuN (panel EV1E) is significantly reduced in the temporal cortex of AD patients as compared to the age‐matched control group. All samples are normalized to Histone3 (H3). N = 11–12 different subjects.
- D–F
FACS of neuronal nuclei revealed significantly decreased pCREB, but not CREB, immunoreactivity in AD patients as compared to the control group. (D, E) Frequency distribution plot of neuronal nuclei immunoreactivity of (D) pCREB and (E) CREB (no statistically significant difference). (F) pCREB/CREB ratio in neuronal nuclei. N = 11–12 different subjects.
- G, H
Jacob shRNA knockdown prevents Aβ‐induced CREB shutoff. (G) Representative confocal images of hippocampal neurons transfected with Jacob‐shRNA or scrambled (scr) shRNA control (both expressing GFP) and treated with oligomeric preparations of Aβ1‐42 or Aβ3(pE)‐42. (H) Neurons transfected with a Jacob knockdown construct did not display reduction of pCREB immunofluorescence intensity after treatment with Aβ1‐42 or Aβ3(pE)‐42. Bar plot of mean nuclear pCREB intensity normalized to untreated control. Scale bar: 10 μm. N = 29–39 nuclei from two independent experiments.
- I–K
Acute (1 h) treatment with 1 μM Aβ1‐42 does not induce CREB shutoff in organotypic hippocampal slices from Jacob (−/−) mice. (J) Representative confocal images of slices immunolabeled against pCREB, co‐labeled with NeuN and DAPI. Scale bar: 100 μm. (K) Bar plot of pCREB, N = 17–21 slices.
- L, M
The quantification of pCREB intensity in NeuN‐positive cells revealed a statistically significant decrease in pCREB immunoreactivity in TBA2.1 but not in double transgenic animals (TBA2.1, −/−). (L) Representative confocal images of CA1 cryosections from 13 weeks old mice stained for NeuN, DAPI, and pCREB. Scale bar: 100 μm. Data represented as cumulative frequency distribution. (M) Bar plot of average hippocampal pCREB nuclear immunoreactivity normalized to WT. N = 34–38 hippocampal sections from 10 to 11 animals.
- N, O
The quantification of CREB intensity in NeuN‐positive cells revealed a statistically significant decrease in CREB immunoreactivity in Jacob/Nsmf knockout (−/−) and TBA2.1 × Jacob/Nsmf knockout (TBA2.1, −/−) mice. (N) Representative confocal images of CA1 cryosections from 13 weeks old mice stained for NeuN, DAPI, and CREB. Scale bar: 100 μm. (O) Bar plot of CREB nuclear immunoreactivity normalized to WT. N = 34–36 hippocampal images from 8 to 11 animals.
- P
Double transgenic TBA2.1 Jacob/Nsmf knockout (TBA2.1, −/−) mice display significantly lower neuronal loss compared to TBA2.1 mice. The number of NeuN‐positive cells was normalized to wild‐type (WT) group. N = 36–47 CA1 images analyzed from 10 to 12 animals per genotype. Dotted line marks value of the normalized control group −100%.
- Q
Jacob knockout rescues decrease in the BdnfIV gene transcription. Bar plot of mean BdnfIV transcript levels in hippocampal homogenates normalized to β‐actin as reference transcript. N = 5–10 hippocampi.
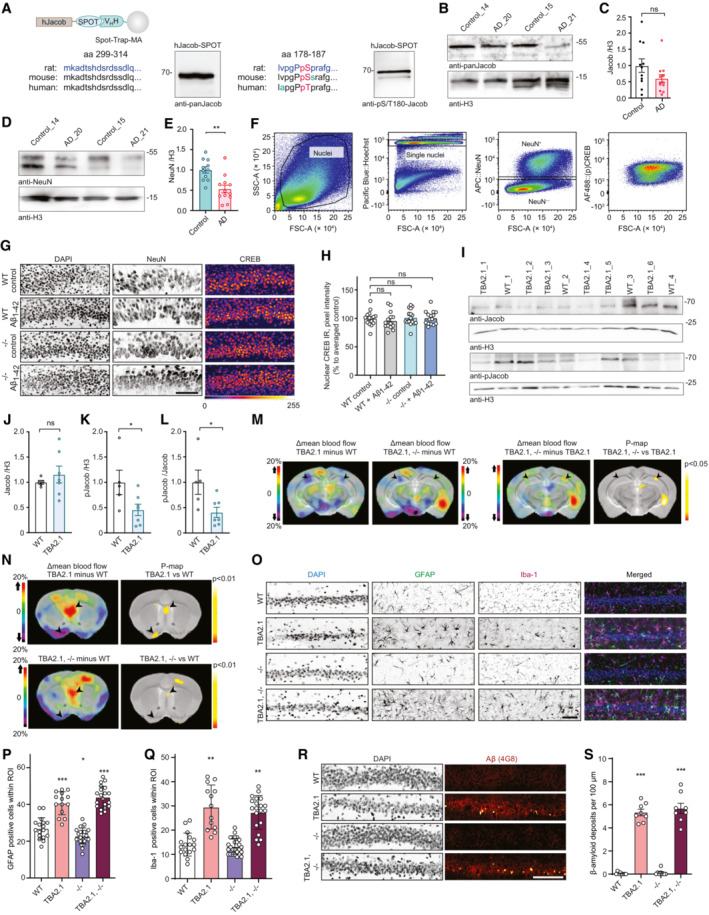
- A
Validation of Jacob and pJacob antibodies for detection of the human protein. Human Jacob fused to a Spot tag was expressed in HEK293T cells for antibody detection. The rat amino acid sequence of Jacob used for generation of pan‐Jacob antibodies is highly conserved in human and mouse and the antibody effectively detects human Jacob.
- B, C
Total Jacob protein levels are not significantly reduced in brain samples from Alzheimer's disease (AD) patients as compared to the control group. (C) Bar plots representing the quantification of Jacob immunoreactivity normalized to H3. N = 11–12 protein extracts from different subjects in each group.
- D, E
Total NeuN protein levels are significantly reduced in brain samples from AD patients as compared to the control group. (C) Bar plots representing the quantification of NeuN immunoreactivity normalized to H3. N = 11–12 protein extracts from different subjects in each group.
- F
Scatter plots representing gating strategy used in FACS experiments for neuronal pCREB and CREB immunoreactivity quantification.
- G, H
Acute (1 h) Aβ1‐42 treatment does not induce changes in pan CREB levels in organotypic hippocampal slices from Jacob (−/−) mice. (G) Representative confocal images of slices immunolabeled against pCREB, co‐labeled with NeuN and DAPI. Scale bar: 100 μm. (H) Bar plot of CREB immunoreactivity averaged per slice, N = 14–16 slices.
- I
pJacob level and pJacob/panJacob ratio are decreased in TBA2.1 mouse line compared to WT animals. Representative images of the immunoblot probed with antibodies against pJacob, pan‐Jacob, and re‐probed with Histone3 (H3).
- J–L
Bar plots representing the quantification of (J) Jacob, (K) pJacob levels and the (L) pJacob/Jacob ratio normalized to H3. N = 5–7 hippocampal protein extracts.
- M
Significant changes in cerebral blood flow between TBA2.1 and WT, TBA2.1, −/− and WT, and TBA2.1 and TBA2.1, −/− as determined by 99mTc‐HMPAO SPECT measurements. Difference images overlay over a reference MR for comparison with TBA2.1 mice as described on panel labeling. Bregma −2.5. Statistically significant differences between TBA2.1 and double transgenic animals were detected in dorsal CA1 (regions indicated by arrowheads). N = 10 animals (P < 0.05) by two‐tailed Student's t‐test.
- N
Significant changes in cerebral blood flow between TBA2.1 and WT, TBA2.1, −/− and WT as determined by SPECT measurements. Statistically significant differences between TBA2.1 or double transgenic animal and WT were detected in lateral septal nucleus and the diagonal band nucleus (regions indicated by arrowheads) (P < 0.01) by two‐tailed Student's t‐test.
- O–Q
The quantification of glial cells revealed no major differences between TBA2.1 and double transgenic animals (TBA2.1, −/−). (O) Representative confocal images of distal CA1 sections from 13 weeks old mice stained for GFAP, DAPI and Iba‐1. Scale bar: 100 μm. (P) Bar plot representing the number of GFAP‐positive cells per rectangular region of interest. N = 17–24 cryosections from 5 to 7 animals per genotype. (Q) Bar plot representing the number of Iba‐1‐positive cells per rectangular region of interest. N = 17–26 cryosections from 5 to 7 animals per genotype.
- R, S
The quantification of Aβ plaques revealed no major differences between TBA2.1 and double transgenic animals (TBA2.1, −/−). (R) Confocal images averaged from two sections of the molecular layer of 13‐week‐old mice distal CA1 labeled for amyloid‐β (4G8 antibody) and co‐stained with DAPI. Scale bar: 100 μm. (S) Bar plot representing the number of amyloid‐β‐positive puncta per 100 μm. N = 8, number of cryosections from two animals per genotype.
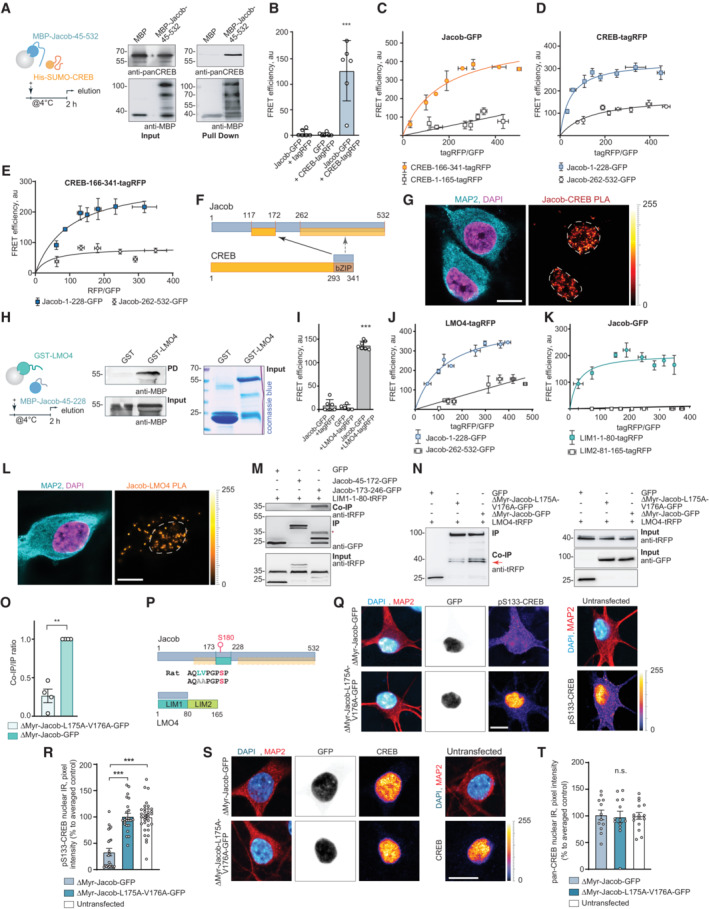
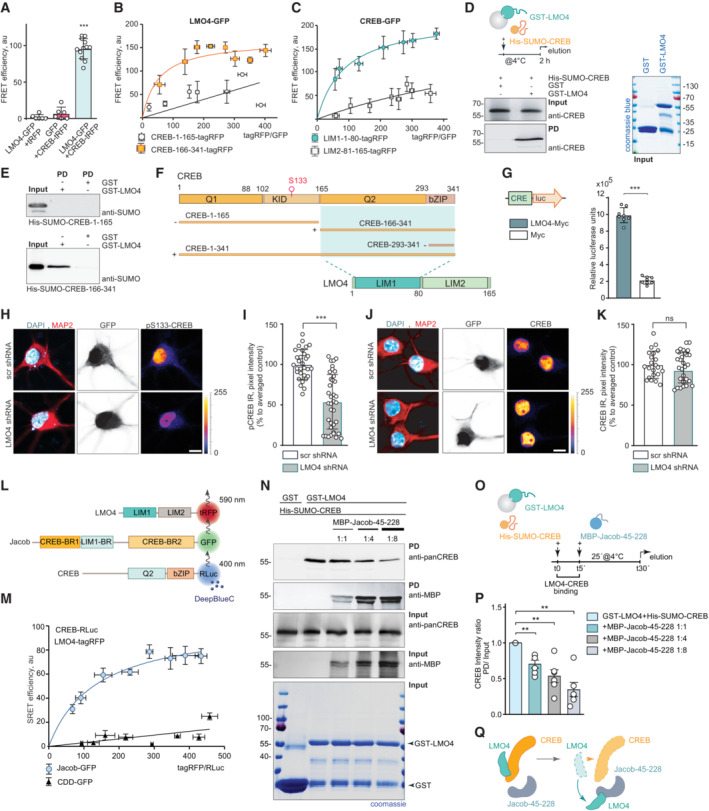
- A
Pull‐down assays confirm a direct interaction of MBP‐Jacob‐45‐532 and His‐SUMO‐CREB.
- B
Fluorescence resonance energy transfer (FRET) measurements show an association between CREB‐tagRFP and Jacob‐GFP. N = 5 independent experiments measured in triplicates.
- C–E
(C) The C‐terminus (CREB‐166‐341‐tagRFP) but not the N‐terminus (CREB‐1‐165‐tagRFP) of CREB closely associates with Jacob‐GFP in FRET saturation experiments. (D) Both the N‐ (Jacob‐1‐228‐GFP) and the C‐terminus (Jacob‐262‐532‐GFP) of Jacob are in close proximity to CREB‐tagRFP; however, the Jacob‐1‐228‐GFP association with CREB is significantly stronger. (E) The C‐terminus of CREB (CREB‐166‐341‐tagRFP) associates prominently with the N‐terminus (Jacob‐1‐228‐GFP) and less strong with the C‐terminus (Jacob‐262‐532‐GFP) of Jacob. (C–E) FRET efficiency is presented in arbitrary units from 5 to 6 independent experiments.
- F
Binding interfaces between CREB and Jacob.
- G
A proximity ligation assay revealed an interaction between Jacob and CREB in primary neurons. Dashed ROIs indicate neuronal nuclei. Scale bar: 10 μm.
- H
GST‐LMO4 but not GST alone directly binds to MBP‐Jacob‐45‐228. From left to right: A scheme depicting experimental procedure, image of membrane probed with anti‐MBP antibody, and the Coomassie blue‐stained gel showing the purity of proteins used as an pull‐down input.
- I
FRET experiments revealed that Jacob‐GFP interacts with LMO4‐tagRFP. N = 5–7 independent experiments measured in triplicates.
- J, K
FRET saturation experiments indicate the association of Jacob‐1‐228‐GFP with LIM‐1‐80‐tagRFP. FRET efficiency is presented in arbitrary units as a mean of 6 independent experiments measured in triplicates.
- L
A proximity ligation assay revealed an interaction between Jacob and LMO4 in primary neurons. Scale bar: 10 μm.
- M
Co‐immunoprecipitation experiments to map the binding region of Jacob to the LIM1 domain of LMO4 revealed the association with Jacob‐179‐246‐GFP, but not with Jacob‐45‐172‐GFP (CREB‐binding region).
- N, O
Heterologous co‐immunoprecipitation experiments between LMO4‐tagRFP and nuclear ΔMyr‐Jacob‐GFP, ΔMyr‐Jacob‐L175A‐V176A‐GFP or GFP point to a decreased association of ΔMyr‐Jacob‐L175A‐V176A‐GFP with LMO4 as compared to ΔMyr‐Jacob‐GFP. N = 4 independent experiments.
- P
Binding interfaces between Jacob and LMO4.
- Q–T
A Jacob‐LMO4‐binding mutant expressed in the nucleus does not induce CREB shutoff. (Q, S) Representative confocal images of hippocampal neurons transfected with ΔMyr‐Jacob‐GFP (Jacob targeted to the nucleus) or ΔMyr‐Jacob‐L175A‐V176A‐GFP. Scale bar: 10 μm. Lookup table indicates the pixel intensities from 0 to 255. (R, T) The mean of nuclear (R) pCREB or (T) CREB immunoreactivity in Jacob‐expressing neurons was normalized to non‐transfected controls. N = 23–33 neuronal nuclei from two independent cell cultures.
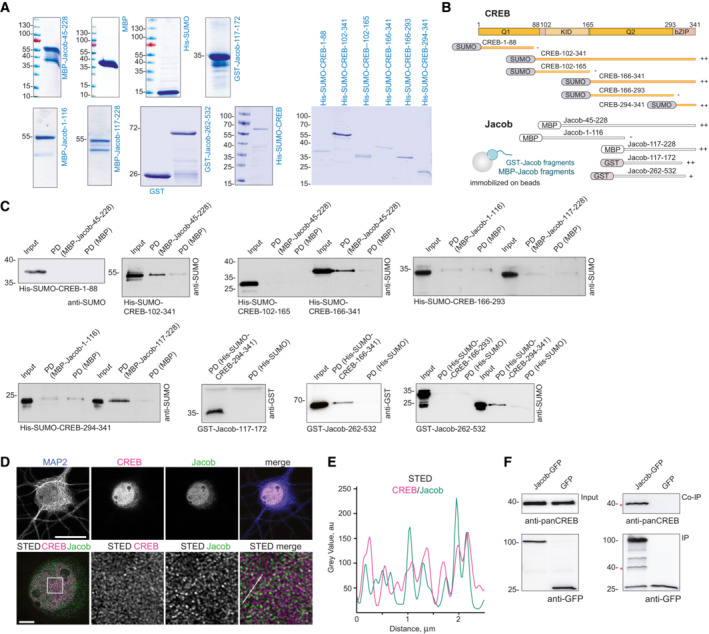
- A
Coomassie blue staining depicting the purity of bacterially produced proteins used for pull‐down assays between CREB and Jacob.
- B
Scheme representing the constructs used for mapping of the interaction sites in Fig 1D and Appendix Fig S1B.
- C
The N‐terminus of Jacob (117‐172 aa in red) interacts with the bZIP domain of CREB, but not with the Q1 (1‐88 aa), KID (102‐165 aa), or Q2 (166‐293 aa) domain. The C‐terminus of Jacob (262‐532 aa) shows weaker binding to the bZIP domain of CREB. Images of immunoblots representing pull‐down assays performed with Jacob and CREB protein fragments depicted in the panel (B).
- D, E
Confocal and STED images show an association of CREB with Jacob in the nucleus of DIV16 hippocampal primary neurons. (D) The upper panel represents deconvolved confocal images. Lower panels depict deconvolved STED images. Scale bars: 20 and 5 μm, respectively. Inserts are denoted by a white square. (E) Line profiles indicate the overlap of relative intensities for CREB and Jacob along a 2.5 μm line.
- F
Endogenous CREB co‐immunoprecipitate with overexpressed Jacob‐GFP, but not GFP from HEK293T cell extracts. The asterisk denotes the CREB band from a membrane subsequently re‐probed with an anti‐GFP antibody.
- A
Fluorescence resonance energy transfer (FRET) measurements indicate a tight association between LMO4‐GFP and CREB‐tagRFP. N = 6–12 independent experiments measured in triplicates.
- B, C
FRET saturation experiments with (B) LMO4‐GFP and CREB‐1‐165‐tagRFP or (C) CREB‐166‐341‐tagRFP and CREB‐GFP and LIM1‐1‐80‐tagRFP or LIM2‐81–165‐tagRFP revealed an association between the LIM1 domain of LMO4 and the C‐terminus of CREB. N = 8 independent experiments.
- D
Recombinant His‐SUMO‐CREB directly binds to GST‐LMO4 in pull‐down experiments.
- E
The interaction between CREB with LMO4 is mediated by the C‐terminus of CREB (166‐341 aa), but not by its N‐terminus (1‐165 aa), as evidenced by pull‐down experiments between recombinant His‐SUMO‐1‐165‐CREB, His‐SUMO‐166‐341‐CREB, and GST‐LMO4.
- F
Schematic representation of CREB and LMO4 domain structure and fusion constructs used for the experiments. Light green boxes represent the interaction interface.
- G
Myc‐LMO4 overexpression increases CREB‐dependent luciferase expression in HEK293T cells expressing luciferase under the CRE promoter. Relative luciferase units in cells overexpressing Myc‐LMO4 as compared to Myc‐transfected controls. N = 8 from two independent experiments.
- H–K
Knockdown of LMO4 reduces nuclear pCREB immunoreactivity. (H, J) Representative confocal images of hippocampal neurons transfected with LMO4 shRNA construct or scrambled control (both expressing GFP under CMV promoter as a transfection control). Scale bar: 10 μm. Dot plots representing the mean of nuclear (I) pCREB or (K) CREB staining intensity normalized to scrambled control. N = 30–37 nuclei analyzed from at least 3 independent cell cultures.
- L, M
(L) Schematic representation of constructs used in SRET experiments. “BR” stands for binding region. (M) SRET saturation experiments reveal that Jacob‐GFP forms a triple complex with CREB‐RLuc and LMO4‐tagRFP. A caldendrin (CDD‐GFP) construct was used as negative control. N = 8 independent experiments.
- N–Q
The N‐terminus of Jacob displaces LMO4 from CREB. (N) GST‐LMO4 coupled to beads was preincubated with His‐SUMO‐CREB and subsequently incubated with an increasing amount of MBP‐Jacob‐45‐228. (O) Schematic depicts the timeline of the competition pull‐down experiment. (P) Bar graphs represent six independent experiments per condition.
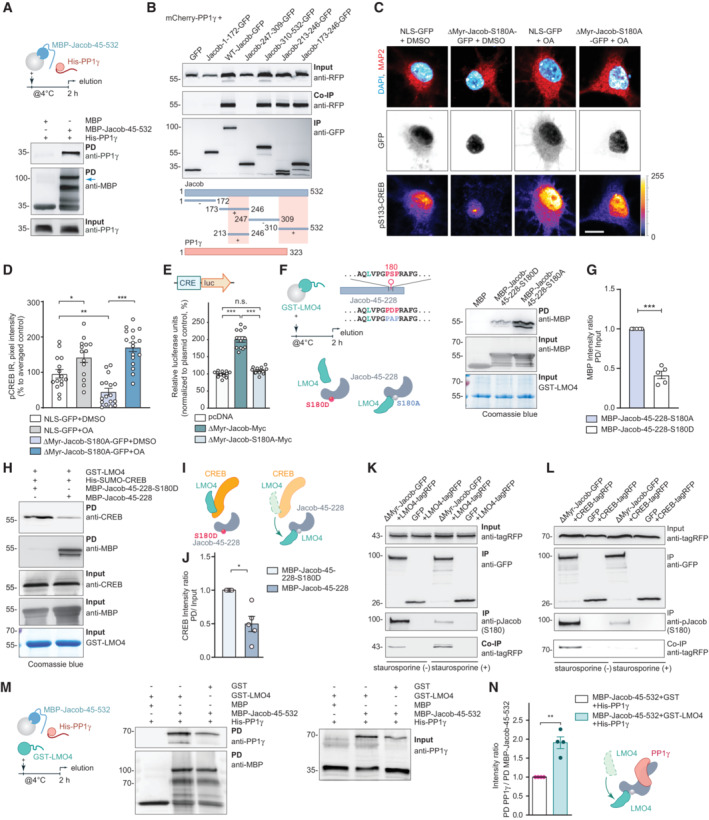
- A
Pull‐down experiments confirmed a direct interaction between recombinant MBP‐Jacob‐45‐532 and His‐PP1γ.
- B
Mapping of the mCherry‐PP1γ interaction region within the Jacob sequence revealed binding of a C‐terminal fragment (Jacob‐310‐250‐GFP) as well as the N‐terminal part (Jacob‐173‐246‐GFP) where the region between 213‐246 aa is sufficient for immunoprecipitation. The pink boxes in the schematic indicate binding regions.
- C, D
Treatment of hippocampal primary neurons expressing phosphodeficient Jacob in the nucleus with okadaic acid (OA) rescues Jacob‐induced cAMP‐responsive element‐binding protein (CREB) shutoff. Confocal images of pCREB immunostaining in DIV15 neurons overexpressing ΔMyr‐Jacob‐S180A‐GFP with and without OA treatment. Scale bar: 20 μm. Lookup table indicates the pixel intensities from 0 to 255. N = 14–17 nuclei analyzed from two independent cell cultures.
- E
Overexpression of ΔMyr‐Jacob‐Myc but not the phospho‐deficient mutant (ΔMyr‐Jacob‐S180A‐Myc) positively regulates CREB‐dependent luciferase expression. N = 12 measurements from three independent experiments.
- F, G
Phosphodeficient N‐terminus of Jacob (MBP‐Jacob‐45‐228‐180A) interacts with LMO4 stronger than its phosphomimetic form (MBP‐Jacob‐45‐228‐180D). (G) Quantification of MBP immunoreactivity normalized to input. Data are presented from five independent experiments.
- H–J
Phosphomimetic Jacob mutant (MBP‐45‐228‐180D) does not displace LMO4 from CREB. Recombinant GST‐LMO4 was coupled to beads, preincubated with His‐SUMO‐CREB and subsequently incubated in 1:8 ratio with MBP‐Jacob‐45‐228 or MBP‐45‐228‐180D. (J) Quantification of the CREB band intensity normalized to the input. N = 5 independent experiments.
- K
Treatment with staurosporine decreases Jacob phosphorylation level (S180), but increases its association with LMO4‐tagRFP. Immunoblot of HEK293T cells extracts transfected with LMO4‐tagRFP and ΔMyr‐Jacob‐GFP or GFP alone.
- L
Treatment with staurosporine decreases the association of Jacob with CREB. Immunoblot of HEK293T cells extract transfected with CREB‐tagRFP and ΔMyr‐Jacob‐GFP or GFP as a control.
- M, N
The association of Jacob with LMO4 enhances its interaction with PP1γ in pull‐down assays. (M) PP1γ interacts with Jacob as a dimer (70 kDa) that forms during purification. (N) Bar graph represents quantification of PP1γ immunoreactivity normalized to MBP‐Jacob. N = 5 independent experiments.
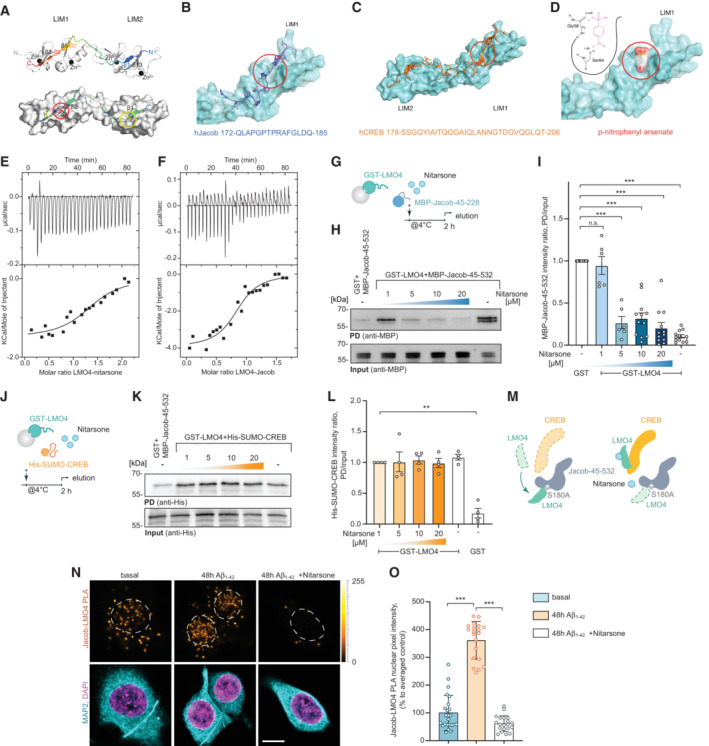
- A
Template structure of an LMO4:peptide complex based on fusion protein LMO4:Ldb1 LID (protein databank (PDB) ID: 1RUT). LIM1‐LIM2 tandem domains are folded and stabilized by 4 zinc atoms (black spheres) and bind to a 29 residues long peptide in anti‐parallel orientation. The binding occurs mainly via 3 well defined β‐strands (β1, β3, β4) interacting with corresponding β‐strands of LMO4 (β13, β5, β3). A positional alanine scan highlighted two hydrophobic binding pockets (red & yellow circle, lower panel) as hotspots of that complex allowing only residues Ile (red), Leu, Met, or Val (yellow) to be buried in each of the pockets. The peptide and the residues are rainbow color coded according to the positional alanine scan (ΔΔG (kcal/mol)) from 0% (blue, no side chain effect) to 100% (red, critical conserved residue).
- B
hJacob residues 172–185 bind to the LIM1 domain.
- C
hCreb binds to LIM1 and LIM2 similar to Ldb1.
- D
Nitarsone (p‐nitrophenyl arsonic acid) fits to the hydrophobic binding pocket of LIM1 and can form two hydrogen bonds. (B–D) Red circles mark the Nitarsone binding pocket.
- E, F
Isothermal titration calorimetry (ITC) analysis of LMO4 (E) Nitarsone or (F) Jacob interaction. ITC thermograms for sequential dilutions. Upper panel presents raw data, with heat pulses illustrating exothermic binding. Lower panel depicts binding curve of integrated heat measurements with the best fit using one site binding model.
- G–I
Nitarsone disrupts binding of Jacob to LMO4 in a concentration‐dependent manner. (G) Bacterially expressed GST‐LMO4 was immobilized on beads and pre‐incubated with increasing concentrations of Nitarsone, and subsequently with MBP‐Jacob‐45‐532. (H) MBP immunoreactivity normalized to input. N = 6–12 independent experiments. (I) Representative immunoblot probed with anti‐MBP antibody of input and pull‐down with GST as a control.
- J–M
Nitarsone does not disrupt binding of LMO4 to CREB. (J) Scheme showing experimental design. (K) Representative immunoblot probed with anti‐His of input and pull‐down with GST as a control. (L) Bacterially expressed GST‐LMO4 was immobilized on beads and was pre‐incubated with growing concentrations of Nitarsone, and subsequently with His‐Sumo‐CREB. His immunoreactivity normalized to input. N = 4 independent experiments. (M) Graphical summary of preceding experiments. Unphosphorylated Jacob displaces LMO4 from CREB. Nitarsone blocks binding of Jacob and LMO4 without affecting LMO4‐CREB complex.
- N, O
(N) 5 μM Nitarsone reduced Jacob‐LMO4 complex formation in Aβ‐treated (500 nM) primary neurons as revealed by proximity ligation assay. Scale bar: 5 μm. (O) Bar plot of normalized PLA signal intensity. N = 20–24 neuronal nuclei from three cultures.
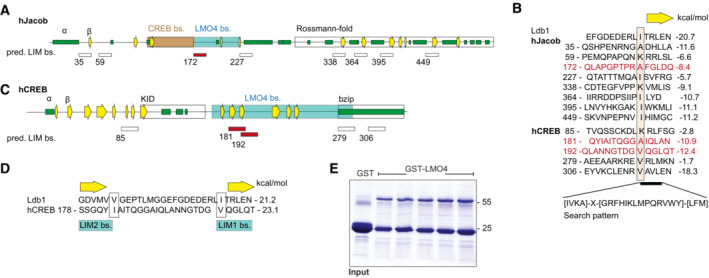
- A–D
Predicted binding sites for LMO4 LIM domains in Jacob and cAMP‐responsive element‐binding protein (CREB). (A) Schematic structure of human Jacob showing predicted secondary structures (helices, green; β‐strands, yellow arrows) and experimentally determined binding regions for CREB (orange) and LMO4 (gray). The C‐terminus of Jacob is predicted to have a Rossmann‐fold similar to caspases. (B) The LIM1 binding peptide of Ldb1 is aligned to 8 sequences of Jacob that match the search pattern for the conserved hydrophobic residues and the adjacent β‐strand. Structures of LIM1:peptides were modeled and free energy ΔΔG were calculated. Only the peptide starting at 172 (red) lies within the LMO4 binding region. In human, CREB 5 matching peptides were identified. (C) Schematic structure of human CREB with labeled LMO4‐binding region and known KID and bZIP domains. (D) The two peptides starting at 181 and 192 are within the LMO4‐binding region and align to Ldb1 peptide where 181 binds to LIM2 and 192 to LIM1.
- E
Image of gels stained with coomassie blue showing the purity of bacterially produced GST‐LMO4 used for pull‐down assay.
- A, B
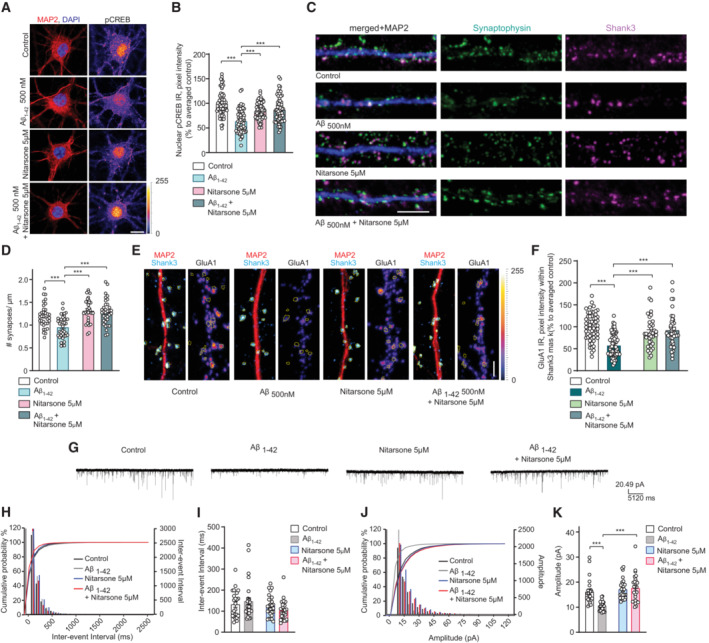
Co‐application of Nitarsone prevents Aβ‐induced CREB shutoff. DIV16 hippocampal cultures were treated with 5 μM Nitarsone, 500 nM Aβ1‐42, 5 μM Nitarsone with 500 nM Aβ1‐42 or vehicle control for 48 h and stained for pCREB, MAP2, and DAPI. (A) Representative confocal images. Scale bar: 10 μm. (B) Nuclear pCREB immunoreactivity normalized to control. N = 63–67 nuclei from three independent cultures.
- C, D
Treatment with Nitarsone rescues Aβ1‐42–induced synaptic loss. DIV16 hippocampal cultures were incubated with 5 μM Nitarsone, 500 nM Aβ1‐42, 5 μM Nitarsone with 500 nM Aβ1‐42 or vehicle control for 48 h and stained for Shank3, Synaptophysin, and MAP2. (C) Representative confocal images of dendritic segments. Scale bar: 5 μm. (D) Number of synaptic puncta per 1 μm. N = 33–38 dendritic segments from four independent cultures.
- E, F
Treatment with Nitarsone rescues Aβ1‐42–induced decrease of synaptic GluR1‐immunoreactivity within Shank3. DIV16 dissociated, hippocampal cultures were treated with 5 μM Nitarsone, 500 nM Aβ1‐42, 5 μM Nitarsone with 500 nM Aβ1‐42 or vehicle control for 48 h and stained for Shank3, surface GluR1, and MAP2. (E) Representative confocal images of dendritic segments. Scale bar: 5 μm. (F) GluR1‐immunoreactivity within Shank3 signal. N = 39–61 of dendritic segments from four independent cell cultures.
- G–K
Nitarsone administration rescues mEPSC amplitude. (G) Analog traces of mEPSCs recorded in DIV16 hippocampal neurons treated with 500 nM Aβ1‐42, 5 μM Nitarsone, 5 μM Nitarsone with 500 nM Aβ1‐42 or vehicle control for 48 h. (H, J) Cumulative probability plots of (I) inter‐event interval or (K) amplitude. Quantification of (I) inter‐event‐interval and (K) amplitude. N = 24–28 neurons from four independent cell cultures.
- A–C
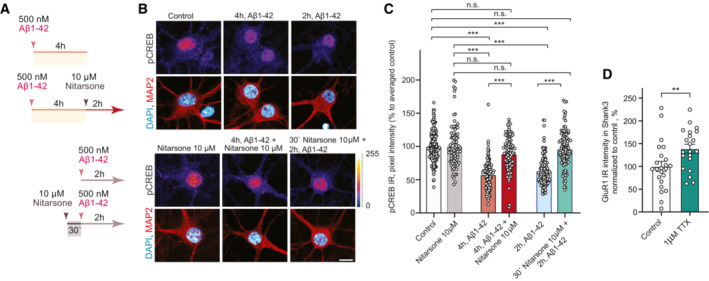
Acute treatment with 10 μM Nitarsone rescuses Aβ1‐42‐induced CREB shutoff. (A) Scheme of the experimental design. The dissociated, hippocampal cell cultures at DIV16 were either pre‐treated for 30 min with 10 μM Nitarsone and subsequently 2 h with 500 nM Aβ1‐42 or the drug was added 2 h after the 500 nM Aβ1‐42 treatment. The pCREB immunoreactivity was measured in comparison to vehicle control. (B) Representative confocal images of hippocampal neurons. Lookup table indicates the pixel intensities from 0 to 255. Scale bar: 10 μm. (C) Bar plot representing nuclear pCREB immunostaining intensity normalized to vehicle control. N = 88–101 from 5 to 7 independent cell cultures. ***P < 0.001 by two‐way ANOVA with Sidak's post hoc test.
- D
Treatment with 1 μM TTX induced upregulation of GluR1 surface expression. N = 21–23 dendritic segments from three independent cell cultures. **P < 0.01 by two‐tailed Student's t‐test.
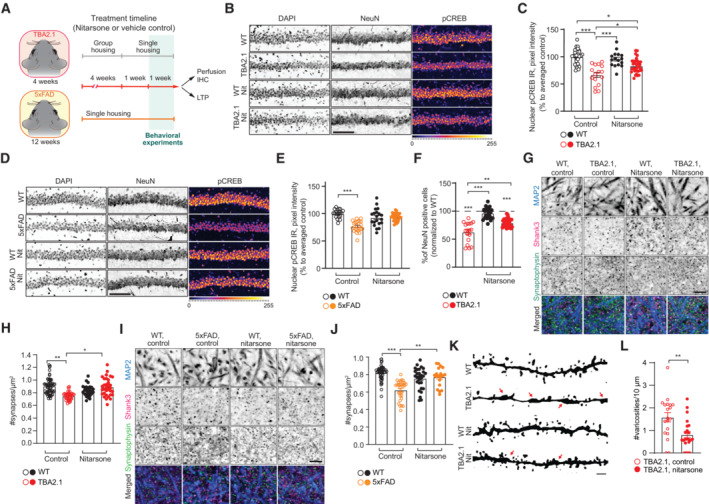
- A
Scheme representing the timeline of treatment with Nitarsone of TBA2.1 and 5xFAD mice.
- B, C
Nitarsone rescues the reduction of pCREB immunoreactivity in NeuN positive cells in the CA1 region of TBA2.1 mice. (B) Representative confocal images of cryosections from 11 weeks old mice stained for NeuN, DAPI, and pCREB. Scale bar: 10 μm. (C) Bar plot of pCREB nuclear staining intensity. N = 21–34 hippocampal sections from 6 to 9 animals.
- D, E
Nitarsone rescues the reduction of pCREB immunoreactivity in NeuN‐positive cells in the CA1 region of 5xFAD mice. (D) Representative confocal images of CA1 cryosections from 18 weeks old mice stained for NeuN, DAPI, and pCREB. Scale bar: 10 μm. (E) Cumulative frequency distribution of pCREB nuclear staining intensity. N = 22–27 hippocampal sections from 6 to 7 animals.
- F
Nitarsone reduces neuronal loss in TBA2.1 animals. The average number of NeuN‐positive cells normalized to WT treated with vehicle. N = 28–31 CA1 images analyzed from 6 to 9 animals per genotype.
- G, H
Nitarsone prevents synapse loss in SLM of CA1 of TBA2.1 mice. (G) Representative confocal images of SLM from 11‐week‐old mice stained for MAP2, Shank3, and Synaptophysin. Scale bar: 5 μm. (H) Number of synaptic puncta per ROI. N = 27–55 ROIs from 6 to 10 animals.
- I, J
Nitarsone prevents synapse loss in SLM of CA1 of 5xFAD mice. (I) Representative confocal images of SLM from 18‐week‐old mice stained for MAP2, Shank3, and Synaptophysin. Scale bar: 5 μm. (J) Number of synaptic puncta per ROI. N = 19–46 ROIs from 6 to 9 animals.
- K, L
Nitarsone reduces number of varicosities in SLM of CA1 of TBA2.1 mice. (K) Representative, confocal images of dendrites filled with biocytin stained from 13 weeks old mice. Arrows indicate varicosities. Scale bar: 1 μm. (L) Number of dendritic swellings per 10 μm. N = 19–22 dendrites from two animals per genotype.
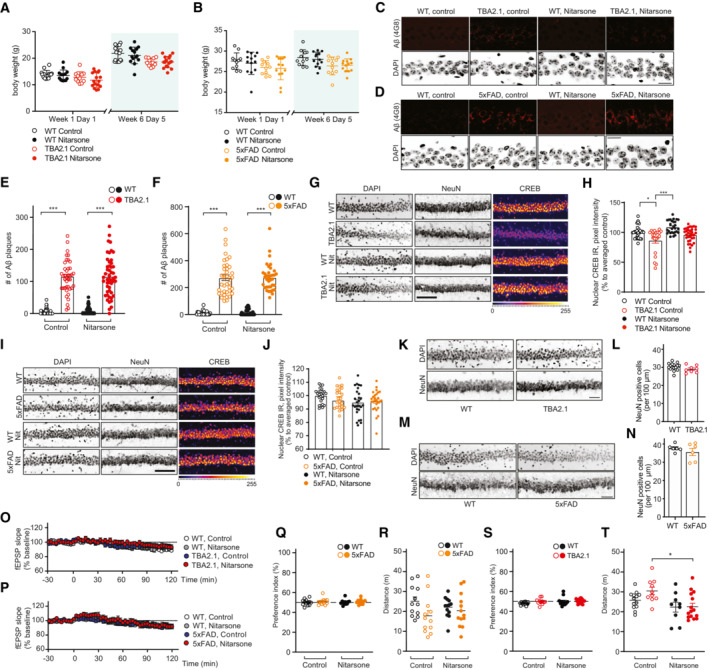
- A, B
Nitarsone treatment did not affect body weight of (A) TBA2.1 (N = 22–24 animals per group) or (B) 5xFAD mice (N = 11–13 animals per group).
- C–F
Nitarsone treatment does not change amyloid load in (C, E) TBA2.1 and (D, F) 5xFAD mice. (C, D) Confocal images averaged from two sections of the molecular layer of CA1 labeled for amyloid‐β (4G8 antibody) and co‐stained with DAPI. Scale bar: 100 μm. (E, F) Bar plots representing the number of amyloid‐β‐positive puncta. (E) TBA2.1 N = 40–50 CA1 regions 6–9 animals per genotype and (F) 5xFAD N = 33–40 CA1 regions 6–7 animals per genotype.
- G, H
Nitarsone rescues the reduction of CREB immunoreactivity in NeuN positive cells in CA1 of TBA2.1 mice. (G) Representative confocal images of CA1 cryosections from 11‐week‐old mice stained for NeuN, DAPI, and CREB. Scale bar: 10 μm. (H) Bar plot of CREB nuclear staining intensity. N = 21–34 hippocampal sections from 6 to 9 animals.
- I, J
Nitarsone does not affect CREB immunoreactivity in NeuN‐positive cells in CA1 of TBA2.1 mice. (I) Representative confocal images of CA1 cryosections from 18‐week‐old mice stained for NeuN, DAPI, and CREB. Scale bar: 10 μm. (J) Bar plot of CREB nuclear staining intensity. N = 28–34 hippocampal sections from 6 to 7 animals.
- K, L
TBA2.1 mice do not display neuronal loss at the beginning of the Nitarsone treatment. (K) Representative confocal images of distal CA1 cryosections from 4 weeks old mice stained for NeuN, DAPI, and CREB. Scale bar: 10 μm. (L) Bar graph representing the average number of NeuN‐positive cells normalized to WT treated with vehicle. N = 8–16 hippocampal sections from 2 to 3 animals.
- M, N
5xFAD mice do not display neuronal loss at the end of the Nitarsone treatment. (M) Representative confocal images of distal CA1 cryosections from 19‐week‐old mice stained for NeuN, DAPI, and CREB. Scale bar: 10 μm. (N) Bar graph representing the average number of NeuN‐positive cells normalized to WT treated with vehicle. N = 6 hippocampal sections from two animals.
- O, P
Basal synaptic transmission is not affected by bath application of Nitarsone in (O) TBA2.1 and (P) 5xFAD mice. TBA2.1: N = 14–18 slices from 5 to 6 mice and 5xFAD: N = 17–18 slices from six mice.
- Q, R
(Q) Nitarsone treatment does not influence preference index and (R) distance traveled during open‐field arena exploration of TBA2.1 mice. N = 12–13 mice per group.
- S, T
(S) Nitarsone treatment does not influence preference in‐dex and (T) slightly normalizes increased distance traveled during open‐field arena exploration of 5xFAD mice. N = 12 mice per group.
- A
Nitarsone rescues late CA1‐LTP impairment in TBA2.1 mice. Insets show representative fEPSPs analog traces at indicated time points: 1 = baseline, 2 = late LTP.
- B
Averaged fEPSP slopes recorded during the last 30 min. N = 14–18 slices from 5 to 6 mice.
- C
Nitarsone rescues late CA1‐LTP impairment in 5xFAD mice. Insets show representative fEPSPs analog traces at indicated time points: 1 = baseline, 2 = late LTP.
- D
Averaged fEPSP slopes recorded during the last 30 min. N = 17–18 slices from six mice.
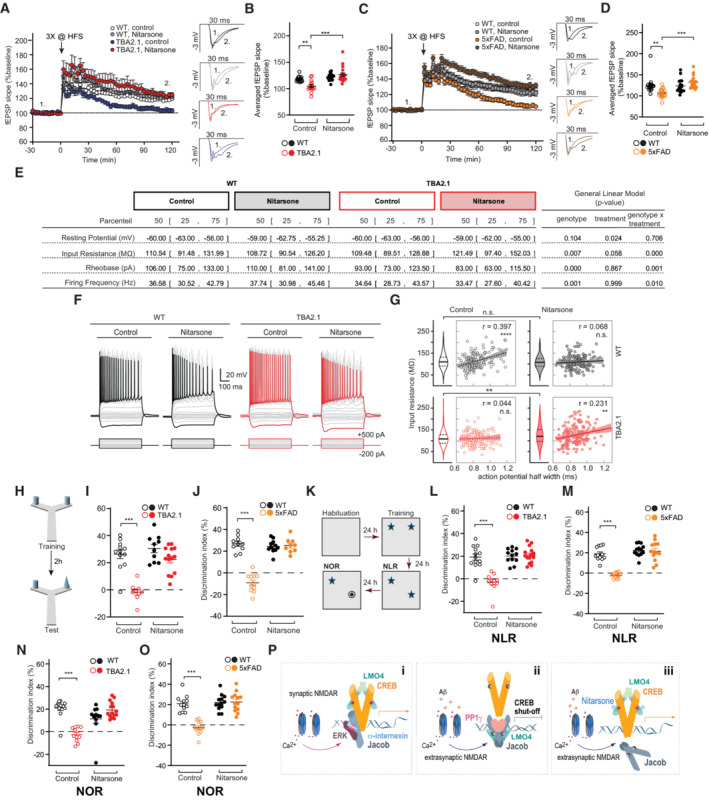
- E–G
Nitarsone treatment changed basic electrophysiological properties of CA1 pyramidal neurons in TBA2.1 mice (E). (F) Step current injection evoked responses of CA1 pyramidal cells from wild‐type (WT) and TBA2.1 mice in control conditions and following Nitarsone‐treatment. Gray and red traces display responses upon step current injections (see Materials and Methods, black (WT) and red (TBA2.1) traces represent −200 and 500 pA current injection). (G) Nitarsone treatment recovers the positive correlation of input resistance and action potential half width that is observed in control conditions. Consistent with a higher availability of CREB, CA1 pyramidal neurons showed a treatment‐induced increase in input resistance in TBA2.1 mice (P = 0.0036, post‐hoc Dunn's comparison). N = 156–166 CA1 pyramidal neurons analyzed from six animals per genotype and treatment.
- H–J
Nitarsone rescues short‐term memory impairment in Y‐maze object recognition task in (I) TBA2.1 N = 9–14 and (J) 5xFAD mice. N = 9–11.
- K–M
Nitarsone rescues the impairment in novel location recognition (NLR) in (L) TBA2.1 N = 11–15 and (M) 5xFAD mice. N = 12–13.
- N, O
Nitarsone rescues the impairment in novel object recognition task (NOR) in (N) TBA2.1 N = 11–15 and (O) 5xFAD mice. N = 12–13.
- P
Jacob couples the origin of NMDAR signals to CREB activity. (i) Synaptic NMDAR signaling leads to nuclear translocation of a trimeric complex consisting of pJacob, pERK1/2, and α‐internexin, which promote CREB phosphorylation. (ii) Activation of NMDARs at extrasynaptic sites by Aβ leads to nuclear import non‐phosphorylated Jacob, displacement of LMO4 from CREB, binding to PP1, and subsequent CREB shutoff. (iii) Nitarsone specifically blocks Jacob‐binding to LMO4 and thereby prevents CREB inactivation.
References
-
- Alexandru A, Jagla W, Graubner S, Becker A, Bäuscher C, Kohlmann S, Sedlmeier R, Raber KA, Cynis H, Rönicke R et al (2011) Selective hippocampal neurodegeneration in transgenic mice expressing small amounts of truncated Aβ is induced by pyroglutamate‐Aβ formation. J Neurosci 31: 12790–12801 - PMC - PubMed
-
- Barco A, Alarcon JM, Kandel ER (2002) Expression of constitutively active CREB protein facilitates the late phase of long‐term potentiation by enhancing synaptic capture. Cell 108: 689–703 - PubMed
Publication types
MeSH terms
Substances
Grants and funding
LinkOut - more resources
Full Text Sources
Other Literature Sources
Medical
Molecular Biology Databases
