. 2023 Jan 3;133(1):e158903.
doi: 10.1172/JCI158903.

Longitudinal liver sampling in patients with chronic hepatitis B starting antiviral therapy reveals hepatotoxic CD8+ T cells

Affiliations

Longitudinal liver sampling in patients with chronic hepatitis B starting antiviral therapy reveals hepatotoxic CD8+ T cells

Shirin Nkongolo et al. J Clin Invest. .

Abstract

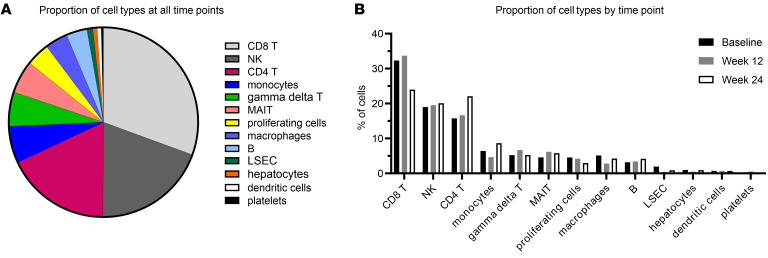
Accumulation of activated immune cells results in nonspecific hepatocyte killing in chronic hepatitis B (CHB), leading to fibrosis and cirrhosis. This study aims to understand the underlying mechanisms in humans and to define whether these are driven by widespread activation or a subpopulation of immune cells. We enrolled CHB patients with active liver damage to receive antiviral therapy and performed longitudinal liver sampling using fine-needle aspiration to investigate mechanisms of CHB pathogenesis in the human liver. Single-cell sequencing of total liver cells revealed a distinct liver-resident, polyclonal CD8+ T cell population that was enriched at baseline and displayed a highly activated immune signature during liver damage. Cytokine combinations, identified by in silico prediction of ligand-receptor interaction, induced the activated phenotype in healthy liver CD8+ T cells, resulting in nonspecific Fas ligand-mediated killing of target cells. These results define a CD8+ T cell population in the human liver that can drive pathogenesis and a key pathway involved in their function in CHB patients.

Keywords: Cellular immune response; Hepatitis; Immunology; Infectious disease; T cells.


Figures

Figure 1
Figure 1. scRNA-Seq revealed 32 different populations.
(A) Cells from all 5 patients at all 3 time points were filtered to exclude low-quality cells and doublets and were clustered and displayed in a UMAP plot. (B) Cell types were assigned to each cluster using selected marker genes. Whenever the dominant cell type of a cluster was unclear, we used differential gene expression testing and analysis of overexpressed signalling pathways in addition to the displayed marker genes.
Figure 2
Figure 2. CD8+ T cells were the most abundant cell type according to scRNA-Seq.
38,036 High-quality cells from all 5 patients at all 3 time points were analyzed. (A) Distribution of cell types across all time points and (B) by time point. Note that due to the sampling method, there are limitations to capturing all cell types present in the liver (in particular, adherent cells); displayed frequencies are relative to all captured cells. CD8+ T cells are the predominant cell type at all time points, but their proportion decreases from baseline to week 24.
Figure 3
Figure 3. Hepatotoxic CD8+ T cells are a unique inflammatory and polyclonal CD8+ T cell population that downregulates immune-related genes as ALT levels decline.
Data pooled from all 5 patients. (A) Heatmap displaying a unique activated immunological signature of hepatotoxic CD8+ T cells at baseline. (B) Proportions of cells in the CD8+ T cell clusters out of all cells obtained at the respective time points. *P < 0.05; ****P < 0.0001, 2-sided z test to test for significant enrichment at baseline or week 24. 3,144 Cells make up the hepatotoxic CD8+ T cell population. (C and D) Numbers of differentially upregulated genes in each CD8+ T cell cluster when comparing baseline and week 12 (C) and baseline and week 24 (D). (E and F) Volcano plot showing genes that are differentially expressed over time by 12 weeks (E) and by 24 weeks (F) in the hepatotoxic CD8+ T cell population. Thresholds: P < 0.005 and fold change ≥ 1.3. Genes upregulated at baseline are shown to the right side of each plot. Genes downregulated at baseline are mainly ribosomal and mitochondrial genes. (G) Expression of immune-related genes in hepatotoxic CD8+ T cells from baseline to week 24. (H) UMAP plot of CD8+ T cell clusters at the time of active liver damage. (I) UMAP plot in (H) overlaid with the respective clonal sizes of TCR clonotypes.
Figure 4
Figure 4. The hepatotoxic CD8+ T cell population can be identified on the protein level in FNAs from patients with active liver damage, but not after 24 weeks of TAF therapy and not in PBMCs.
Using a multicolor flow cytometry panel for FNA samples from 4 CHB patients with ongoing liver damage (A and B) and as ALT levels had largely normalized (C and D) and corresponding PBMC samples from CHB patients with active liver damage (E and F), single, live CD3+ lymphocytes were selected and clustered. Heatmaps show median fluorescence intensity; histograms display the distribution of expression levels for CD8 and key hepatotoxic CD8+ T cell phenotypic markers for each cluster.
Figure 5
Figure 5. The combination of IL-2 and IL-12 induces hepatotoxic CD8+ T cells in healthy donor intrahepatic cells.
(A) IHMCs from 6 healthy donors were treated with IL-2, IL-12, or IL-2 plus IL-12 for 24 hours before quantification of IFN-γ and FasL expression of CXCR6+CD8+ T cells by flow cytometry. Circles and triangles indicate individual donors; bars indicate mean values. Statistical significance was assessed by 2-tailed, ratio-paired t test. (B) A multicolor flow cytometry panel was used to analyze IHMCs from 6 healthy donors, with and without 24 hours of treatment with IL-2 plus IL-12. Single, live CD3+ lymphocytes were selected before clustering. The hepatotoxic CD8+ T cell population, corresponding to baseline FNA samples from CHB patients, was only found in the treated healthy donor IHMCs. Heatmaps show median expression. (C) Source of IL2 and IL12 in CHB patients’ livers at baseline. A targeted scRNA-Seq assay was used to enrich for cytokine genes. Both IL2 and IL12A/IL12B could be detected.
Figure 6
Figure 6. IHMC-derived CD8+CXCR6+ cells corresponding to the hepatotoxic CD8+ T cell population can induce apoptosis in a hepatoma cell line.
(A) Experimental setup: IHMCs from 6 living liver donors were treated with indicated cytokines to induce the population corresponding to hepatotoxic CD8+ T cells. Cells were sorted to obtain the CD8+CXCR6+ subpopulation and cocultured with HepG2-NTCP cells for 24 hours. In parallel, HepG2-NTCP cells were cultivated in IHMC-derived supernatants. The potential of cells or supernatants to induce apoptosis in HepG2-NTCP cells was evaluated by quantifying active caspase-3 using flow cytometry. In addition, we tested to determine whether a neutralizing anti-FasL antibody could inhibit induction of apoptosis. (B) Active caspase-3 in HepG2-NTCP cells that were cocultured with IHMC-derived CD8+CXCR6+ cells. Circles indicate individual donors; bars indicate mean values. Medium only indicates HepG2-NTCP cells without cocultivation. (C) Active caspase-3 in HepG2-NTCP cells after coculture with and without FasL blockade. (D) Histogram from 1 representative donor. (E) Active caspase-3 in HepG2-NTCP cells that were treated with IHMC-derived supernatants. (F) Active caspase-3 in HepG2-NTCP cells after exposure to IHMC-derived supernatants with and without FasL blockade. (G) Histogram from 1 representative donor after exposure to IHMC-derived supernatant. Two-tailed, ratio-paired t test was used to determine statistical significance.

Comment in

References

    1. Odumade OA, et al. Primary Epstein-Barr virus infection does not erode preexisting CD8+ T cell memory in humans. J Exp Med. 2012;209(3):471–478. doi: 10.1084/jem.20112401. - DOI - PMC - PubMed
    1. Sckisel GD, et al. Influenza virus infection results in local expansion of memory CD8(+) T cells with antigen non-specific phenotype and function. Clin Exp Immunol. 2014;175(1):79–91. - PMC - PubMed
    1. Bastidas S, et al. CD8+ T cells are activated in an antigen-independent manner in HIV-infected individuals. J Immunol. 2014;192(4):1732–1744. doi: 10.4049/jimmunol.1302027. - DOI - PubMed
    1. Younes SA, et al. IL-15 promotes activation and expansion of CD8+ T cells in HIV-1 infection. J Clin Invest. 2016;126(7):2745–2756. doi: 10.1172/JCI85996. - DOI - PMC - PubMed
    1. Alanio C, et al. Bystander hyperactivation of preimmune CD8+ T cells in chronic HCV patients. Elife. 2015;4:e07916. doi: 10.7554/eLife.07916. - DOI - PMC - PubMed

Publication types

Substances

LinkOut - more resources